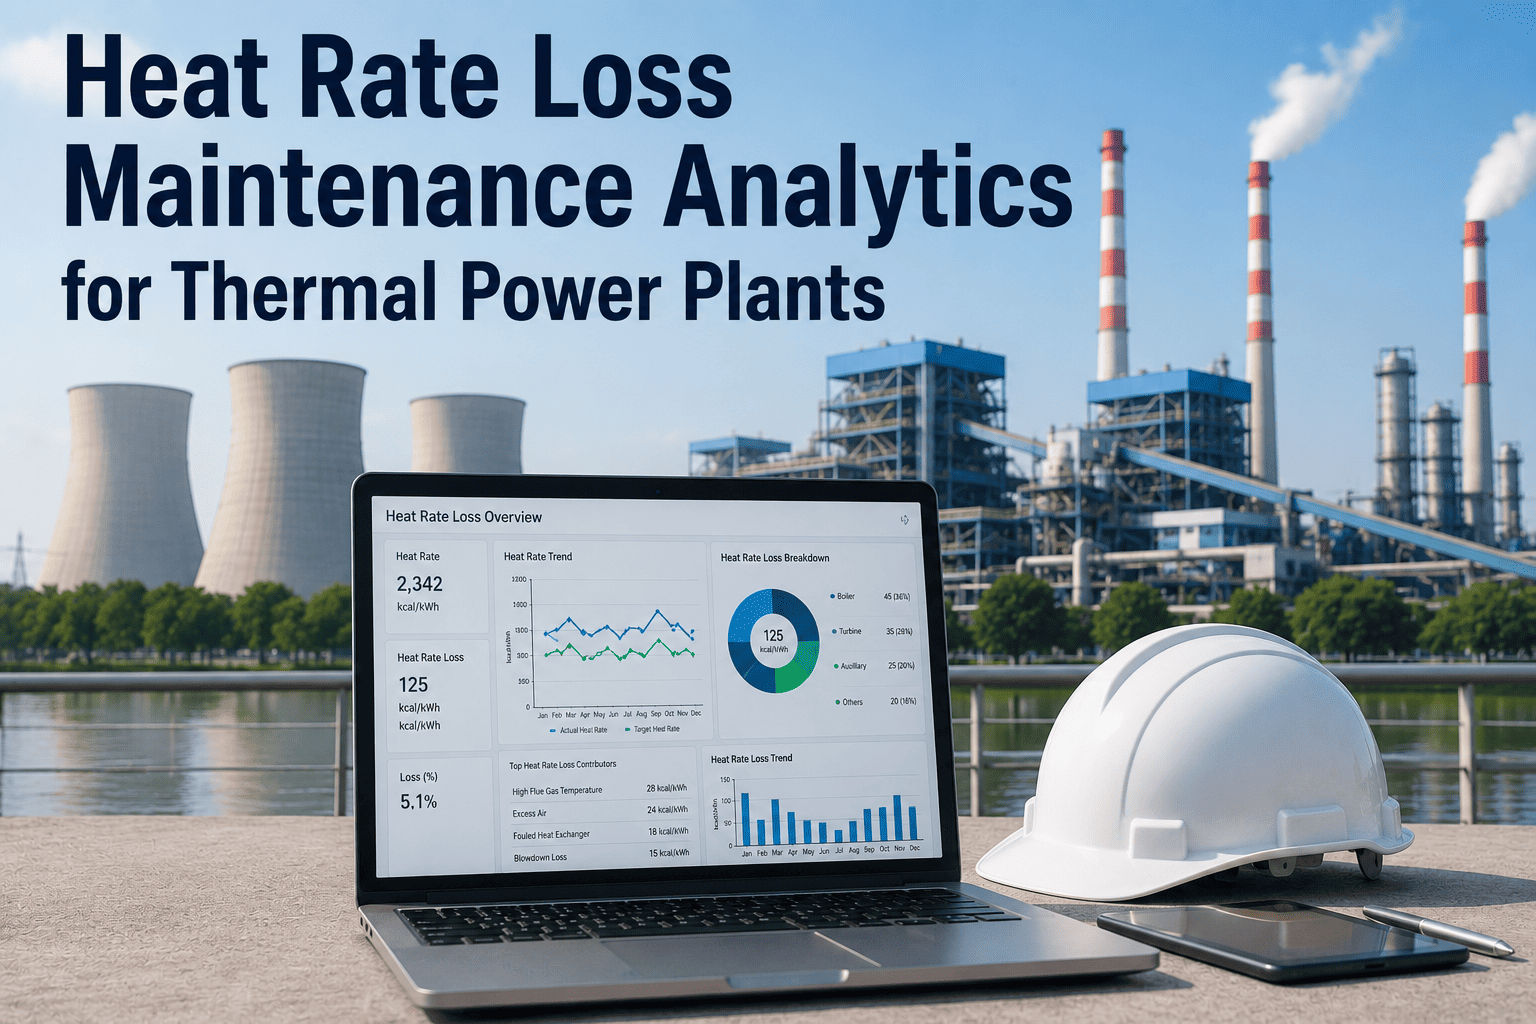
Fuel accounts for nearly 75% of a thermal plant's total operating cost, which is why even a 1% rise in heat rate can quietly erase hundreds of thousands of dollars in annual margin on a mid-size unit. Heat rate rarely jumps in one dramatic event — it drifts upward through fouled condensers, slipping combustion tuning, leaking isolation valves, and deferred sootblower cycles that nobody connects back to the monthly fuel bill until the number has already climbed. By the time the performance report flags the loss, the maintenance gap behind it is usually months old. OxMaint's analytics and reporting engine links maintenance events directly to heat rate trend lines, so your team can trace degradation back to its source. Sign in to OxMaint to see your unit's heat rate loss broken down by asset, or book a demo to walk through your plant's numbers.
Analytics & Reporting / Thermal Performance
Heat Rate Loss Maintenance Analytics for Thermal Plants
See exactly which maintenance gaps are inflating your unit's heat rate, and what every percentage point of drift is actually costing you in fuel spend each month.
Average Untracked Annual Drift
+3.8%
Heat rate increase across plants without maintenance-linked analytics
Condenser & HX fouling
34%
Combustion tuning drift
26%
Steam & valve leakage
21%
Where Heat Rate Quietly Erodes
Plant performance engineers track heat rate. Maintenance teams track work orders. The two data sets rarely sit on the same dashboard — and that's exactly where avoidable fuel cost hides. Here is the typical sequence behind a creeping heat rate, in the order it usually happens on a coal or gas unit.
01
Condenser Fouling Goes Unnoticed
Tube-side scaling and air in-leakage raise backpressure gradually. Without a tracked cleaning schedule tied to vacuum trend data, the loss accumulates for months before anyone questions the turbine heat balance.
02
Combustion Tuning Slips Out of Window
Burner wear and instrument drift push excess air outside the optimal band. Each percentage point of excess air above target adds measurable stack loss that never shows up as a maintenance ticket.
03
Cycle Isolation Valves Begin Leaking
High-energy fluid bypasses the turbine through worn valve seats. Cycle isolation surveys catch this early; without them, the leak is only discovered once the unit's heat rate has already settled at a new, worse baseline.
04
Sootblowing and Cleaning Cycles Get Deferred
When PM compliance slips on boiler cleaning tasks, fouling on heat transfer surfaces compounds. The deferred work order and the rising fuel bill are the same event — but almost never get reported together.
Stop Guessing Where Fuel Cost Is Leaking
See Your Plant's Heat Rate Loss in Dollars, Not Just BTUs
OxMaint correlates your maintenance event history with heat rate trend data, converting BTU/kWh drift into a monthly fuel cost figure your finance team will actually act on.
What OxMaint Heat Rate Analytics Tracks
Fuel Cost Correlation Engine
Every percentage point of heat rate drift is automatically converted into a fuel cost figure using your live fuel price, so performance reviews speak in dollars instead of raw BTU/kWh values that mean little outside the engineering team.
Module: Fuel Cost Correlation
Cycle Isolation Leak Tracking
Log valve-by-valve cycle isolation survey results and trend leakage history against heat rate movement, identifying which specific valves are responsible for the largest share of avoidable fuel cost.
Module: Cycle Isolation Log
Combustion Tuning History
Every combustion tuning event, instrument calibration, and burner inspection is timestamped against heat rate readings, exposing how quickly tuning decays after each adjustment and when the next one is actually due.
Module: Combustion Trend Log
Heat Rate vs PM Compliance View
A single dashboard overlays PM compliance percentage against heat rate trend for the same period, giving performance and maintenance teams shared evidence instead of two disconnected spreadsheets.
Module: Compliance Overlay
A 300 MW Coal Unit, Before and After
A mid-size coal unit running with deferred condenser cleaning, drifted combustion tuning, and no cycle isolation program. Fuel cost at $3.10/MMBtu, generating at a 68% capacity factor.
Heat Rate Before
10,650
Btu/kWh, untracked drift
Heat Rate After
10,260
Btu/kWh, with OxMaint analytics
Annual Fuel Savings
$640K+
At current fuel pricing
Typical Payback
Under 4 mo.
On the analytics rollout cost
Heat Rate Symptoms Mapped to Maintenance Root Cause
| Heat Rate Symptom |
Maintenance Root Cause |
OxMaint Analytics Response |
| Backpressure creeping upward |
Condenser tube fouling, air in-leakage |
Vacuum trend alerts tied to condenser cleaning work order history |
| Excess air above target band |
Burner wear, instrument calibration drift |
Combustion tuning log trended against heat rate readings |
| Unexplained steam flow loss |
Cycle isolation valve leakage |
Valve-level leak survey tracking with cost-of-leak estimates |
| Gradual efficiency baseline shift |
Deferred sootblowing and HX cleaning |
PM compliance overlay flags deferred cleaning before it compounds |
| Reheat temperature shortfall |
Fouled reheater surfaces, damper issues |
Asset-level performance history linked to inspection records |
Frequently Asked Questions
How does maintenance data actually connect to heat rate performance?
Condenser fouling, combustion tuning drift, valve leakage, and deferred cleaning all raise heat rate gradually, and each one originates from a maintenance event that is usually logged separately from performance data. OxMaint links the two records by asset and date, so the correlation becomes visible instead of anecdotal.
Sign in to OxMaint to see this correlation for your own unit.
What is considered a significant heat rate loss for a thermal plant?
Industry estimates suggest several percentage points of efficiency have been lost across many existing thermal units due to aging components and deferred maintenance. Even a 1% increase in heat rate translates into a meaningful annual fuel cost increase on a mid-size unit, which is why small, untracked drifts matter as much as major events.
Can OxMaint quantify heat rate loss in fuel cost rather than Btu/kWh?
Yes. OxMaint's fuel cost correlation engine converts heat rate drift into a live dollar figure using your current fuel price and generation profile, so plant managers and finance teams can review the same number without manual conversion.
Book a demo to see a sample conversion run on your unit's data.
Does fixing heat rate loss require new capital equipment?
Not usually. Many heat rate improvements come from operational and maintenance discipline, such as cycle isolation surveys, combustion tuning cadence, and condenser cleaning schedules, with payback periods typically measured in months rather than years for non-capital fixes.
How quickly can a plant see heat rate analytics results after setup?
Once maintenance history and performance readings are both flowing into OxMaint, correlation trends typically become visible within the first full reporting cycle, since the platform is comparing data you are already collecting rather than waiting on new instrumentation.
Cut Your Hidden Heat Rate Tax
Connect Maintenance to Heat Rate Before It Hits the Fuel Bill
OxMaint's analytics engine traces heat rate drift back to the maintenance event that caused it, giving your team the evidence to fix the source instead of chasing the symptom every reporting cycle.