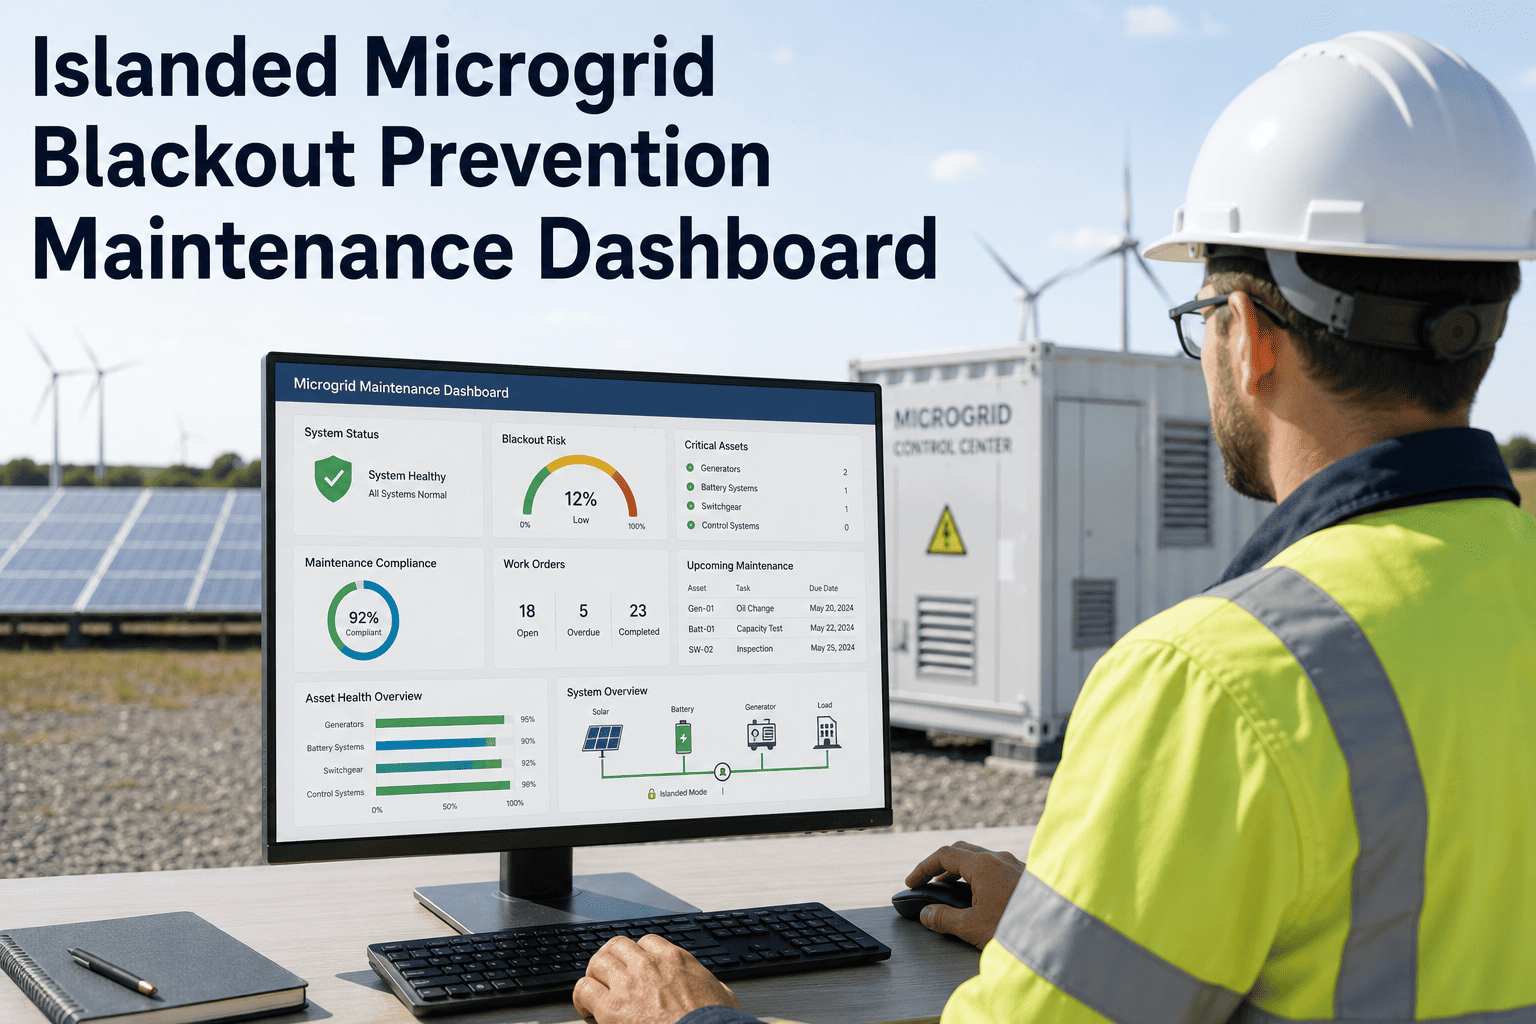
An islanded microgrid has no utility grid to fall back on. When the local generation or distribution system fails, the facility goes dark — and there is no automatic grid reconnection that restores power in milliseconds. For industrial plants, hospitals, data centers, and military facilities operating on islanded microgrids, blackout prevention is not a performance metric — it is an operational requirement that maintenance must actively prove, not just promise. The challenge is that most islanded microgrid operators have no real-time visibility into the maintenance-related risk factors that predict blackouts: battery state of health trending downward, genset PM overdue by three weeks, ATS last tested six months ago. Risk accumulates silently in spreadsheets. OxMaint's Analytics and Reporting dashboard gives islanded microgrid operators a live view of every maintenance risk indicator that drives blackout probability — with trend analysis, asset risk scores, and compliance reporting that turns maintenance data into blackout prevention evidence.
The 5 Maintenance Risk Factors That Precede Islanded Microgrid Blackouts
Post-event analysis of islanded microgrid blackouts consistently identifies the same upstream maintenance failures. These are the indicators your dashboard must track — not after the event, but in real time.
See Your Blackout Risk Score — Live, Not in a Monthly Report
OxMaint surfaces all five risk indicators on a single dashboard, with trend lines, days-overdue counters, and risk thresholds that alert the right person before the risk becomes an outage.
What the OxMaint Islanded Microgrid Dashboard Displays
Before and After: Islanded Microgrid Operations with OxMaint
Reliability Engineer Perspective
Every islanded microgrid blackout I have investigated had a maintenance warning sign that nobody saw because there was no system to surface it. A genset oil service overdue by three weeks. A battery string with declining voltage balance that no alert flagged. A protection relay setting that hadn't been verified since commissioning two years earlier. The technical failure is never the root cause — the root cause is always that the maintenance risk was invisible until the event. A live analytics dashboard doesn't prevent blackouts by magic — it makes the risk visible early enough that someone with a work order and a wrench can act on it before the event occurs. That's the entire value proposition.
Frequently Asked Questions
What KPIs should islanded microgrid operators prioritize for blackout prevention?
The highest-priority leading indicators are genset PM compliance rate, battery state of health trend, and ATS test completion frequency. These three asset conditions account for the majority of islanded blackout events caused by maintenance failure. OxMaint tracks all three on a single dashboard with threshold alerts. Start free to configure your blackout prevention dashboard.
How does OxMaint generate downtime trend reports for islanded microgrid systems?
OxMaint auto-generates downtime trend analysis from work order data — each unplanned work order is tagged by failure category, asset, and time lost. Trend reports show whether reactive events are increasing or decreasing over time, and which assets are generating repeat failures. Reports are exportable for board, insurer, or regulatory review without manual compilation. Book a demo to see the reporting module live.
Can OxMaint track genset start test compliance separately from routine PM?
Yes. Genset start tests, load bank tests, and transfer switch operation tests are configured as separate recurring compliance tasks in OxMaint with their own schedules, checklists, and pass/fail outcome tracking. These compliance tests appear in the critical test calendar on the dashboard and generate alerts when overdue — independent of the routine PM schedule.
How does OxMaint support battery replacement planning based on SOH data?
OxMaint tracks battery condition data logged during maintenance inspections — capacity test results, voltage balance, and thermal readings — against each battery string as an asset. When SOH trends downward through configurable thresholds, OxMaint generates a CapEx recommendation flag and can trigger a replacement planning work order. This converts SOH data from a number into an action. Start a free trial to configure battery health tracking for your site.
What compliance documentation can the OxMaint dashboard produce for islanded microgrid audits?
OxMaint produces full maintenance history reports by asset, by date range, and by work order type — covering PM completion records, test outcomes, inspection results, corrective work orders, and parts used. For regulatory or insurance audits, the complete documentation package is generated in a single export, covering any period requested, with no manual assembly required. Book a demo to see audit documentation in action.
Blackout Risk Doesn't Show Up in a Monthly Spreadsheet. It Shows Up in Real Time.
OxMaint gives islanded microgrid operators a live dashboard of every maintenance-related blackout risk factor — with alerts, trends, and compliance records that prove your site is maintained to the standard your operations require.