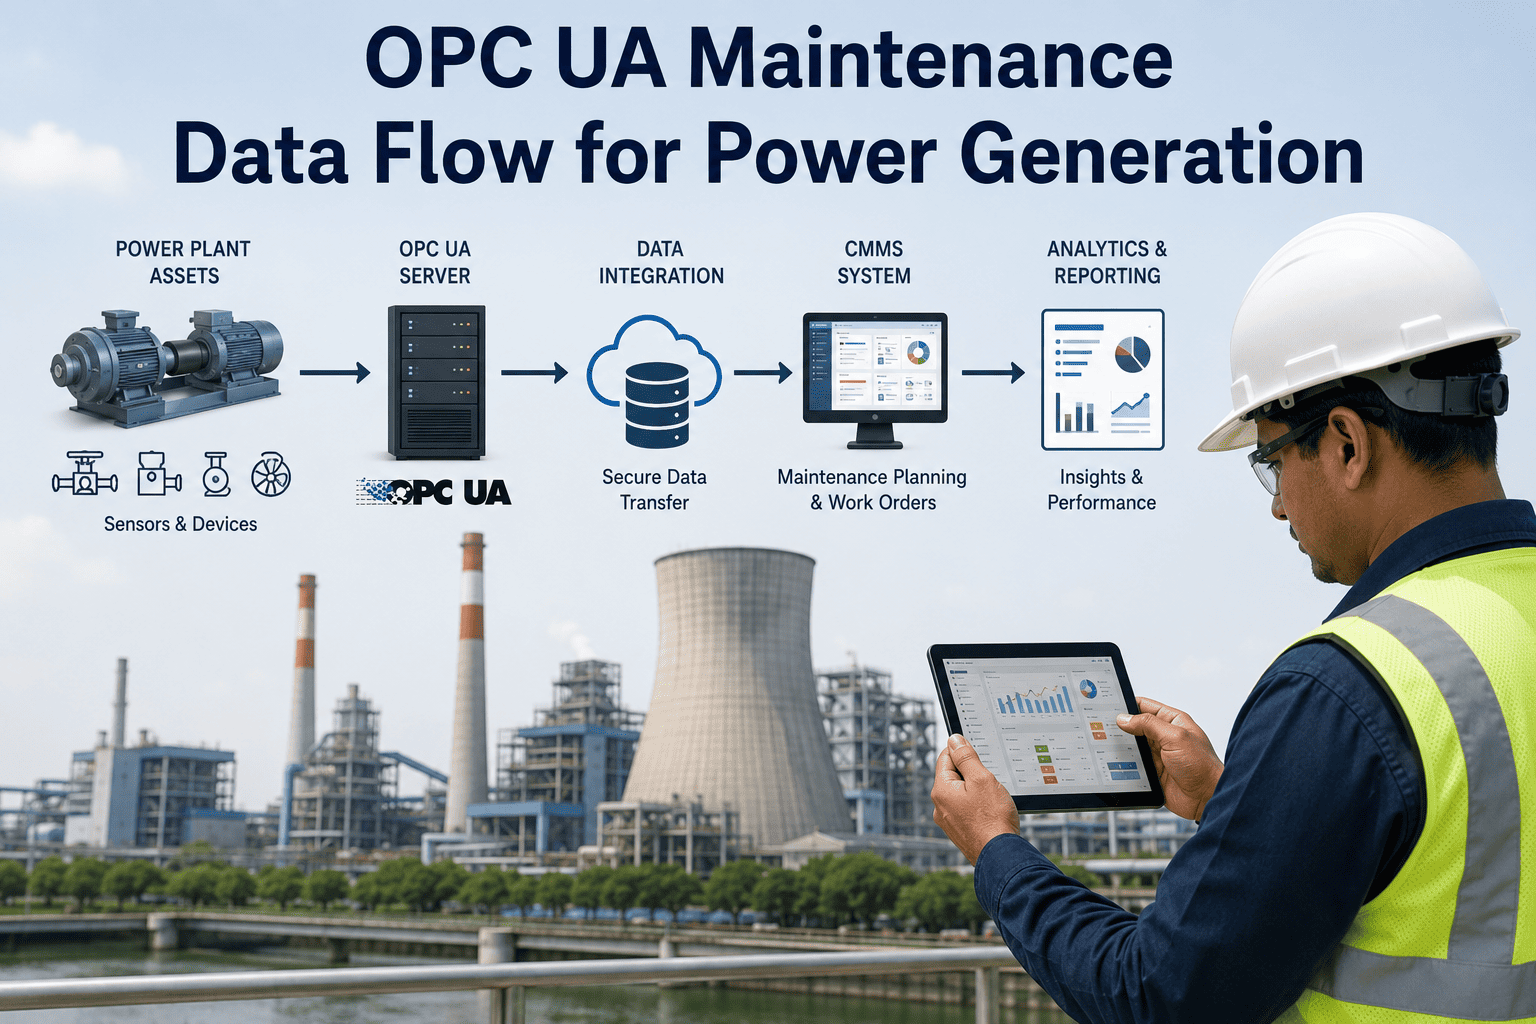
A 600 MW combined-cycle turbine logged a rising bearing temperature for 26 days before it seized at 2:47 AM, forcing 11 days of lost generation at roughly $420,000 per day. The plant's control system had captured every degree of that climb. The maintenance team never saw it — because the data lived inside a SCADA historian that did not speak to the CMMS. This is the gap OPC UA closes. As an open, self-describing industrial protocol, OPC UA carries equipment hierarchies, engineering units, and alarm states from the control layer into maintenance workflows without bespoke middleware. This guide walks through how a maintenance data flow is architected from turbine sensor to work order, and how OxMaint's OPC UA connector turns continuous plant telemetry into action.
$50K–$500K
Cost of a single hour of unplanned outage at a large generation unit, before grid penalties and emergency repair premiums
35–50%
Typical reduction in unplanned outages when condition data flows automatically into maintenance scheduling
<60 sec
Time from a threshold-crossing alarm to a prioritized CMMS work order when the data flow is fully wired
IoT Integration · Power Generation
Connect Your SCADA Historian to Maintenance — Without Touching Your DCS
OxMaint reads OPC UA as a read-only client: equipment hierarchies, engineering units, and alarm states flow into work orders automatically. No middleware, no control-system reconfiguration.
Why the Data Stops at SCADA — and What That Costs
Most power plants already collect thousands of process values every second: turbine speeds, boiler pressures, transformer temperatures, feedwater pump flow rates. That telemetry pours into SCADA systems and historians, where it is used for operations and trending. The problem is structural: SCADA systems speak Modbus, OPC UA, OPC-DA, or proprietary control languages, while modern CMMS platforms run on web APIs. Between them sits a protocol gap. As long as that gap exists, every alarm that fires depends on a human noticing it, judging that it matters, and manually creating a maintenance record. That chain breaks constantly, especially at 3 AM. The result is the most expensive failure mode in power generation: degradation that the control system saw, but the maintenance team never acted on. Turbines account for roughly 43% of power plant equipment failures, generators about 14%, and transformers about 11% — and these failures announce themselves for days or weeks through vibration signatures and thermal drift before they force an outage. OPC UA is the bridge that carries those early signals across the gap.
OT Layer — What SCADA Sees
Turbine bearing temperature climbing 0.4°C/day
Feedwater pump vibration crossing 7.2 kHz
Generator excitation fault flagged
HRSG tube wall thickness trending down
OPC UA
→
Read-only subscription. Typed, self-describing data crosses the IT/OT boundary.
IT Layer — What CMMS Does
Maps the alarm to the correct asset record
Classifies priority by severity and criticality
Generates a work order with full sensor context
Routes it to the right technician and planner
The Five Stages of an OPC UA Maintenance Data Flow
An OPC UA maintenance data flow is not a single connection — it is a pipeline that transforms a raw process value into a structured maintenance action. Each stage adds context. The control system produces a number; the address space gives that number meaning; the subscription delivers it only when it matters; the rule engine decides whether it warrants attention; and the CMMS converts it into work. Understanding this sequence is what separates a brittle one-off integration from a maintenance data architecture that scales across an entire generation fleet.
Stage 1
Source — Field Devices & Control System
Vibration probes, RTDs, pressure transmitters, current transformers, and flow meters feed a turbine controller or DCS — GE Mark VI, Siemens T3000, ABB Symphony, Emerson Ovation, or an OSIsoft PI historian. The OPC UA server exposes these values without changing how the instrumentation operates.
RTDVibrationPressureFlow
Stage 2
Address Space — Self-Describing Information Model
OPC UA does not expose raw registers. It models data in a hierarchical address space where each node carries its data type, engineering units, alarm limits, and relationships. A node like ns=2;s=Turbine1.Bearing3.Temp arrives already labeled as a temperature in °C with a high limit attached — no external documentation needed.
NodesEng. UnitsAlarm Limits
Stage 3
Subscription — Monitored Items, Not Polling
OxMaint's OPC UA client subscribes to the specific nodes that matter for maintenance and lets the server monitor them. Instead of constantly polling, the server sends a notification only when a value changes or crosses a configured deadband. Sampling and publishing intervals are tuned per item, slashing network load while keeping response near real-time.
Monitored ItemsNotificationsDeadband
Stage 4
Rule Engine — Classify & Prioritize
Each incoming event is scored against a configurable rule set: alarm priority, equipment criticality, alarm frequency in a rolling window, and process context. The event is mapped to a work-order tier — immediate dispatch, next-shift response, or scheduled inspection — and noise is suppressed so technicians act on real faults, not sensor artifacts.
SeverityCriticalitySuppression
Stage 5
CMMS — Structured Maintenance Action
OxMaint creates a prioritized work order carrying the asset ID, alarm type, process values at the moment of fault, historical alarm frequency, and recommended procedure — then assigns the technician and notifies the planner. The operator stops transcribing alarm data by hand; the data arrives with full sensor context attached.
Work OrderAsset LinkAuto-Assign
Built for Power Generation
One Prevented Forced Outage Pays for a Decade of CMMS
OxMaint's OPC UA client connects directly to your SCADA or historian, subscribes to the nodes that predict failure, and turns turbine, generator, and HRSG telemetry into work orders weeks before a breakdown — so repairs land in planned windows, not peak generation hours.
Why OPC UA Beats Raw Polling for Maintenance
Maintenance teams care about meaning, not just numbers. A Modbus register read returns a value with no inherent context — you have to know separately that register 40021 is a bearing temperature in tenths of a degree. OPC UA's self-describing model removes that fragility, and its subscription mechanism removes the bandwidth penalty of continuous polling. The table below compares the two approaches across the dimensions that determine whether a maintenance integration survives in production.
| Dimension | Raw Polling (Modbus / OPC-DA) | OPC UA Subscription |
| Data meaning |
Bare register value; units and limits live in external docs |
Self-describing node with type, units, and alarm limits attached |
| Network load |
Constant polling of every point regardless of change |
Notification sent only on change or deadband crossing |
| Asset context |
Flat tag list; no hierarchy |
Equipment hierarchy browsable as a node tree |
| Security |
Typically none at protocol level |
X.509 certificates, authenticated sessions, encryption in transit |
| Setup effort |
Manual mapping of every address by hand |
Browse the address space and subscribe — no prior documentation |
| Maintenance fit |
Brittle; breaks when control config shifts |
Additive, read-only; control system stays untouched |
Mapping the Flow to Real Power-Generation Assets
The data flow is only valuable when it is pointed at the assets that actually cause outages. Turbines, generators, and transformers together drive the majority of mechanical forced outages, and boiler tube leaks alone account for more than half of forced outages at thermal plants. Subscribing OPC UA monitored items to the right early-warning signals on these assets is where the architecture earns its return. The cards below show which signals matter, what they predict, and the failure they intercept.
Combustion & Steam Turbines
Monitored signals: bearing temperature, shaft vibration amplitude and frequency, exhaust temperature spread
Early warning: a 12°C rise above baseline exhaust temperature or a vibration shift at 7+ kHz signals bearing fatigue or combustion-liner degradation days before a trip.
Intercepts: bearing seizure and blade failure — among the costliest forced outages in the fleet.
Generators
Monitored signals: partial discharge, stator winding temperature, excitation fault flags, hydrogen purity
Early warning: rising partial discharge and winding-temperature drift expose insulation degradation while there is still time to plan a repair.
Intercepts: winding insulation failure that takes the unit offline and carries long parts lead times.
HRSG & Boilers
Monitored signals: tube wall thickness trends, drum pressure, superheater metal temperature, feedwater chemistry
Early warning: wall-thickness thinning and metal-temperature excursions flag tube-leak risk — the single largest source of thermal-plant forced outages.
Intercepts: boiler tube leaks responsible for over half of thermal-plant forced outages.
Feedwater & Auxiliary Pumps
Monitored signals: bearing vibration, seal pressure, motor current, lube oil temperature
Early warning: a vibration onset combined with bearing-temperature rise predicts pump bearing failure 72+ hours ahead of seizure.
Intercepts: lube-oil pump and feedwater pump bearing seizures that cascade into turbine trips.
Rolling Out the Integration in Four Phases
A structured rollout eliminates the two biggest risks in industrial integration projects: unexpected protocol incompatibilities and scope creep that drags a deployment past six months. The phased approach below moves from a discovery audit to a tuned, fleet-wide data flow. Because OxMaint connects as a read-only OPC UA consumer, the integration is additive — your DCS and SCADA configuration are never modified, so the project carries no control-system risk.
01
Discovery & Tag Audit
Inventory every field device, PLC, SCADA system, and historian. Document protocols in use, node addresses, sampling needs, and engineering-unit conversions. Rank assets by failure risk and maintenance cost to set the first subscription scope.
02
Connect & Browse the Address Space
OxMaint's OPC UA client authenticates to the SCADA or historian server with X.509 certificates and browses the address space. Equipment hierarchies and engineering units arrive intact, so high-priority nodes are selected without hand-built documentation.
03
Subscribe & Configure Rules
Create monitored items for the priority nodes, tune sampling and deadband, and map each tag to its asset record. Configure threshold rules, priority tiers, and suppression logic in the console — no code required — so only meaningful events become work orders.
04
Tune & Expand Across the Fleet
Review the first 30 days of operational data, refine suppression rules to cut nuisance alarms, and expand the subscription list to additional units. The result is a maintenance data flow that scales from one turbine to an entire generation fleet.
"The control system had been logging the bearing temperature rise for almost four weeks. The moment that data started flowing into our work order system over OPC UA, the failure stopped being a surprise. We schedule these repairs into planned outages now instead of paying emergency rates at three in the morning."
— Maintenance Reliability Lead, 600 MW Combined-Cycle Plant
Frequently Asked Questions
Q1Does connecting OxMaint over OPC UA require changes to our DCS or SCADA configuration?
No. OxMaint connects at the OPC UA or historian layer as a read-only data consumer, which means your control system configuration stays completely untouched. The integration is additive rather than disruptive — it reads the outputs your DCS already produces and never writes back to it. You can validate this against a sample historian environment before any production connection.
Book a demo to see a live read-only connection in action.
Q2Why use OPC UA subscriptions instead of simply polling values on a timer?
Polling forces you to repeatedly read every point regardless of whether anything changed, which loads the network and the control system unnecessarily. OPC UA subscriptions let the server monitor the items and notify the client only when a value changes or crosses a deadband, dramatically reducing transferred data. On top of the efficiency gain, each OPC UA node is self-describing — it arrives with its data type, engineering units, and alarm limits, so maintenance rules have full context without external documentation. That combination is what makes the data flow both efficient and reliable.
Q3Our plant runs a mix of legacy Modbus and modern OPC UA. Can both feed the same flow?
Yes. Most power plant environments run exactly this mix of legacy and modern protocols, and the maintenance data flow is designed to accommodate it. Modern SCADA platforms and historians are read directly over OPC UA, while legacy Modbus or OPC-DA devices are bridged into the same pipeline so every event lands in one consistent work-order stream. Protocol support determines which assets you can monitor, so the discovery audit in phase one catalogs every protocol before you commit to a subscription scope. The end result is a single maintenance feed regardless of how many control languages your plant speaks.
Q4How quickly does an alarm become an actual work order once the flow is live?
When the data flow is fully wired, an alarm above your configured severity threshold generates a prioritized CMMS work order in under sixty seconds from the moment it trips. That work order carries the asset ID, alarm type, the process values captured at the time of fault, the historical alarm frequency, and a recommended inspection procedure. Operators no longer transcribe alarm data into maintenance logs by hand, which removes both the delay and the transcription errors. The speed is what converts a 3 AM alarm into a scheduled repair rather than a missed early warning.
Q5How are alarm thresholds and priorities configured, and how do we avoid alarm flooding?
Each OPC UA tag mapped into OxMaint can have its own independent threshold rules, priority assignment, and asset linkage, all configured through the console without writing code. Incoming events are scored against alarm priority, equipment criticality, and alarm frequency in a rolling window, then routed to an immediate, next-shift, or scheduled-inspection tier. Suppression rules tuned during the first operational review sharply cut nuisance and duplicate alarms so technicians only see real faults.
Start a free trial to configure your first tag rules against your own asset list.
IoT Integration · Power Generation
Turn Stranded Plant Telemetry Into Maintenance Action
OxMaint reads your SCADA and historian over OPC UA, subscribes to the signals that predict failure, and generates prioritized work orders before equipment goes down. See it running against a sample power-generation environment.