Every power plant maintenance manager knows the monthly reporting scramble. Work order data is exported on Friday, cleaned in a spreadsheet, merged with downtime notes from shift logs and pasted into slides, and by the time leadership reads it, the numbers are days old. The reports are not hard because the KPIs are complicated. They are hard because the data lives in too many places. Power plant maintenance reporting software fixes that at the source: when every request, inspection and work order is captured in one system, reports build themselves. This guide shows which reports each audience needs, which work order fields feed each KPI and how to build a scorecard people actually read, using OXMAINT AI, the AI-powered CMMS for power plant maintenance teams.
Power Plant · Maintenance Reporting · Automated KPI Reports
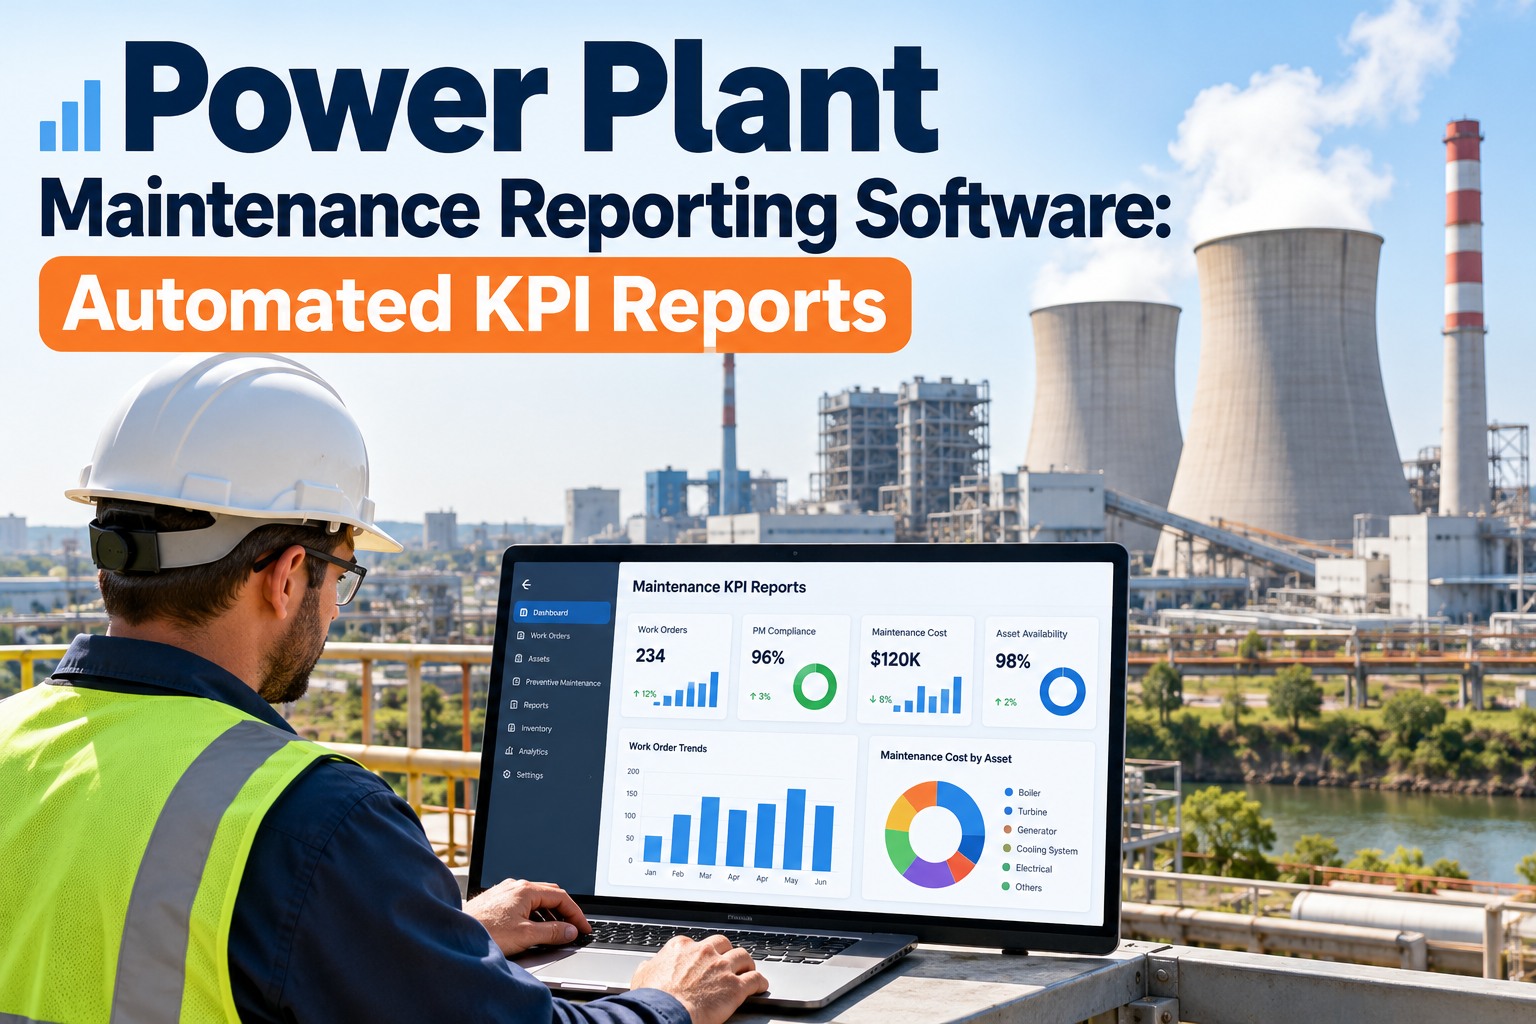
Power Plant Maintenance Reporting Software: Automated KPI Reports.
Manual reports are stale before they are sent, and nobody can say which numbers to trust. OXMAINT AI connects the workflow in one CMMS: requests and inspections raise issues, issues become work orders on the right asset, repairs are recorded as they happen, and the KPI reports and PM plans update from that same record.
1Request or Inspection
→
2Issue Logged
→
3Work Order
→
4Repair Recorded
→
5KPIs & PM Updated
Analytics & Reporting
Work Order Management
Preventive Maintenance
Predictive Maintenance
One Dataset, Five Audiences: Who Needs Which Report?
The same work order data should feed every report, but each audience needs a different slice, at a different pace. Matching the report to the reader is what keeps dashboards from becoming noise. Sign up free and see role-based views in OXMAINT AI.
EVERY SHIFT
Technicians & supervisors
What is open, what is urgent, what was handed over, and what changed overnight.
DAILY
Reliability meeting
New failures, critical backlog, today's PMs and assets that need a decision.
WEEKLY
Planners & schedulers
Crew loading, backlog ageing, parts readiness and next week's plan.
MONTHLY
Plant management
PM compliance, repeat failures, reactive versus planned work and cost trends.
QUARTERLY
Leadership & asset owners
Reliability direction, spend, major assets and capital planning inputs.
Garbage In, Garbage Out: Six Work Order Fields Behind Every KPI
A KPI is only as good as the field behind it. If technicians skip these fields, no software can rescue the report. Make them quick to fill in on a phone, and make them required where it matters. Book a demo to see mobile work order capture.
Work order field
Feeds this KPI
What goes wrong if blank
Asset ID
Everything by asset, MTBF, repeat failures
Costs and failures cannot be traced to the equipment
Work type
Planned vs reactive, PM compliance
Reactive work hides inside planned work
Failure code or cause
Failure patterns, bad actors
Repeat problems look like one-off events
Start and completion times
MTTR, backlog age, response time
Repair duration is guessed from memory
Labour and parts used
Maintenance cost, cost per asset
Cost reports miss real spend
Outage or downtime link
Availability impact, forced outage analysis
Reliability cannot be tied to maintenance activity
The KPI Set: Fewer Numbers, Clearly Defined
A dashboard with forty tiles is a dashboard nobody opens twice. These core measures cover most plant decisions. Agree on definitions with operations, and keep them stable so trends mean something. Your plant, market and regulator may use different reliability measures, so add those on top. Start free and set your KPI targets.
MTTR
Mean time to repair
Total repair time ÷ number of repairs
How fast problems get fixed once they start.
MTBF
Mean time between failures
Operating time ÷ number of failures
How long an asset runs between breakdowns.
PM Compliance
Preventive work done on time
PMs completed on time ÷ PMs scheduled
Whether the plan is actually being executed.
Planned Work %
Planned vs reactive effort
Planned hours ÷ total maintenance hours
How much of the week is firefighting.
Backlog
Open work waiting
Open work hours ÷ available crew hours
Whether the queue is stable, growing or ageing.
Maintenance Cost
Labour, parts and contractors
By asset, unit and period
Where spend goes and which assets cost most.
Stop Building Reports. Start Reading Them.
Let every closed work order update your KPIs automatically in OXMAINT AI, so your team spends meetings deciding, not collecting numbers.
What a Monthly Scorecard Can Look Like
A good scorecard uses red, amber and green so readers see the story in seconds, with the numbers one click away. Set thresholds per asset criticality, because a feedwater pump and a workshop fan should not share the same targets. Book a demo to see scorecard setup.
Illustrative Monthly Maintenance Scorecard
PM Compliance
On track
Scheduled PMs closing on time
Backlog
Ageing
Older jobs waiting on parts
Planned Work
Improving
Reactive share trending down
Repeat Failures
Action
Same fault on the same asset
Sample layout for illustration only. It is not real plant data.
A Reporting Week: Manual vs Automated
The biggest saving is not speed alone. It is that everyone looks at the same number at the same time. Sign up free and compare it with your current week.
Manual reporting
Automated in a CMMS
Collecting data
Export, copy and paste from several sources
Captured as work orders are raised and closed
Calculating KPIs
Formulas rebuilt each month, easy to break
Calculated from the same fields every time
Freshness
Days or weeks old when read
Live view, with scheduled summaries
Trust
Debate over whose spreadsheet is right
One system of record, drill down to the job
Distribution
Emailed PDF, then version confusion
Role-based views and scheduled email delivery
Five Dashboard Design Rules That Keep People Reading
Good reporting is a design problem as much as a data one. Book a demo to see how dashboards can be tailored by role.
1
Keep it to 8–12 measures. Start with the KPIs that drive decisions.
2
Use status colours. Red, amber and green show where to look first.
3
Let readers drill down. Every number should lead to the work orders behind it.
4
Show the trend, not just today. One bad week is noise, a pattern is a signal.
5
Tie each KPI to an owner. A number nobody owns does not improve.
How OXMAINT AI Supports Power Plant Maintenance Reporting
OXMAINT AI is a mobile-first CMMS, so the data behind your reports is captured where the work happens. It also offers a Power BI connection for teams that want their maintenance data in a wider reporting environment. Start free and add your first assets.
Live KPI Dashboards
View MTTR, MTBF, PM compliance and backlog calculated from closed work orders.
Role-Based Views
Show managers, planners and reliability engineers the measures that matter to them.
Scheduled Report Delivery
Send filtered KPI summaries to stakeholders by email on a weekly or monthly cadence.
Work Order Management
Capture requests, assignments, times, labour and parts on every job.
Preventive & Predictive
Plan PM from asset history and use AI-assisted alerts to surface developing issues.
Asset History & Cost
Review repairs, parts and cost per asset to find recurring bad actors.
A Four-Step Path to Automated Reports
You do not need a big-bang rollout. Start with the reports that hurt most and grow from there. Book a demo to plan your first reports.
1
Choose the reports
Pick the monthly report and daily meeting view that cost the most effort today.
→
2
Fix the fields
Standardise asset IDs, work types and failure codes behind those KPIs.
→
3
Set targets
Agree definitions, thresholds and owners with operations and reliability.
→
4
Automate & review
Schedule delivery, run the meeting from the dashboard and refine each month.
Frequently Asked Questions
What is power plant maintenance reporting software?
It is software, usually a CMMS, that captures maintenance activity such as work orders, PM, costs and downtime, and turns it into KPI dashboards and reports without manual compilation.
Sign up free and explore OXMAINT AI.
Which KPIs should a power plant track first?
Many plants start with PM compliance, MTTR, MTBF, planned versus reactive work, backlog and maintenance cost, then add plant-specific reliability measures.
Book a demo to build your KPI set.
Can reports be sent automatically to managers?
Can we use Power BI with our maintenance data?
OXMAINT AI offers a Power BI connection, so teams can combine CMMS data with other reporting. Your IT team should confirm access and data governance for your site.
Book a demo to discuss it.
Will automated reports help with audits and compliance?
Consistent work order, inspection and PM records make it easier to answer requests for evidence. Your plant still owns its compliance obligations, so confirm requirements with your own compliance team.
Sign up free and review your records.
Close the Work Order. The Report Updates Itself.
Bring requests, inspections, work orders, PM and KPI reporting together in OXMAINT AI, and give your plant one trusted set of numbers.