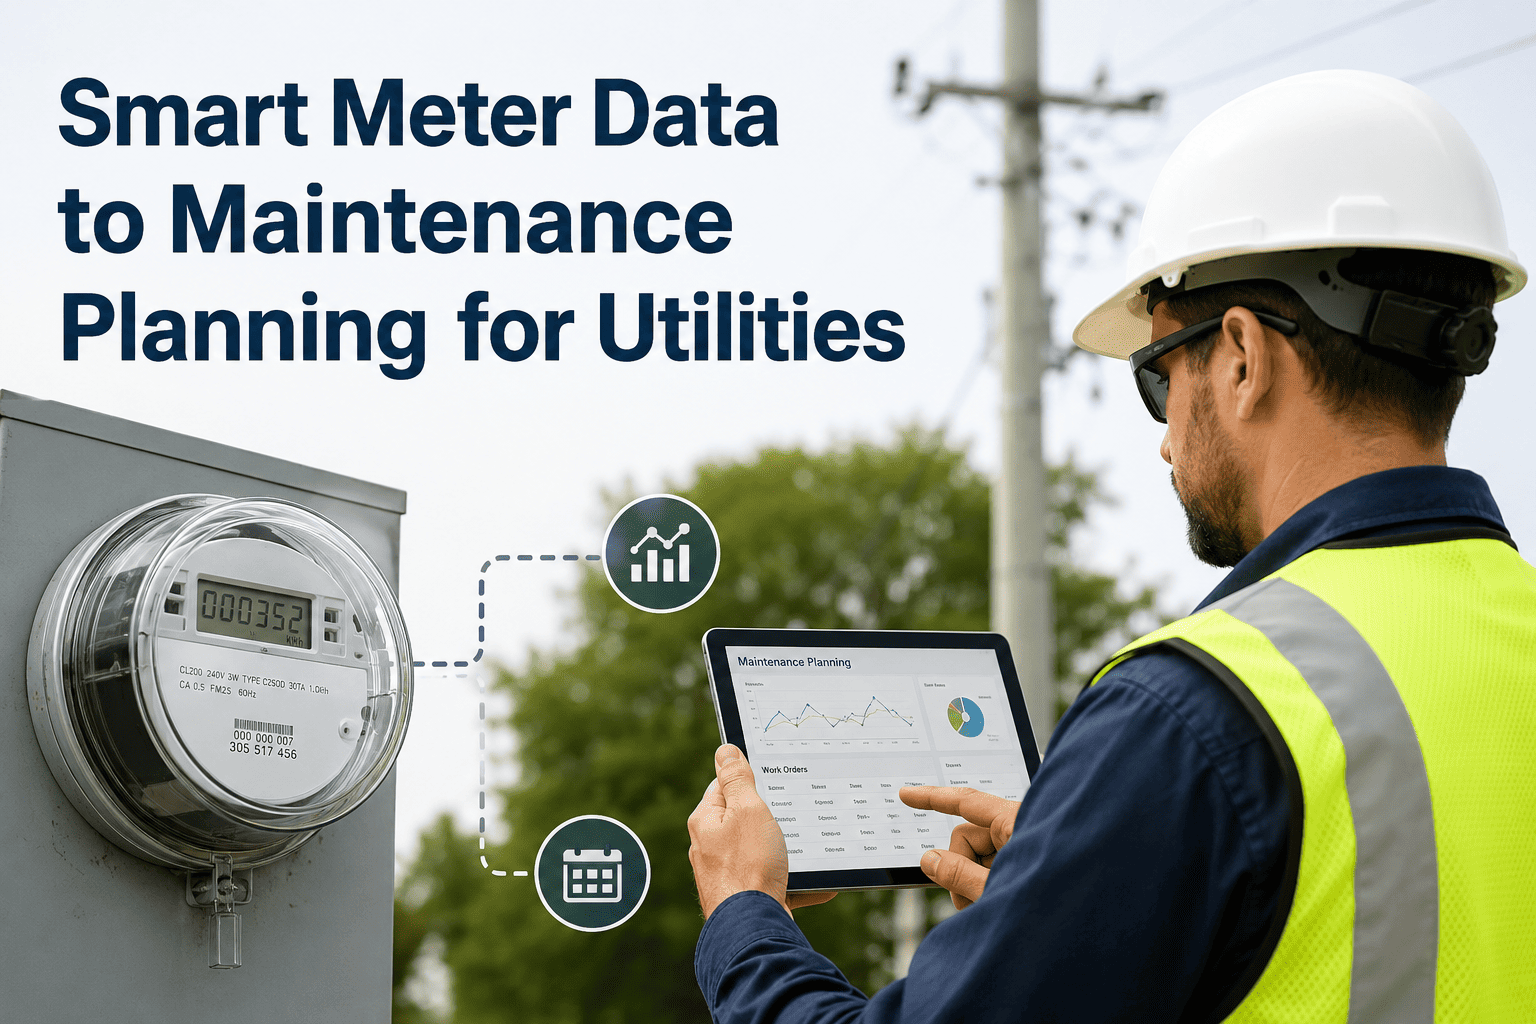
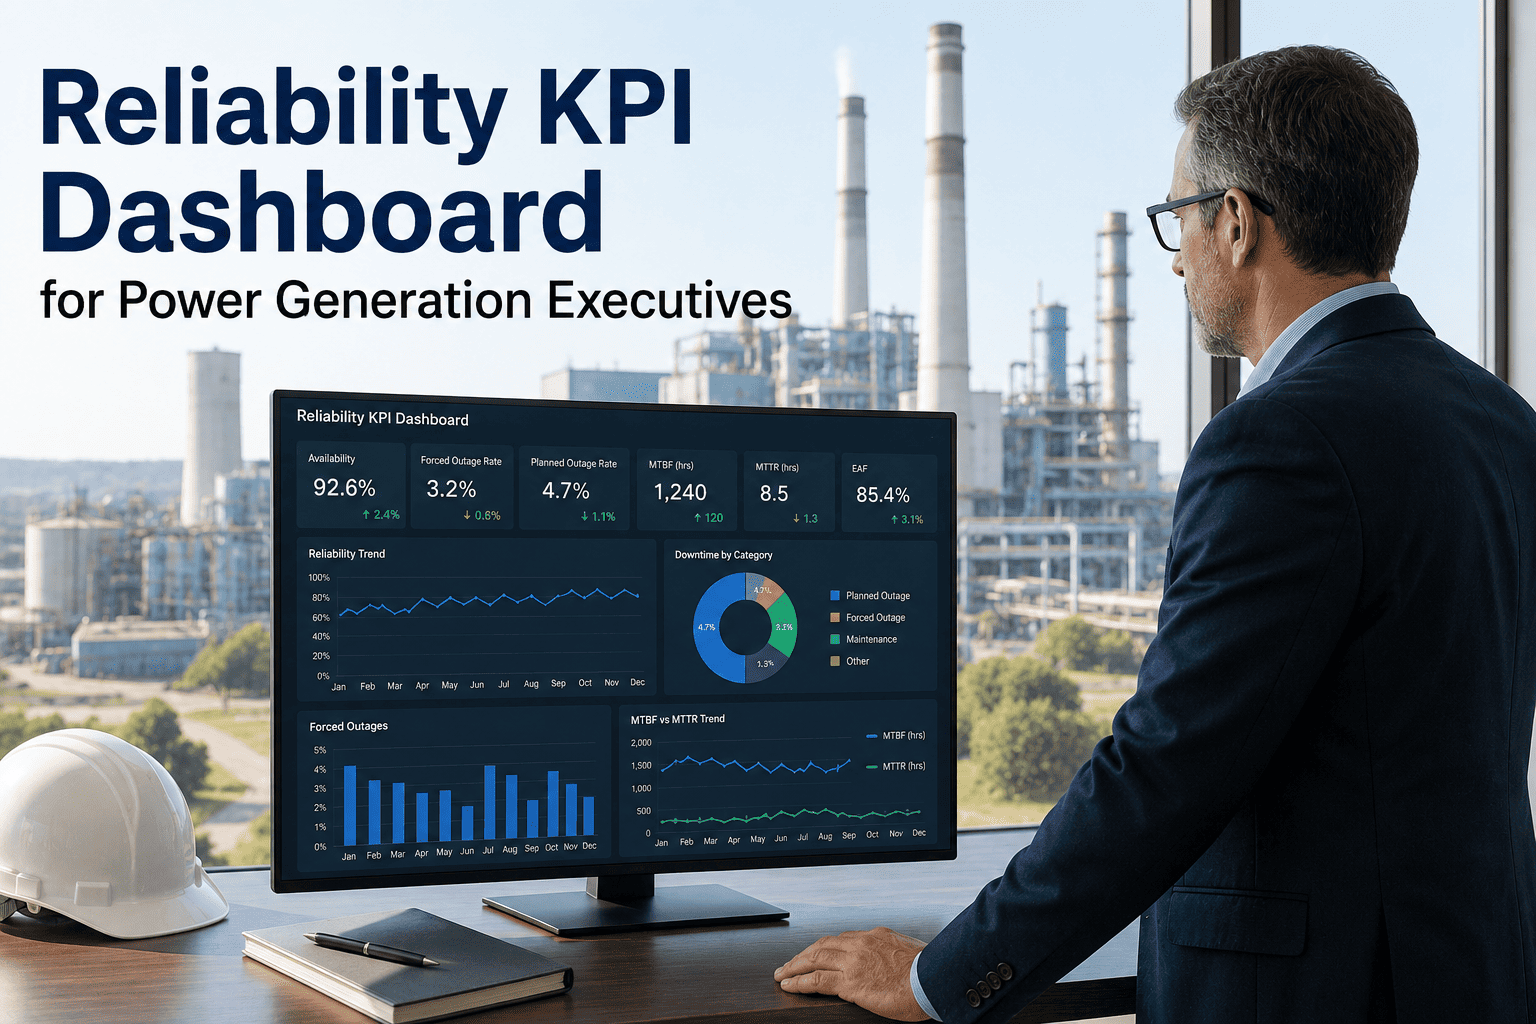
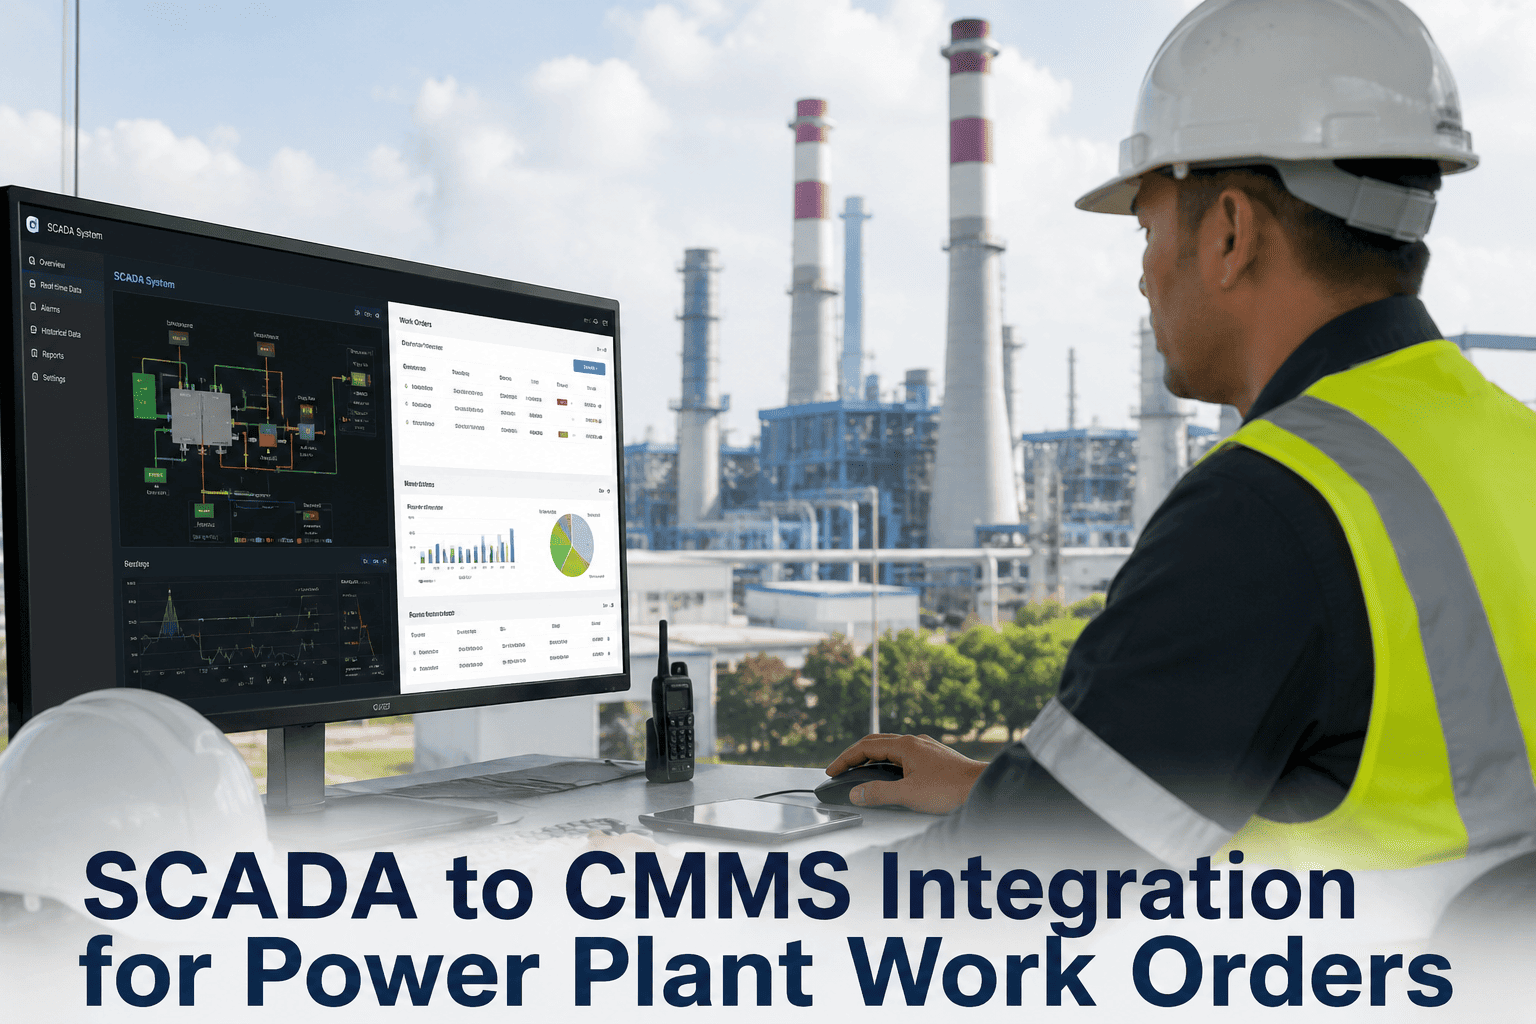
A distribution utility runs thousands of transformers, feeders, and switches that operate for years with almost no direct telemetry — most of the grid is a blind spot until something trips. Yet at the grid's last mile sits a sensor the utility already owns by the million: the smart meter. Every meter continuously records voltage, load, power quality, and outage events that, read correctly, reveal which transformer is overheating, which feeder is overloaded, and which phase is failing — weeks before a customer ever calls. The problem is that this data usually dies inside the AMI head-end, never reaching the maintenance team. This article shows how smart meter data becomes a maintenance plan, and how OxMaint turns meter anomalies into prioritized work orders.
11.28%
Projected CAGR of the global AMI market through 2032 — meter data volume is exploding faster than utilities can act on it
5.5%
Average reduction in outage length after smart meter deployment, per an MIT Sloan study — faster detection, faster crew dispatch
1000s
Unmonitored transformers, switches, and line segments per network that meter data can illuminate without new field sensors
IoT Integration · Utility Data
Your Meters Already See the Failure. Make Them Schedule the Repair.
OxMaint ingests smart meter and AMI data, decodes the anomalies that predict asset failure, and generates classified work orders automatically — turning passive consumption readings into an active maintenance plan.
From Billing Meter to Maintenance Sensor
For decades, the meter had one job: measure kilowatt-hours for the bill. Advanced Metering Infrastructure changed that. A modern smart meter is a continuous grid sensor that records voltage profiles, load, power quality, and outage events, then communicates them back over a two-way network. The same readings that calculate a customer's bill also describe the health of the transformer feeding that customer, the balance of the phase serving that street, and the stress on the feeder running that neighborhood. The shift is from measuring consumption to diagnosing infrastructure. The catch is that meter data lands in a vendor-specific AMI head-end and a Meter Data Management system, formatted for billing — not for maintenance. Bridging that last gap, from meter reading to maintenance action, is where reliability gains are won or lost.
Decoding the Signals: What Each Meter Anomaly Reveals
The value of meter data is in the anomalies, not the averages. Each type of irregularity is a fingerprint pointing at a specific developing fault on a specific asset. A maintenance plan built on meter data starts by translating these electrical signatures into asset-level diagnoses. The decoder below maps the most actionable smart meter signals to the failure each one warns about and the maintenance response it should trigger.
Sustained Voltage Sag
predicts
Overloaded or undersized transformer feeding the segment; repeated RMS voltage drops are a classic failing-transformer signature
Trigger: thermal inspection and load-balancing review on the suspect transformer
Phase Imbalance
predicts
Uneven loading driving excess current in one phase — accelerates winding insulation breakdown and risks open-phase conditions
Trigger: phase reconfiguration work order and connection inspection
Last-Gasp / Outage Event
predicts
Loss of supply at the grid edge; clustered last-gasp signals pinpoint the failed transformer or feeder segment in real time
Trigger: immediate crew dispatch with the fault already mapped to the asset
Harmonic Distortion
predicts
Increased eddy-current losses and heating in transformers and conductors from non-linear loads such as EV chargers and VFDs
Trigger: harmonic study and filter or capacitor-bank sizing task
Low Power Factor
predicts
Reduced system capacity and utility penalties; sustained low power factor stresses distribution equipment
Trigger: capacitor-bank switching review and corrective scheduling
Reverse Power Flow
predicts
Rooftop-solar backfeed outside expected hours stressing assets rated for one-way flow, or meter tampering and theft
Trigger: feeder capacity assessment and field-verification work order
Built for Distribution Utilities
Stop Reading Meter Data. Start Acting on It.
OxMaint connects to your AMI head-end and SCADA, applies anomaly rules to voltage, load, and power-quality streams, and generates a classified maintenance work order the moment an asset crosses your risk threshold — no manual data mining required.
The Data Journey: Meter to Work Order in Five Hops
Smart meter data does not jump straight from the field to a technician's task list. It travels a defined path, and reliability depends on the data surviving every hop with its context intact. The journey below traces a single anomaly from the meter at a customer's premises to a scheduled repair, showing where OxMaint plugs in to close the historic gap between metering and maintenance.
1
Smart Meter
At the grid edge, the meter records interval voltage, load, and power-quality data and detects events like voltage sags and last-gasp signals in near real time.
2
AMI Head-End & MDM
Two-way communication carries readings to the head-end, where the Meter Data Management system stores them — historically the point where the data stops, formatted for billing.
3
OxMaint Ingestion & Correlation
OxMaint pulls meter and AMI data via API and correlates it with GIS topology and SCADA telemetry, linking each anomaly to the transformer, feeder, or phase it actually affects.
4
Risk Scoring & Rules
Anomalies are scored against thermal-loading models and configurable thresholds. Assets crossing a risk level are flagged and ranked so attention goes to the highest-stress equipment first.
5
Prioritized Work Order
A classified work order is generated with the asset, the triggering meter data, and a recommended action — assigned to a crew and scheduled into a planned window, not an emergency.
Why Meter-Driven Planning Beats the Calendar
Calendar-based maintenance inspects every transformer on the same schedule regardless of what the data says — and the units that fail are often the ones just inspected, because the failure developed in the months after. Meter-driven planning replaces the calendar with evidence. The comparison below shows the operational shift, framed around the reliability metrics utilities are measured on.
| Planning Dimension | Calendar-Based Maintenance | Smart Meter-Driven Planning |
| Trigger for work |
A date on the schedule |
An actual anomaly in voltage, load, or power quality |
| Failure visibility |
None between inspections; faults develop unseen |
Continuous; degradation tracked as it progresses |
| Outage detection |
Customer phone calls |
Last-gasp signals mapped to the asset in real time |
| Crew dispatch |
Broad area, fault located on arrival |
Targeted, fault pre-located before the truck rolls |
| Resource use |
Healthy assets inspected on schedule, life wasted |
Effort concentrated on genuinely stressed assets |
| Reliability impact |
SAIDI / SAIFI driven by surprises |
SAIDI / SAIFI improved by faster, fewer outages |
Where Meter Data Pays Off First
Not every asset benefits equally from meter intelligence. The fastest returns come from the unmonitored grid-edge equipment that causes the most service interruptions yet rarely carries dedicated sensors. Pointing meter-driven planning at these three asset classes captures the bulk of the reliability gain.
01
Distribution Transformers
The last-mile workhorse, usually with no direct telemetry. Meter voltage and load data exposes overloading, insulation stress, and overheating against IEC 60076 thermal models — flagging units for inspection or replacement before they fail in service.
02
Feeders & Line Segments
EV-charging clusters, rooftop solar, and demand growth push feeders past their original ratings. Aggregated meter load profiles reveal which segments run in the "highly stressed" category, prioritizing reconductoring and capacity upgrades.
03
Phase & Connection Integrity
Phase imbalance and open-phase conditions can persist undetected and quietly damage equipment. Meter data verifies meter-to-phase relationships and surfaces imbalance early, enabling preventive reconfiguration before insulation gives way.
"Our transformer program used to be purely calendar-driven — we inspected every unit on the same cycle no matter what the data showed, and the ones that failed were always the ones we had just checked. Once meter data started flowing into our maintenance system, we caught an at-risk transformer four weeks before it would have failed, scheduled a planned outage, and replaced the insulation. That single intervention paid for the whole effort."
— Distribution Reliability Manager, Regional Electric Utility
Frequently Asked Questions
Q1Do we need to install new sensors, or can OxMaint use the meter data we already collect?
No new field sensors are required. OxMaint's integration layer is additive — it connects to the smart meter network, AMI head-end, SCADA, and DCS you have already deployed and applies analytics on top of that existing data. The whole point of meter-driven planning is to extract reliability value from infrastructure you already own, illuminating the thousands of grid-edge assets that have no dedicated telemetry. You start seeing risk flags from your current data rather than waiting on a hardware rollout.
Book a demo to see it run against sample AMI data.
Q2How does meter data get linked to the specific transformer or feeder that is failing?
OxMaint correlates meter anomalies with your GIS topology model and SCADA telemetry so each electrical signature is tied to the physical asset it affects. A cluster of voltage sags or last-gasp signals is mapped to the shared transformer or feeder segment feeding those meters, turning a scattered set of readings into a single asset-level diagnosis. Because AMI 2.0 systems continuously refine meter-to-transformer and meter-to-phase relationships, that mapping keeps improving over time. The result is a work order that names the asset, not just the symptom.
Q3What kinds of failures can smart meter data actually predict ahead of time?
Meter data is strongest at catching the slow-developing failures that dominate distribution outages. Sustained voltage sags point to overloaded or weakening transformers, phase imbalance warns of winding insulation stress, harmonic distortion signals overheating from non-linear loads, and reverse power flow reveals solar backfeed straining one-way-rated equipment. Each of these progresses over days or weeks, which is exactly the window meter-driven planning exploits. Catching them early lets you schedule the repair into a planned outage instead of responding to a failure.
Q4How quickly does an anomaly become an actionable work order?
Once the data flow is configured, an asset crossing your risk threshold automatically generates a classified, prioritized maintenance work order in OxMaint — no analyst has to notice it first. The work order carries the asset reference, the meter data that triggered it, and a recommended action, then routes to the right crew. For outage events specifically, clustered last-gasp signals enable crew dispatch with the fault already located, which is what drives the documented reduction in outage length. Speed here is the difference between a planned repair and an emergency.
Q5How does meter-driven maintenance improve our SAIDI and SAIFI scores?
Both reliability indices are driven by how often outages happen and how long they last. Meter-driven planning attacks both: predicting transformer and feeder failures lets you prevent outages before they occur, and real-time last-gasp detection shortens the ones that still happen by speeding confirmation, location, and restoration verification. Studies have associated smart meter deployment with measurably shorter outages, and concentrating maintenance on genuinely stressed assets reduces surprise failures.
Start a free trial to model the impact against your own asset list.
IoT Integration · Utility Data
Turn Millions of Meter Readings Into One Clear Maintenance Plan
OxMaint ingests your AMI and SCADA data, decodes the anomalies that predict failure, and schedules the repair before the grid goes down. See it running against a sample utility environment.