A blast furnace campaign can run for fifteen years or more, and the refractory lining protecting the shell is the single factor that determines whether that campaign ends on schedule or ends early with an emergency shutdown. Thinning brickwork near the tuyeres, hot spots on the shell, and cooling stave failures rarely announce themselves — they show up first as small shifts in thermal and cooling water data that condition monitoring software can track zone by zone, long before a breakout risk forces production to stop.
Refractory wear is invisible until it isn't — unless you're tracking every zone
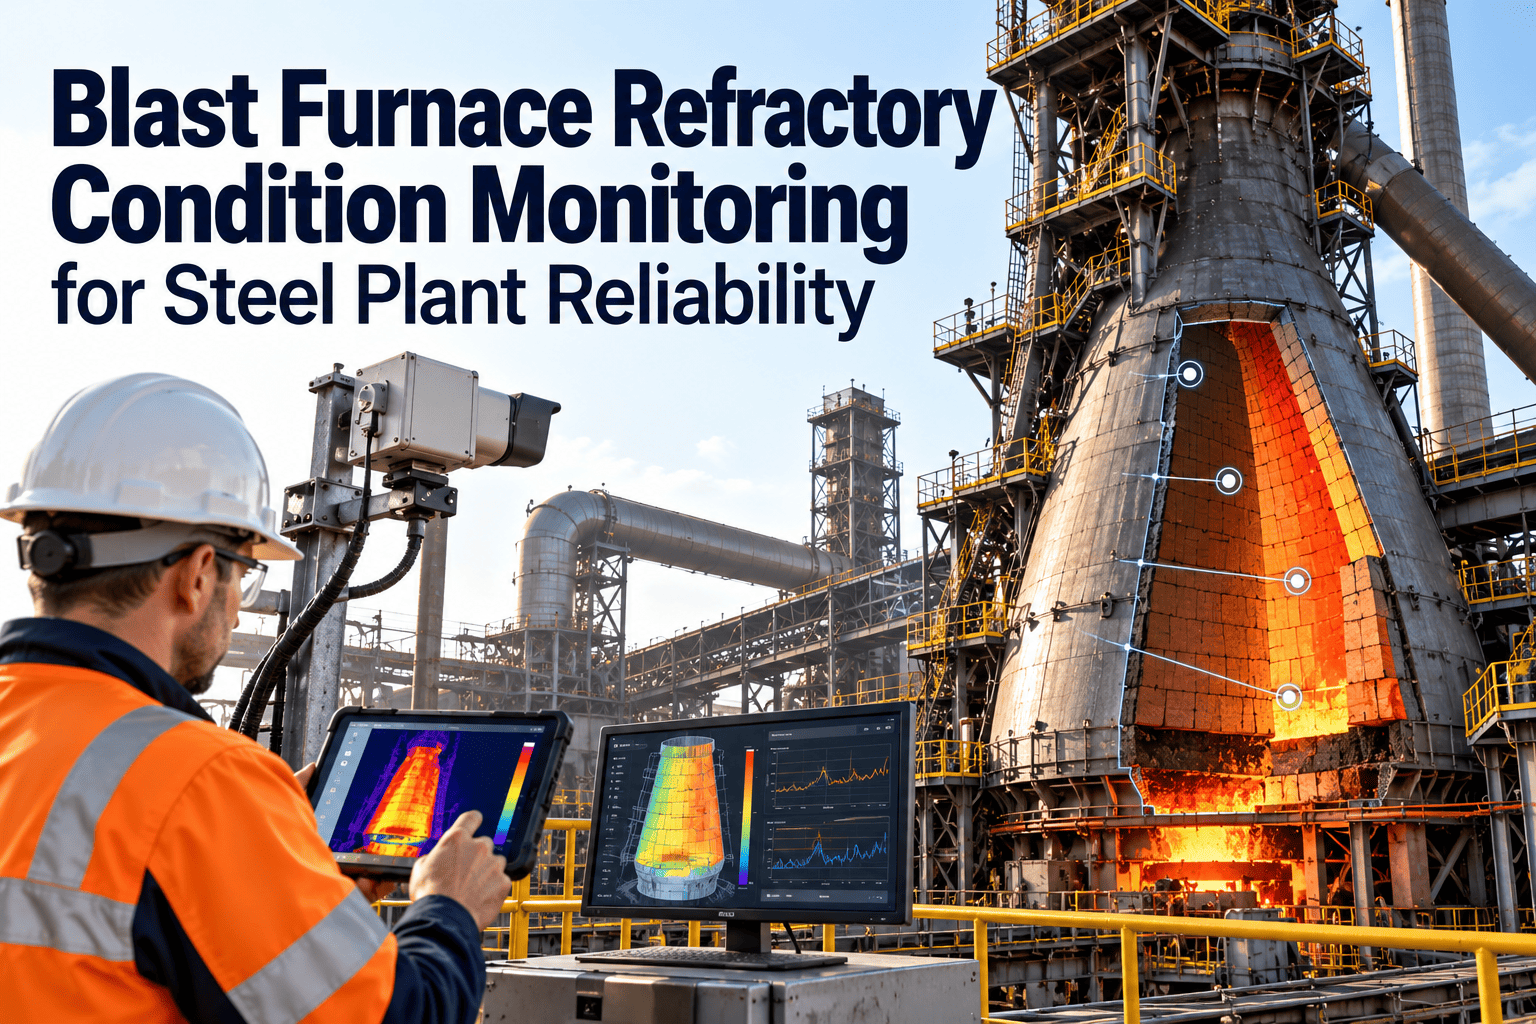
Shell thermal imaging, cooling stave flow and temperature data, and inspection history combine into a zone-by-zone refractory health trend, giving reliability teams the lead time to plan a reline instead of reacting to a breakout risk.
The slow, quiet way a blast furnace campaign ends early
Refractory degradation is gradual by nature — brick erosion, cooling stave wear, and hot metal penetration accumulate over years. The danger is that this slow process can accelerate quickly in a localized zone without a corresponding change in bulk process data.
How zone-based refractory monitoring actually works
Refractory condition monitoring layers three data sources on top of each other to build a defensible picture of remaining lining thickness at every elevation of the furnace shell.
Shell thermal imaging
Fixed or scanning infrared sensors map shell surface temperature across the full circumference, flagging localized hot spots that indicate thinning refractory beneath the shell plate.
Cooling stave data
Inlet and outlet temperature differentials, plus flow rate on each cooling circuit, reveal scaling, blockage, or crack-driven water loss in individual staves before they fail outright.
Inspection history overlay
Periodic ultrasonic thickness readings and shutdown inspection findings are logged against the same zone map, calibrating the thermal model against physical measurements over time.
Zone-based health score
Combining these three inputs produces a rolling health score per zone in the CMMS, so reliability engineers can see which section of the furnace is degrading fastest.
From thermal drift to a scheduled reline decision
Because refractory failure carries safety and breakout risk, thresholds are typically set more conservatively than on other rotating equipment, with earlier watch-tier flags to allow time for planning.
| Signal | Baseline | Watch | Warn (Inspect) | Critical (Isolate) |
|---|---|---|---|---|
| Shell surface temp | <180 C | 200 C localized | 230 C localized | >260 C or rapid rise |
| Stave outlet delta-T | <8 C | 12 C sustained | 16 C sustained | >22 C or flow loss |
| Cooling water flow | Rated ± 5% | -10% for 2 hr | -20% for 1 hr | -35% or circuit loss |
What changes when refractory monitoring moves from inspection-only to continuous
Traditional refractory management relies heavily on scheduled inspections during planned outages. Continuous monitoring does not replace those inspections, but it closes the visibility gap between them.
- Refractory thickness known only at scheduled shutdown windows
- Hot spots discovered visually or by handheld thermal camera sweep
- Stave failures often found only after water loss triggers an alarm
- Reline timing based on campaign age estimates
- Zone health tracked continuously between shutdowns
- Hot spots flagged automatically as they emerge, with location data
- Stave scaling and cracking trends detected before failure
- Reline planning based on measured wear, not just calendar age
See refractory wear coming, zone by zone, before it becomes a shutdown
Bring shell thermal data, cooling stave readings, and inspection history into one condition-based view of your furnace campaign.
Blast furnace refractory monitoring, answered
How is refractory thickness estimated without shutting the furnace down?
Shell surface temperature is combined with known steel and refractory thermal conductivity to infer remaining lining thickness at each monitored zone, calibrated against periodic ultrasonic readings.
Can cooling stave failures really be predicted in advance?
Yes, scaling and early crack propagation typically show up as a widening temperature differential or gradual flow decline on that stave's circuit well before a full failure occurs.
Does this replace scheduled ultrasonic thickness inspections?
No. Continuous monitoring extends visibility between inspections and helps prioritize where the next ultrasonic survey should focus, rather than replacing that physical measurement.
How does this data get into our CMMS?
Thermal imaging and stave sensor data stream into the asset record for each furnace zone, and threshold breaches generate inspection or corrective work orders automatically. Book a demo to see a zone map in action.
What is the value of extending refractory monitoring across a full campaign?
Continuous zone tracking helps operators plan reline timing around measured wear instead of conservative calendar estimates, often extending safe campaign length while managing breakout risk more precisely.
Know which zone of your furnace needs attention before the next inspection window
Turn shell thermal data, cooling stave readings, and inspection records into one continuous refractory health score.