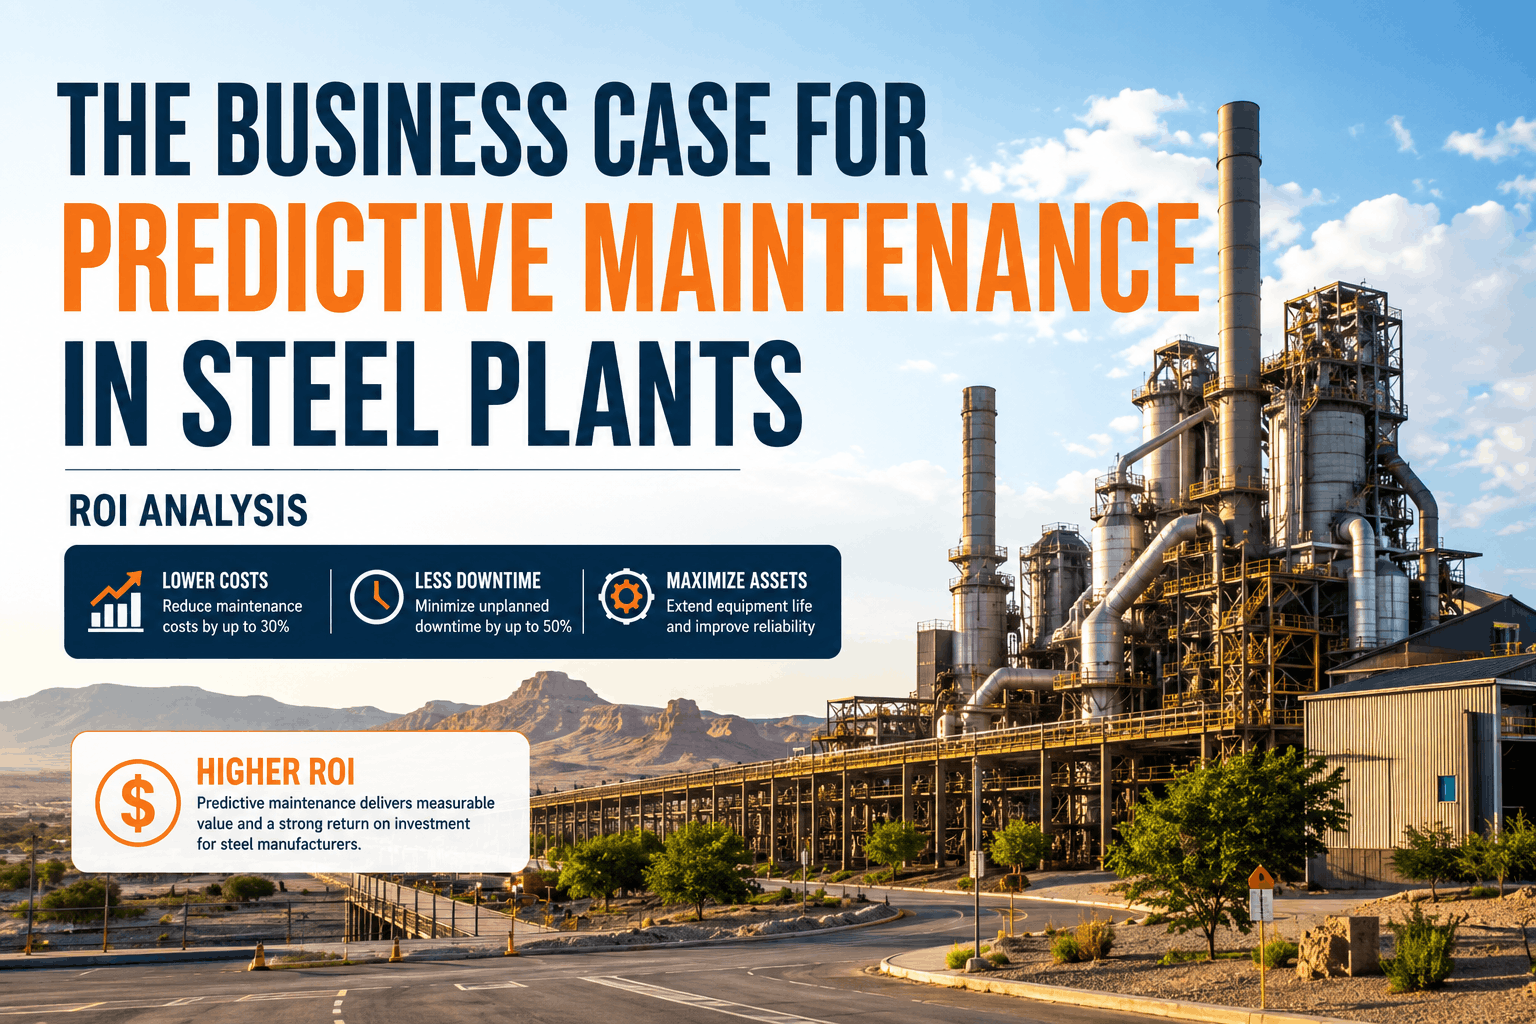
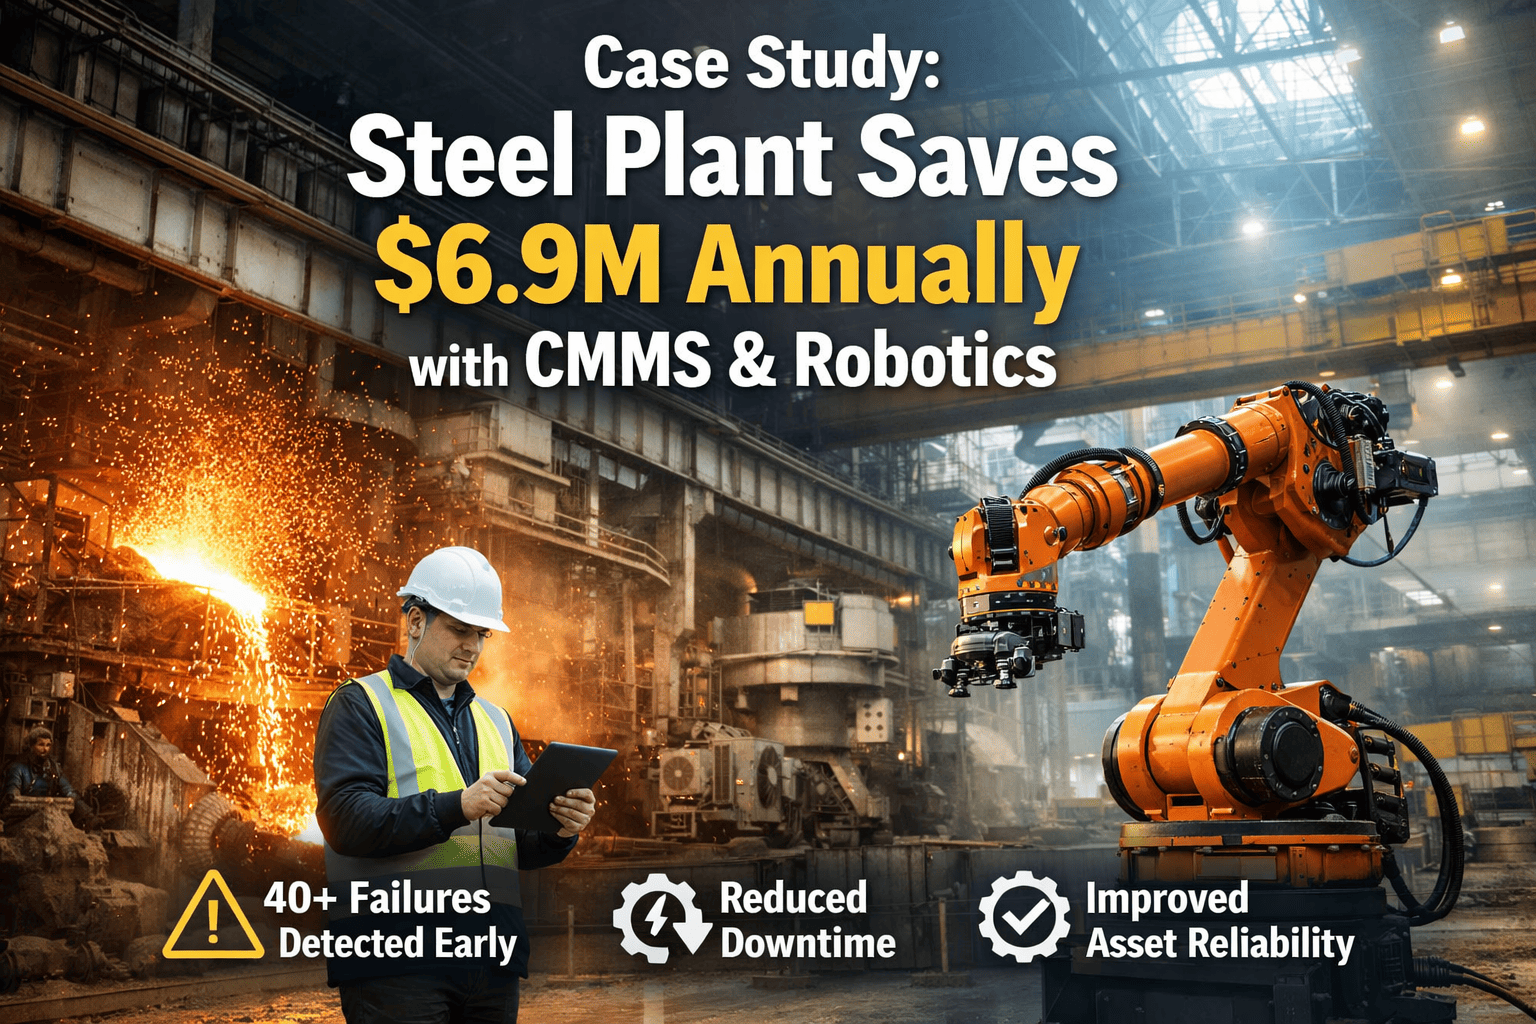
A steel plant maintenance manager reviews last quarter's numbers — $2.3 million in unplanned downtime from a single rolling mill bearing failure that cascaded into 72 hours of lost production. The work order history lives in spreadsheets, the parts inventory in someone's memory, and the PM schedule on a whiteboard that hasn't been updated since the last shutdown. Can your team prove that every maintenance dollar spent is returning measurable value? If your answer requires pulling data from six disconnected systems, you're facing a problem that erodes margins with every unplanned stop. Steel operations with structured CMMS programs reduce unplanned downtime by 35–45%, cut maintenance costs per ton by 12–18%, and achieve spare parts inventory reductions of 15–25% within the first 18 months. A mid-capacity integrated steel mill running 1.8 million tons per year deployed Oxmaint CMMS across blast furnace, melt shop, rolling mill, and utilities — linking every asset to predictive maintenance triggers, spare parts consumption, and cost-per-ton tracking. This guide walks through the complete ROI framework for maintenance software in steel manufacturing and shows exactly how to build the business case your leadership team needs.
3–5%
Revenue Lost to Downtime
Average percentage of annual revenue lost to unplanned equipment failures in steel plants without predictive maintenance programs
$180/ton
Maintenance Cost Benchmark
Average maintenance cost per ton of crude steel in plants relying on reactive maintenance — 40–60% above best-in-class performers
62%
Reactive Work Orders
Proportion of maintenance work that is unplanned or emergency in steel plants without CMMS — driving overtime, expedited parts, and cascading failures
Maintenance teams ready to
Sign Up connect every asset to structured work orders, failure tracking, and cost-per-ton analysis — transforming maintenance from a cost center into a measurable production enabler.
Why ROI Calculation Matters for Steel Maintenance Software
Steel manufacturing operates on thin margins where every dollar of unnecessary maintenance spend directly compresses profitability. A blast furnace relining costs $20–$40 million. A rolling mill motor failure stops $50,000–$150,000 of production per hour. Spare parts warehouses hold $5–$15 million in inventory that may or may not match actual consumption patterns. In this environment, maintenance software isn't an IT project — it's an operational investment that must demonstrate measurable returns against specific production and cost metrics. The ROI framework begins when operations teams implement Sign Up for Oxmaint and connect every piece of critical equipment to structured maintenance workflows, failure analytics, and cost tracking that produces board-ready financial evidence.
5
Regulatory & Safety Compliance Value
Documented PM execution, inspection histories, and audit trails eliminate compliance gaps. OSHA recordable reductions, EPA audit readiness, and insurance premium credits contribute measurable cost avoidance.
Typical Return: $200K–$800K/year in avoided fines, reduced insurance premiums, and eliminated audit remediation costs
4
Spare Parts & Inventory Optimization
CMMS-driven consumption tracking identifies overstocked items, eliminates dead stock, and triggers reorder points based on actual usage — not guesswork. Min/max levels set by failure frequency and lead time data.
Typical Return: 15–25% inventory carrying cost reduction, 30–50% fewer stockouts on critical spares
3
Labor Productivity & Wrench Time
Structured work orders with parts kitting, task instructions, and location data increase wrench time from the steel industry average of 28% to 45–55%. Fewer technicians accomplish more planned work per shift.
Typical Return: 20–35% increase in work order completion rate without adding headcount
2
Maintenance Cost Per Ton Reduction
Shifting from reactive to planned maintenance reduces emergency overtime, expedited shipping, and secondary damage costs. Every 10% shift from reactive to planned work yields 3–5% total maintenance cost reduction.
Typical Return: 12–18% reduction in maintenance cost per ton within 18 months of full CMMS deployment
1
Unplanned Downtime Reduction
The largest single ROI driver. Structured PM schedules, failure pattern analysis, and condition-based triggers catch degradation before catastrophic failure. Each avoided hour of unplanned downtime recovers $50K–$150K in lost production.
Typical Return: 35–45% reduction in unplanned downtime hours within first 12–18 months
Critical Integration Point: Oxmaint connects all five ROI pillars into a single reporting structure — so maintenance leaders can present total ROI across downtime, cost-per-ton, labor, inventory, and compliance in unified board-ready dashboards.
ROI by Steel Production Area: Where Returns Are Highest
Not all equipment delivers equal maintenance ROI. The business case is strongest where failure consequences are highest — continuous process areas where a single unplanned stop cascades across the entire production chain. Prioritizing CMMS deployment to these areas first accelerates payback and builds internal credibility for plant-wide rollout. Maintenance leaders evaluating deployment strategy can Book a Demo to model ROI projections specific to their production configuration.
Most steel operations achieve fastest payback by deploying CMMS first to blast furnace/DRI and hot rolling mill — the two areas combining highest downtime cost with the most rotating and wear-critical equipment. All production areas feed into the same Oxmaint asset structure through
Sign Up.
Calculate Your Steel Plant's Maintenance ROI
Oxmaint connects every production asset to structured work orders, failure analytics, spare parts tracking, and cost-per-ton dashboards — giving your leadership team the financial evidence to approve maintenance technology investment.
Building the Business Case: Key ROI Metrics
A compelling business case requires translating maintenance improvements into financial metrics that plant leadership and corporate finance teams understand. Abstract promises of "better maintenance" don't secure budgets. Specific projections tied to current baseline costs, with conservative assumptions and clear measurement methodology, build credibility and secure approval. The following metrics form the core of every successful steel maintenance software business case.
Overall Equipment Effectiveness (OEE)
Tracks availability × performance × quality across critical production lines. CMMS-driven PM compliance directly improves the availability component. A 5-point OEE improvement on a hot strip mill producing 3 million tons/year represents $8–$15 million in recovered throughput.
Target Improvement: 3–8 percentage points within 12–18 months of structured PM implementation
Mean Time Between Failures (MTBF)
Measures average operating time between unplanned equipment stops. CMMS failure coding and root cause tracking identify repeat failure patterns. Extending MTBF by even 10% on critical assets cascades into significant downtime reduction across the production chain.
Target Improvement: 15–30% MTBF increase on critical rotating equipment within first year
Planned vs. Reactive Work Ratio
The single most predictive metric of maintenance program maturity. World-class steel operations target 85%+ planned work. Every 10% shift from reactive to planned reduces total maintenance cost by 3–5% through eliminated overtime, reduced secondary damage, and optimized parts usage.
Target Improvement: Move from 40% planned to 70%+ planned within 18 months
Maintenance Cost Per Ton
Total maintenance spend divided by production tonnage — the universal benchmark metric for steel maintenance efficiency. Includes labor, materials, contracts, and overhead. Directly comparable across plants and against industry benchmarks published by WSD and AIST.
Target Improvement: 12–18% reduction from baseline within 18 months of full deployment
Spare Parts Inventory Turns
CMMS consumption data replaces gut-feel ordering with data-driven min/max levels. Dead stock identification frees warehouse capital. Critical spares stockout elimination prevents the $50K emergency air freight shipments that destroy maintenance budgets.
Target Improvement: Increase inventory turns from 1.2 to 2.0+ while reducing stockouts by 30–50%
PM Compliance Rate
Percentage of scheduled preventive maintenance tasks completed on time. Automated CMMS scheduling, mobile work order execution, and overdue escalation workflows push compliance from the typical 55–65% to 90%+ — the threshold where PM programs actually reduce failures.
Target Improvement: From 55–65% to 90%+ PM on-time completion rate
Implementation Timeline: Phased Deployment for Maximum ROI
The deployment approach determines how quickly ROI materializes. Steel plants that try to implement CMMS across all production areas simultaneously face data quality problems, change resistance, and delayed value realization. Phased deployment focused on highest-impact areas first delivers measurable returns within months — building internal champions and financial evidence for plant-wide expansion. The critical factor is ensuring that all data flows into a single platform so cross-area analysis is available from day one.
Pilot (Single Area)
Best for: Proving ROI to skeptical leadership
Timeline: 8–12 weeks to first results
Advantages
- Lowest risk — contained scope, focused training
- Produces measurable ROI data within one quarter
- Builds internal champions among pilot area crews
- Identifies integration challenges before plant-wide rollout
Considerations
- Limited ROI scope — doesn't capture cross-area benefits
- Pilot area may not represent plant-wide complexity
- Risk of pilot fatigue if expansion is delayed
- Spare parts integration limited to one area's inventory
Recommended
Phased Rollout
Best for: Mid-size to large steel operations
Timeline: 6–14 months for full deployment
Advantages
- Start with highest-ROI areas (rolling mill, blast furnace)
- Each phase builds on lessons from previous deployment
- Financial returns fund subsequent phase expansion
- Change management scales gradually across workforce
Considerations
- Requires clear phase gates and expansion criteria
- Temporary dual-system operation during transition
- Cross-area reporting incomplete until later phases
- Sustained leadership sponsorship required across phases
Plant-Wide Launch
Best for: Greenfield or committed digital transformation
Timeline: 4–8 months intensive deployment
Advantages
- Full cross-area visibility from day one
- Complete spare parts integration immediately
- No dual-system complexity or transition period
- Maximum ROI capture in shortest total timeline
Considerations
- Highest change management burden — all crews at once
- Requires dedicated implementation team (3–5 FTEs)
- Data quality issues across all areas simultaneously
- Larger upfront investment before ROI evidence exists
Most steel operations begin with a phased rollout: deploy to rolling mill and melt shop first (highest downtime cost), expand to blast furnace / DRI and caster in phase two, then utilities and auxiliaries in phase three. All data — regardless of deployment phase — feeds into the same Oxmaint asset structure for unified cost-per-ton reporting.
The Financial Model: Calculating Your Plant's Specific ROI
Every steel plant has different production volumes, equipment age profiles, and current maintenance cost baselines. The ROI model below provides the framework for calculating your plant-specific business case using your actual numbers. Conservative assumptions — using the low end of documented improvement ranges — ensure the business case survives finance team scrutiny. This is where maintenance investment transitions from a cost request to a financial opportunity that production leadership and CFOs can evaluate on equal footing with other capital projects.
1
Baseline Current Costs
Document total maintenance spend, unplanned downtime hours, spare parts inventory value, and cost per ton for trailing 12 months
→
2
Quantify Failure Impact
Calculate lost production value per unplanned hour by area, emergency overtime costs, and expedited parts spending
→
3
Apply Improvement Ranges
Use conservative (low-end) documented improvement percentages for downtime reduction, cost-per-ton savings, and inventory optimization
→
4
Net Against CMMS Costs
Subtract total CMMS implementation, licensing, training, and ongoing support costs from projected annual savings
→
5
Project 3-Year ROI
Model cumulative returns over 36 months showing payback period, NPV, and IRR for comparison against other capital investment options
Example Scenario 1: Integrated Steel Mill — 1.5 Million Tons/Year
An integrated mill with blast furnace, BOF, slab caster, and hot strip mill deployed Oxmaint CMMS in a phased rollout over 10 months. Pre-deployment baseline: $180/ton maintenance cost, 4.2% unplanned downtime, 58% reactive work orders, $8.2M spare parts inventory. After 18 months: maintenance cost dropped to $152/ton (15.6% reduction = $42M annual savings on 1.5M tons), unplanned downtime fell to 2.4% (recovered 27,000+ production hours), planned work ratio reached 74%, and spare parts inventory reduced to $6.5M with fewer stockouts. Total CMMS investment including implementation: $380K year one, $95K/year ongoing. Three-year ROI: 14,200%. Payback period: 4.8 weeks.
Example Scenario 2: EAF Mini-Mill — 600,000 Tons/Year
A two-EAF mini-mill with billet caster and bar rolling mill deployed Oxmaint across all production areas simultaneously over 14 weeks. Pre-deployment baseline: $135/ton maintenance cost, 3.8% unplanned downtime, 64% reactive work. After 12 months: maintenance cost dropped to $118/ton (12.6% reduction = $10.2M annual savings), unplanned downtime fell to 2.6% (recovered 10,500+ production hours), electrode consumption optimized through failure tracking, and safety incident rate fell 28% through documented lockout/tagout compliance. Total CMMS investment: $180K year one, $60K/year ongoing. Three-year ROI: 8,600%. Payback period: 6.2 weeks.
Your Steel Plant's ROI Is Waiting to Be Calculated
Connect every furnace, caster, mill, and utility asset to structured maintenance workflows, failure analytics, cost-per-ton tracking, and spare parts optimization — all in one platform built for heavy industry operations managing complex equipment portfolios.
Expert Perspective: Maintenance Software ROI in Steel
The biggest mistake I see steel plants make with CMMS implementation is treating it as an IT project instead of an operations project. The ROI doesn't come from the software — it comes from changing maintenance behavior. The software is the tool that makes the behavior change sustainable and measurable. We proved it on the rolling mill first. One bearing failure on the finishing stands used to cost us 14 hours of downtime and $1.2 million in lost production plus emergency repairs. Within six months of structured PM tracking, our mechanics could tell you the vibration signature that preceded every failure mode on those stands. We went from four unplanned bearing failures per year to one — and that single improvement paid for the entire plant-wide CMMS deployment three times over. The cost-per-ton dashboard changed everything at the leadership level. When the plant manager could see real-time maintenance cost per ton by production area, maintenance stopped being a black box budget line item and became a controllable variable with direct margin impact.
Start with the Highest-Cost Failures
Don't try to track every asset from day one. Identify your top 10 failure events by total cost (downtime + repair + secondary damage) from the last 24 months. Build CMMS workflows around preventing those specific failures first. Quick wins build credibility and fund expansion.
Measure Before You Implement
Spend 30 days documenting your baseline before going live. Unplanned downtime hours by area, maintenance cost per ton, reactive vs. planned work ratio, spare parts emergency orders. Without a clean baseline, you can't prove ROI — and leadership will dismiss improvement claims as anecdotal.
Make the Floor Crew the Heroes
Maintenance technicians who enter quality failure data and complete PM tasks on schedule are the ones generating ROI. Build recognition into the program — share cost avoidance numbers by crew, celebrate MTBF improvements publicly, and make the mechanics the heroes of every board presentation.
Frequently Asked Questions
What is the typical payback period for CMMS in steel manufacturing?
Payback periods for steel maintenance software typically range from 4–12 weeks when deployed to high-impact production areas first. The primary driver is unplanned downtime reduction — a single avoided failure event on a blast furnace, caster, or rolling mill often recovers more than the entire annual CMMS cost. Plants producing 500,000+ tons per year with current unplanned downtime rates above 3% almost universally achieve payback within the first quarter. Smaller operations or plants with already-mature maintenance programs may see payback in 3–6 months. The ROI accelerates in year two as failure data accumulates and predictive patterns emerge.
Book a Demo to model payback against your specific production volume and downtime costs.
Can CMMS integrate with existing SCADA and automation systems in steel plants?
Yes — and this integration is where maintenance software transitions from work order management to predictive maintenance capability. Oxmaint supports API-based integration with major steel plant automation platforms, enabling condition-based maintenance triggers from vibration sensors, temperature monitors, motor current analysis, and oil quality sensors. When a rolling mill bearing vibration reading exceeds threshold, the CMMS automatically generates a work order with the asset location, failure history, required parts, and recommended procedures. This eliminates the gap between condition detection and maintenance action that causes most predictive maintenance programs to fail. Integration complexity varies by automation platform vintage — modern PLC/SCADA systems connect via standard APIs, while legacy systems may require middleware or OPC-UA gateways.
How do we convince skeptical plant leadership to invest in maintenance software?
Lead with the financial model, not the technology. Calculate your plant's unplanned downtime cost per hour for each production area using actual production rates and margin data. Multiply by current unplanned hours per year. Apply a conservative 25% reduction (the low end of documented CMMS results). That single number — the annual value of avoided downtime — typically exceeds total CMMS cost by 10–50x. Then add maintenance cost per ton reduction, spare parts savings, and compliance cost avoidance. Present a three-year NPV and IRR that finance teams can compare directly against other capital requests. The strongest business cases include a 90-day pilot proposal with specific success criteria — giving leadership a low-risk path to validation before committing to plant-wide deployment.
What data do we need to start building the ROI business case?
Start with five baseline data points that most steel plants can assemble within two weeks: total maintenance spend for the trailing 12 months (labor, materials, contracts), total unplanned downtime hours by production area, current planned vs. reactive work order ratio (even if estimated), spare parts inventory value and emergency purchase frequency, and production volume in tons with revenue per ton. These five numbers feed directly into the ROI framework. If precise data isn't available for every metric, use reasonable estimates — even approximate baselines produce compelling business cases because the improvement percentages from structured CMMS deployment are well-documented across the steel industry.
Sign Up to start capturing the baseline data that powers your financial model.
How does Oxmaint track maintenance cost per ton of steel produced?
Oxmaint calculates cost per ton by aggregating all maintenance work order costs — labor hours at loaded rates, parts consumed, contractor charges, and allocated overhead — against production tonnage data imported from plant reporting systems or entered manually by period. Cost per ton reports are generated at plant level, production area level, and individual equipment level. This granularity reveals which specific assets or areas are driving maintenance cost above benchmark — enabling targeted improvement programs rather than across-the-board budget cuts that compromise reliability. Trend analysis shows cost-per-ton movement over time, providing the evidence that maintenance investments are delivering measurable financial returns to plant leadership and corporate oversight.