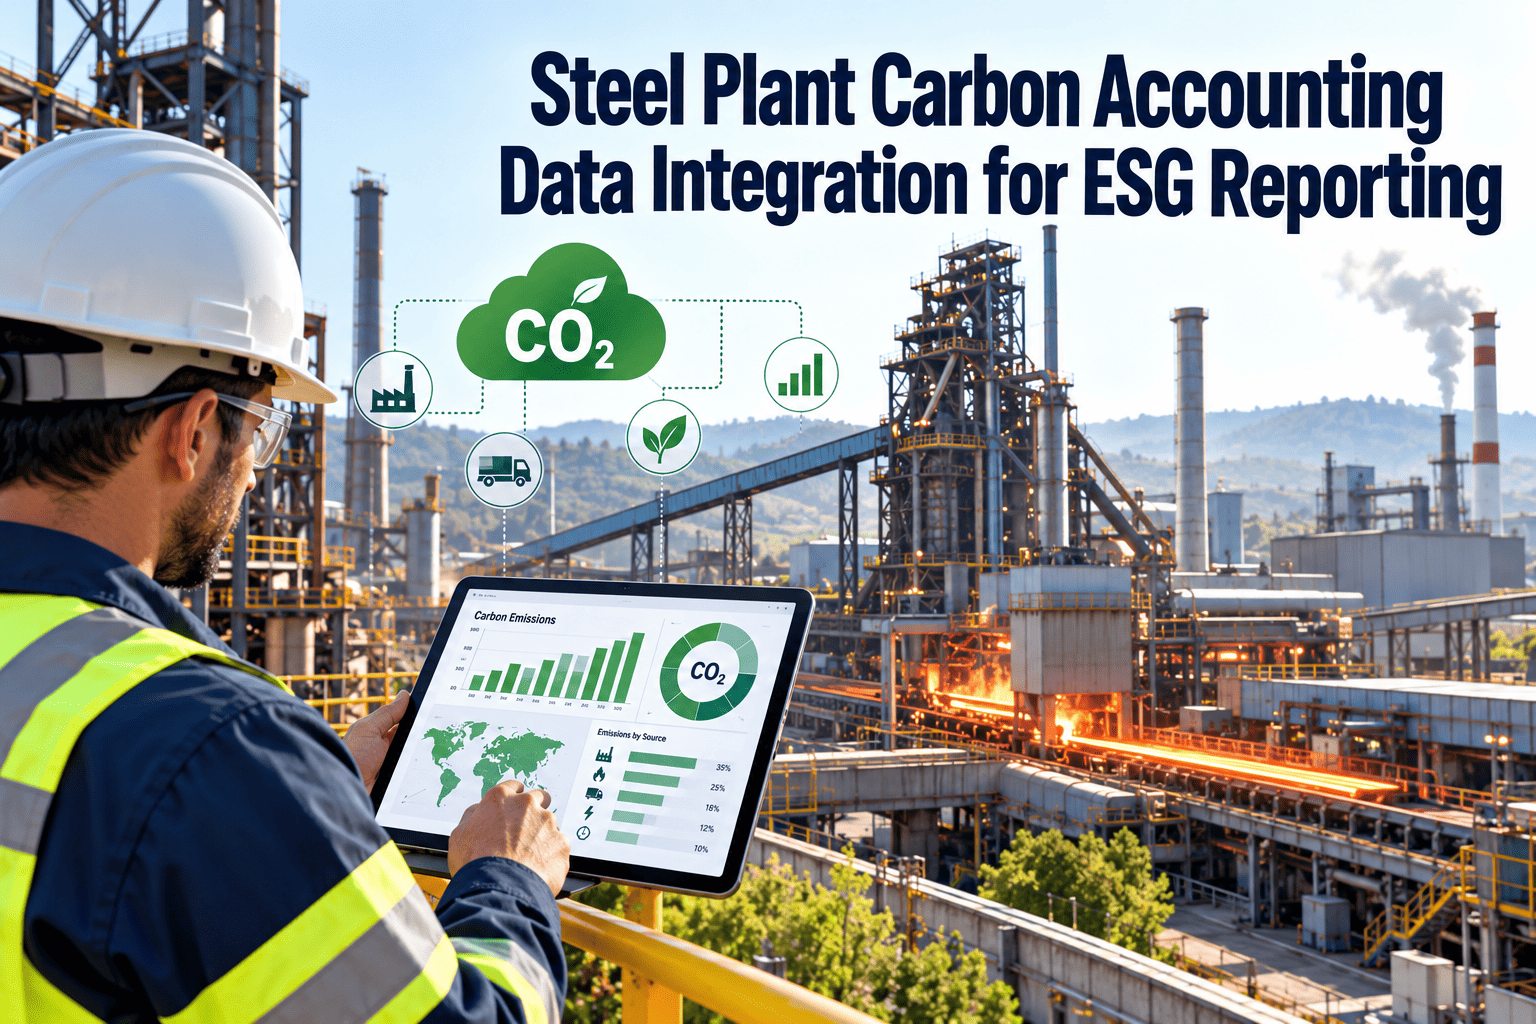
A steel plant carbon inventory is built from dozens of data streams: coke and coal receipts, natural gas and process gas flows, electricity meters, scrap and ore charges, production tonnages and emission factors. Each stream usually has a different owner, a different system and a different reporting rhythm, so the inventory is assembled by hand at year end and checked by whoever remembers the context. Integration means every one of those streams arrives with its source, timestamp and asset attached. Maintenance records are the missing link, because meter health and equipment condition decide whether the numbers can be trusted. See how Oxmaint maintenance management software gives carbon data an asset-level record to stand on.
Carbon Accounting Data Integration
Steel Plant Carbon Accounting Data Integration for ESG Reporting
Connect fuel, power, production and maintenance data into one traceable carbon inventory. Oxmaint adds the asset, calibration and work order layer that makes every number auditable.
- Fuel and gas meters
- Electricity meters
- Raw material receipts
- Production records
- Asset register
- Calibration schedule
- Work order history
- Inspection findings
- Scope 1 by source
- Scope 2 by meter
- Intensity per tonne
- Change log
- CDP and ESG reports
- Customer requests
- CBAM data
- Assurance review
The Integration Problem
Why carbon data breaks between systems
Fragmented ownership
Procurement holds fuel receipts, utilities hold electricity bills, production holds tonnage and maintenance holds meter and equipment records. No single team sees the whole chain.
Different time bases
Shift logs, daily readings, monthly invoices and annual audits each cover a different period. Reconciling them takes manual effort that rarely gets documented.
Unclear boundaries
Steel plants have shared utilities, internal gas flows and by-product exchanges between units. Without a defined boundary, the same emissions can be counted twice or missed entirely.
Unverified instruments
An uncalibrated flow meter or an analyzer past its due date puts doubt on every figure that depends on it, no matter how clean the spreadsheet looks.
Data Source Map
What each carbon input needs before it can be trusted
Every input has a measurement point, an owner and a maintenance dependency. The table lists the main inputs for an integrated or scrap-based steel plant and the record that proves each one.
| Carbon input | Typical source | Maintenance dependency | Proof to keep |
|---|---|---|---|
| Natural gas and process gas | Flow meters per furnace and unit | Flow meter calibration, orifice and transmitter checks | Calibration certificate and last check date |
| Coal, coke and other carbon materials | Weighbridge and receipt records | Scale calibration and inspection | Calibration log and receipt reconciliation |
| Electricity | Main and sub meters | Meter verification and CT checks | Meter list with verification history |
| Electrodes and carbon additions in EAF steelmaking | Consumption logs by heat | Furnace condition and electrode handling | Heat log tied to furnace asset |
| Flaring and venting events | Flare meters and operator logs | Flare system and gas recovery availability | Event record with cause and repair order |
| Production output | Crude steel and product tonnage | Scale and measurement calibration | Tonnage records with scale history |
Method Anchors
Standards that shape how steel carbon data is structured
Why this matters for integration
Different frameworks draw the boundary in different places. A data model that stores each reading against an asset and area lets one set of measurements feed several reports without being re-keyed.
Integration Maturity
Four stages from spreadsheets to a connected inventory
Manual collection
Readings and invoices are copied into one workbook each year. Calibration status is unknown and the method lives in one person's head.
Standard templates
Common sheets and a written method exist, but data is still typed in and checked after the period closes.
Asset-linked records
Meters and equipment sit in an asset register with calibration schedules and work order history tied to each reading point.
Connected reporting
Metered data, maintenance records and production figures flow into shared dashboards, and exceptions are reviewed monthly.
Start With the Asset Layer
Give every meter and emission source an owner and a history
See how Oxmaint holds the asset register, calibration schedule and work orders that carbon data depends on.
Reconciliation
Checks that catch carbon data errors early
Mass and energy balance
- Compare gas purchased with gas metered across units
- Compare electricity at the main meter with the sum of sub meters
- Compare carbon input with steel and by-product output
- Flag differences above a set tolerance for review
Instrument health
- Confirm calibration date for every meter in the inventory
- Review meters with repeated repair or drift findings
- Check for gaps in readings caused by outages or failures
- Record estimated values and the reason they were used
Method consistency
- Use the same emission factors and sources year to year
- Log boundary changes, new units and shutdowns
- Normalize intensity figures by product group
- Keep a signed review for each reporting period
Maintenance Link
How equipment condition feeds the carbon inventory
Where Oxmaint Fits
Capabilities that support integrated carbon reporting
Asset management
Registers meters, analyzers, furnaces and drives with area, owner and criticality so each reading point has a home.
Preventive maintenance
Schedules calibration, verification and combustion checks as recurring tasks with due dates and escalation.
Mobile inspections
Captures readings, photos and findings at the instrument or furnace, with timestamps from the moment of work.
Work orders
Turns deviations into tracked corrective work with failure codes, parts used and verification readings.
Reports and dashboards
Shows calibration currency, PM compliance and open energy-related work by area for monthly review.
Compliance records
Keeps closed records and history together so an evidence pack can be pulled by asset or reporting period.
Rollout Timeline
A practical sequence for connecting carbon and maintenance data
Define the boundary and list every reading point
Agree which units and utilities are inside the inventory, then list each fuel, power, gas and production measurement with its owner.
Load the asset register
Enter meters, analyzers and energy-significant equipment with area, tag and last calibration date.
Schedule calibration and inspection routes
Create recurring tasks, mobile checklists and failure codes that record whether an issue affects measurement or energy use.
Run a trial reconciliation
Compare one month of carbon inputs with maintenance records, review the exceptions and tune the process before the next cycle.
Governance
Controls reviewers expect around carbon data
Keep the review light enough to repeat
A monthly thirty-minute review of exceptions, overdue calibrations and open energy work orders is easier to sustain than a heavy quarterly exercise. Small, regular checks keep the inventory current and leave a visible trail for assurance providers.
Calculation Structure
How measured data becomes an intensity figure
The arithmetic is simple. The difficulty lies in making sure every term in it is measured, owned and checked. This structure shows where maintenance records sit behind each term.
Where errors enter
Most disputes come from the activity data and production terms, not the factors. A drifting flow meter or an uncalibrated scale changes the numerator or denominator without any visible warning in the final report.
Illustrative Scenario
How a drifting meter shows up, and how records resolve it
The scenario below is illustrative, not a customer result. It shows the sequence of events a connected maintenance record is meant to shorten.
- A furnace gas meter slowly under-reads over several months
- Reported fuel per tonne looks better than the plant actually performs
- The reconciliation with gas purchases shows a gap at year end
- Nobody can say when the meter was last checked
- The team estimates a correction and documents it in an email
- The meter has a calibration task with a due date and owner
- A monthly gas balance flags the difference within weeks
- The finding becomes a work order against the meter asset
- Calibration results and the correction are stored together
- The affected period and the reason are visible to reviewers
Ownership Matrix
Who owns which part of the carbon data chain
| Role | Owns | Records it contributes |
|---|---|---|
| Maintenance and instrumentation | Meter health, calibration and repair | Calibration tasks, repair orders, drift findings |
| Operations | Process readings and event logs | Shift readings, flaring and venting events, restart notes |
| Energy and utilities | Gas, power and water balances | Sub meter data and balance reviews |
| Procurement and logistics | Material and fuel receipts | Receipts, weighbridge data and supplier documents |
| ESG and sustainability | Method, boundary and disclosures | Inventory, change log and reviewer responses |
Exception Workflow
What should happen when a carbon data check fails
Detect
A balance check, a missing reading or an overdue calibration is flagged during the monthly review.
Assign
A work order is raised against the affected meter or equipment and assigned with a due date.
Correct
The technician repairs or recalibrates the instrument and records the as-found and as-left readings.
Document
The ESG team records the affected period, any estimate used and the reference to the closed work order.
Data Quality Tiers
Grading each carbon input by how well it can be defended
Not every input needs the same effort. Grading them shows where to spend calibration and inspection time first, and which figures deserve a caveat in the report.
Metered, calibrated and reconciled
The reading point is in the asset register, calibration is current, and a balance check confirms it against purchases or output. Evidence can be produced in minutes.
Metered but not reconciled
The meter exists and is read regularly, but nothing compares it against another source. Drift could go unnoticed for long periods.
Estimated from invoices or engineering judgment
No plant-level measurement exists. These figures need a documented method, a stated uncertainty and a plan to add metering where the amount is material.
Use the grading to set the maintenance plan
Start by moving the largest low-grade inputs up one tier. A new sub meter with a calibration task and a monthly balance often improves defensibility more than a new reporting tool.
FAQ
Steel plant carbon accounting data integration: common questions
Does a CMMS replace carbon accounting software?
No. Carbon software calculates the inventory, while a CMMS keeps the asset, calibration and work order records behind the inputs. Oxmaint supplies that second layer.
Which maintenance data is most useful for carbon reporting?
Meter calibration history, combustion and efficiency repairs, leak closures and downtime events. These explain changes in fuel, power and intensity figures.
How does ISO 14404 relate to Scope 1 and Scope 2 reporting?
ISO 14404 sets a method for CO2 intensity of steel production, while the GHG Protocol sets the scope categories. Many plants use both, so data should be stored in a way either can read.
How should estimated values be handled?
Record the estimate, the reason and the repair order that restores measurement. A short demo can show how gaps are tracked to closure.
Can the same data support CBAM requests?
Verified installation data is central to CBAM, and controlled meter and production records help support it. The embedded emissions calculation itself follows the regulation and guidance.
Connect the Data Once
Build a carbon inventory your auditors can trace back to the plant floor
Bring meter health, equipment condition and maintenance history into the same view as your emissions data.