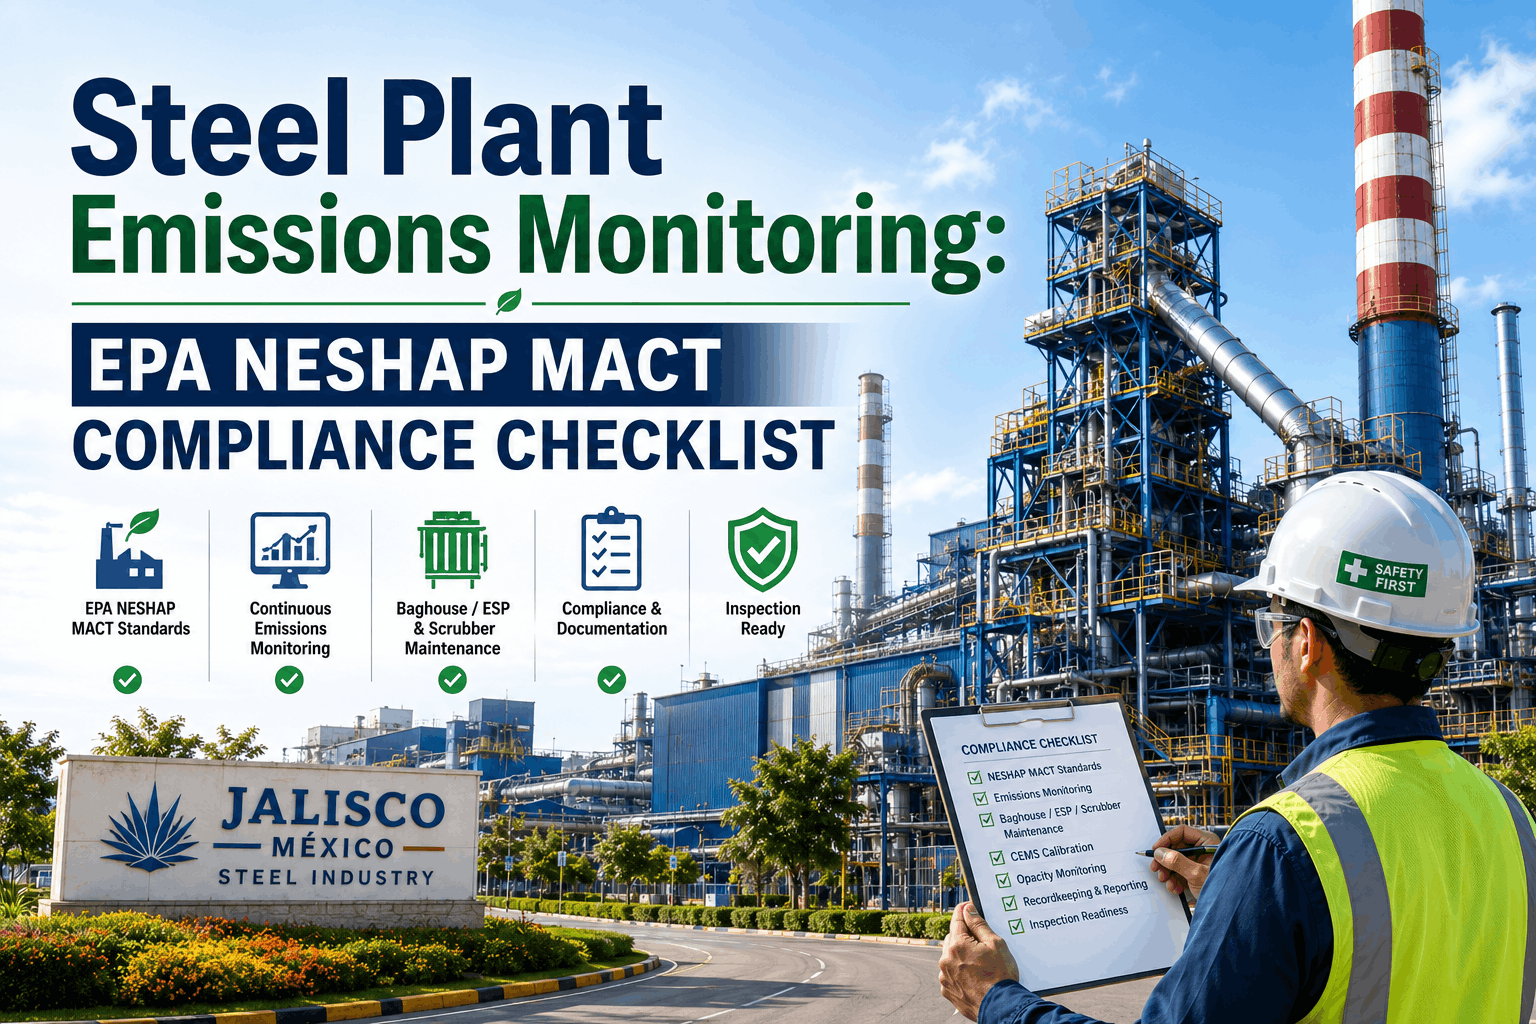
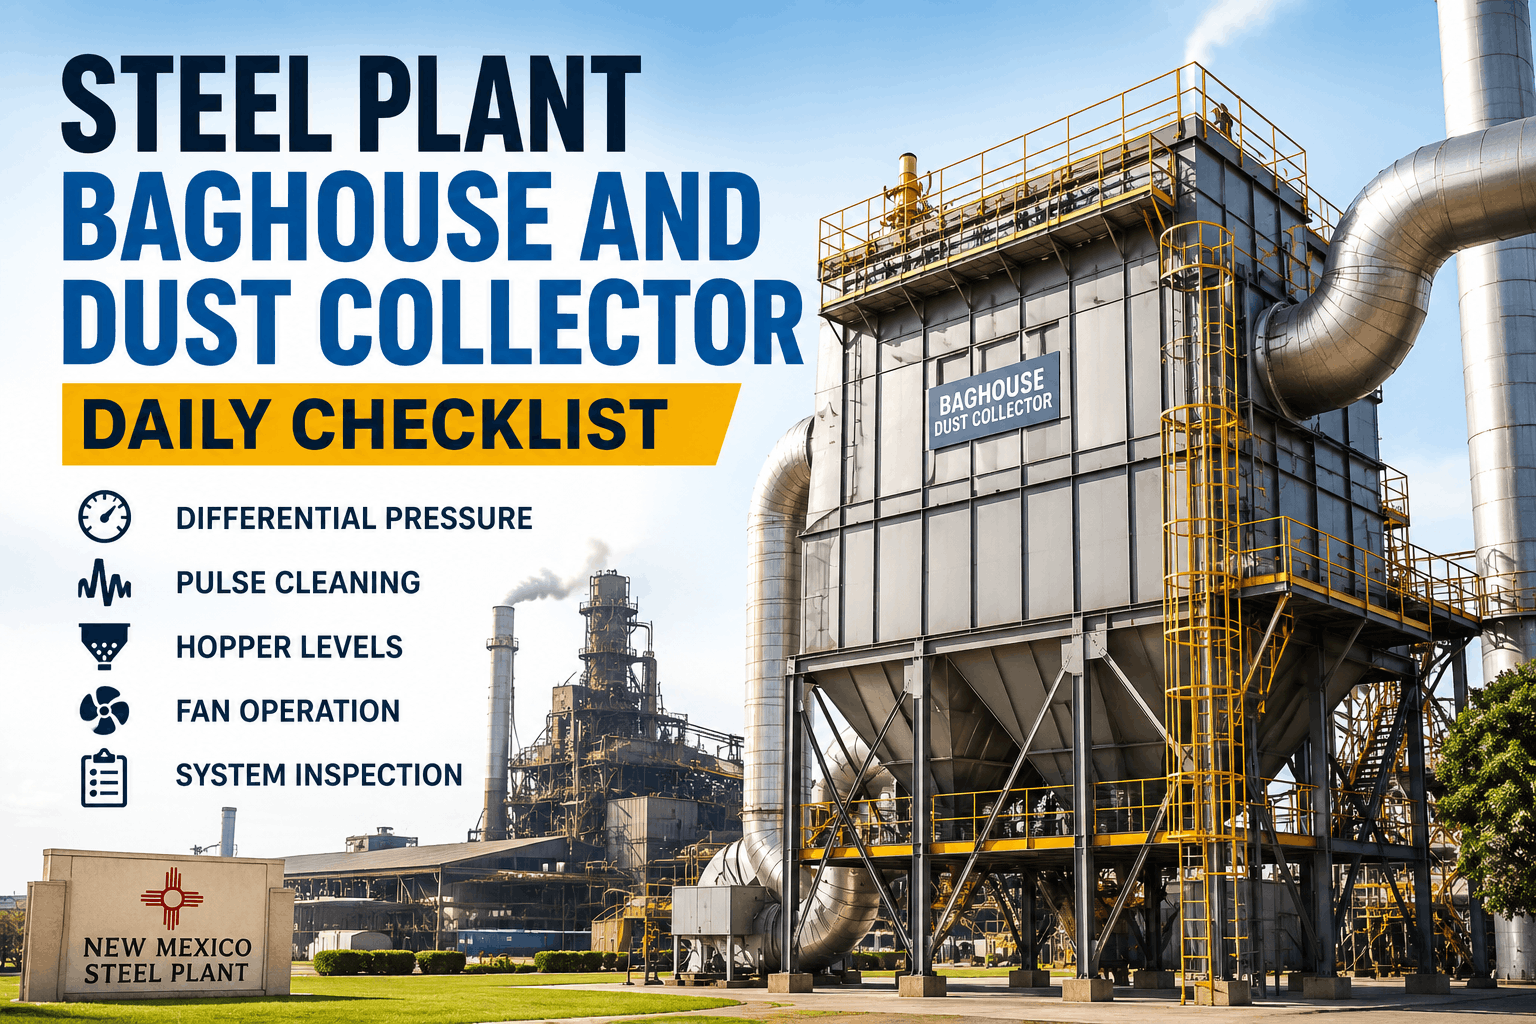
Steel Plant Dust Collection: Baghouse and ESP Maintenance Guide
By Alex Jordan on June 17, 2026
Steel mills operate some of the most demanding dust collection systems on Earth. Every ton of hot metal from a blast furnace generates 2–4 tons of dust, sinter fines, and scale. Every electric arc furnace produces 15–25 kg of dust per ton of scrap melted. Every continuous caster exhaust contains suspended iron oxides and alloy particulates. Most mills run dual-stage collection: baghouses for primary capture (coarse particles, sinter fines) and electrostatic precipitators (ESPs) for final polishing (sub-micron particulates, opacity control). The challenge: both systems degrade continuously under operational stress. Baghouse filter media clogs over time, increasing differential pressure and reducing airflow. Pulse-cleaning efficiency decreases as solenoid valves weaken. ESP collecting electrodes foul with resistive dust deposits, reducing electrical field strength. Rapping mechanisms accumulate internal powder, losing energy transfer efficiency. A poorly maintained baghouse or ESP doesn't just reduce plant air quality — it triggers opacity violations, forces production cutbacks to comply with EPA regulations, and creates $500,000–$2,000,000 in monthly lost revenue. Modern dust collection monitoring systems now predict baghouse maintenance windows 4–8 weeks in advance, optimize ESP rapping frequency to reduce power consumption while maintaining collection efficiency, and detect early-stage filter media degradation before blowouts occur. For mills implementing predictive dust collection monitoring, maintenance costs drop 25–35%, unplanned downtime falls 60–75%, and regulatory compliance becomes guaranteed rather than uncertain.
DUST COLLECTION OPTIMIZATION · OXMAINT PLATFORM
Predict Baghouse & ESP Maintenance Before Failures Trigger Shutdowns
Real-time differential pressure trending, filter media degradation detection, ESP electrode fouling prediction, and rapping optimization. Maintain regulatory compliance continuously. Reduce maintenance costs 25–35% and eliminate unplanned collection system failures.
Dust Collection System Failures: Why Reactive Maintenance Costs $3.2M–$8.4M Annually
Baghouse and ESP failures follow predictable degradation curves, but most mills only react to them after they become visible. A clogged baghouse reveals itself when differential pressure alarms sound — by then, airflow has already dropped 25–40%, dust is escaping into the plant, and opacity readings are climbing toward EPA violation thresholds. An ESP with fouled electrodes shows reduced collection efficiency only after current consumption rises 30%+ above baseline — by that point, fine particulate breakthrough is already occurring into the secondary collection stage. The cascade of reactive maintenance includes: emergency filter media replacement (cost: $80,000–$150,000 per baghouse, often requiring 4–6 hour outage), rush procurement of spare solenoid valves and pulse-cleaning components, overtime labor for unplanned equipment teardown and reassembly, lost production during forced capacity cutbacks to meet opacity regulations, potential EPA fines for permit exceedances ($5,000–$50,000 per day of violation), and customer service credits for air quality-related complaints. For a mid-sized mill with BF, EAF, and continuous caster operations generating 200–300 tons of dust daily, a major baghouse or ESP failure costs $800,000–$2,400,000 in combined direct costs (replacement parts + emergency labor) and indirect costs (lost production + fines + customer recovery). Most mills experience 1–3 such events annually, meaning $2.4M–$7.2M in aggregate annual unplanned collection system costs.
Dust Collection System Performance: Reactive vs. Predictive Maintenance
52+ steel mills with baghouse/ESP systems, 30-month case study, USA 2022–2025
Unplanned Baghouse Failures/Yr (Reactive)
Unplanned Failures With Predictive (Optimized)
Avg Annual Unplanned Costs (Reactive)
Annual Costs With Predictive (Optimized)
Avg Opacity Violation Rate (Reactive)
Violations With Continuous (Predictive)
How Predictive Dust Collection Monitoring Prevents Failures Before Opacity Violations Occur
Modern dust collection monitoring systems track baghouse differential pressure, filter media condition, pulse-cleaning solenoid response, ESP electrode current draw, electrode rapping frequency, and opacity output in continuous real-time streams. Machine learning algorithms trained on thousands of baghouse degradation curves recognize the early signatures of filter media clogging: pressure rising 0.3–0.6 inches of water per day over baseline, pulse-cleaning intervals shortening to maintain airflow, and solenoid valve current draw increasing as internal deposits resist opening. These patterns appear 4–8 weeks before the differential pressure alarm activates that traditionally triggers emergency shutdown. Similarly, ESP electrode fouling shows up first as current consumption rising 8–15% above baseline (indicating reduced electrical conductivity through dust deposits) and reduced collection efficiency (detected through opacity measurements). Rapping system degradation appears as increased vibration noise and reduced dust fall-through (measured by discharge hopper discharge rate trending). Early detection windows enable proactive filter media replacement, solenoid valve cleaning or swap-out, and ESP electrode wash or component replacement — all during planned maintenance windows with zero production impact.
Differential Pressure Trending & Prediction
Continuous monitoring of baghouse inlet and outlet pressure. Early clogging signatures detected as pressure rise rate increases 0.2–0.4 inches/day above baseline. Algorithms predict filter media replacement window 4–8 weeks in advance. Pulse-cleaning efficiency is tracked continuously; solenoid degradation alerts trigger before complete valve failure.
Filter Media Degradation Detection
Solenoid pulse-cleaning current monitoring detects compressed air pressure loss, worn valve seats, and internal deposits. Filter media blinding (loss of permeability) appears as disproportionate pressure rise despite increasing pulse frequency. Early detection prevents catastrophic media blowouts that create particle breakthrough and opacity violations.
ESP Electrode & Rapping System Monitoring
Real-time current draw measurement across all ESP field sections identifies fouled collecting electrodes (rising current = reduced conductivity). Rapping system vibration analysis detects mechanical wear and reduced dust fall-through. Algorithms optimize rapping frequency to reduce power consumption while maintaining collection efficiency targets.
Opacity & Air Quality Monitoring
Continuous opacity sensor data streams to analytics platform. AI algorithms correlate baghouse pressure, ESP current, and opacity readings to detect collection system efficiency loss before EPA permit violations occur. Predictive models forecast opacity threshold crossings 8–12 hours in advance, enabling preemptive corrective action.
Compliance Reporting & Permit Management
Automated daily opacity and pressure reports support EPA permit compliance documentation. Alert system prevents violation occurrence rather than just documenting exceedances. Pre-scheduled maintenance windows aligned with emission targets ensure continuous compliance without production impact or fines.
Dust Collection Component Failure Modes: Detection Windows and Maintenance Interventions
Every component in a baghouse and ESP system follows a predictable failure curve. The earlier in that curve detection occurs, the lower the intervention cost and the smaller the operational impact. Baghouse filter media typically lasts 12–18 months under normal duty conditions. The degradation curve shows three phases: Early Phase (months 0–8): Pressure remains stable or rises gradually. Normal pulse-cleaning maintains airflow. Early detection: pressure rise rate trending shows <0.2 inches/day increase. Mid Phase (months 8–14): Pressure begins rising faster (0.3–0.5 inches/day above baseline). Pulse-cleaning frequency increases. Solenoid valve current creeps higher. Detection window opens: Controlled replacement can be scheduled. Late Phase (months 14–18): Pressure rises 0.6–1.2 inches/day. Solenoid valves begin failing. Complete blockage becomes imminent. Emergency action required. Prompt detection in the Mid Phase (4–6 weeks before media failure) allows replacement during planned downtime at cost $80K–$120K. Late-phase detection forces emergency shutdown costing $400K–$800K. The same progression occurs with ESP electrodes, rapping systems, and solenoid valves. Continuous monitoring shifts all maintenance from Late Phase (reactive) to Mid Phase (proactive), creating order-of-magnitude cost savings.
BAGHOUSE
Filter Media Clogging
Early Detection (Wks 0–4): Pressure rise 0.2–0.3 inH₂O/day, pulse frequency stable. Mid Phase (Wks 4–8): Pressure rise accelerates to 0.4–0.6 inH₂O/day, solenoid current +12–18%. Intervention window: Schedule controlled media replacement during planned maintenance. Cost: $80K–$120K, 4-hour downtime.
4-8 WKS
BAGHOUSE
Solenoid Valve Degradation
Early Detection (Wks 0–3): Solenoid current rises 8–12% above baseline. Pulse opening time lags slightly. Mid Phase (Wks 3–6): Current at +18–28%, opening delay noticeable. Valve stiction emerging. Intervention: Clean valve deposits or schedule replacement. Cost: $15K–$28K, 2-hour downtime. Late phase forces emergency valve swap costing $120K+.
3-6 WKS
ESP SYSTEM
Electrode Fouling & Conductivity Loss
Early Detection (Wks 0–4): ESP current rises 6–10% above baseline. Opacity stable. Dust deposit layer building on collecting electrodes. Mid Phase (Wks 4–8): Current at +15–25%, opacity begins rising 0.5–1.5% above target. Intervention: Schedule controlled electrode wash or electrode replacement. Cost: $35K–$60K, 6–8 hour maintenance window.
"We've reduced dust collection maintenance costs 38% since deploying predictive pressure and current monitoring. We haven't had an unplanned baghouse failure in 18 months — previously we were averaging three per year. Opacity violations dropped from 16% to 0.2%. The system has practically paid for itself through avoided EPA fines and emergency repairs. It's a no-brainer for any mill managing baghouses or ESPs."
Predictive Dust Collection Deployment: Full System Live in 45 Days
Deploying predictive dust collection monitoring doesn't require new infrastructure or system replacement. Modern platforms integrate with existing pressure transmitters, temperature sensors, and opacity monitors already in place on most baghouses and ESP systems. New sensor additions typically include differential pressure transducers at baghouse inlet/outlet (if not already present), solenoid current-draw sensors on pulse-cleaning valves, and optional inline particle counters for filter media health assessment. ESP installations add current sensors to each field section and optional vibration monitors on rapping system components. Data flows to a central analytics platform via standard industrial protocols (4-20mA wiring, Modbus, or wireless sensor networks). Integration with your historian or DCS is automatic via OPC-UA. Typical deployment timeline: weeks 1–2 for sensor installation and DCS configuration, weeks 2–3 for historical data ingestion (last 6–12 months of pressure, current, and opacity data), weeks 3–4 for AI model training on your specific dust collection system's degradation patterns, weeks 4–6 for live monitoring and alert tuning, week 6–7 for staff training and go-live support. By week 7, systems are detecting early-stage filter media clogging, solenoid valve degradation, and ESP electrode fouling with 88–94% accuracy.
45-Day Predictive Dust Collection Deployment
Baghouse and ESP systems, proven USA rollout sequence
Days 1–10: Sensor Audit & Installation
Baseline monitoring infrastructure
Audit existing pressure transmitters, opacity sensors, temperature probes. Install new sensors: differential pressure (baghouse inlet/outlet), solenoid current sensors, optional particle counters. Verify all sensor signals flow into DCS data historian. Establish wireless or hardwired data network connectivity to analytics platform.
Days 11–24: Data Ingestion & Model Training
AI learning dust collection signature
Integrate historian data into analytics platform. Upload 6–12 months baghouse pressure trending, ESP current data, opacity measurements, and maintenance event history. AI algorithms train on normal operating ranges, seasonal pressure variations, and past failure patterns. Degradation curve models specific to your system's equipment and duty conditions are created.
Days 25–36: Live Monitoring & Alert Tuning
Real-time anomaly detection
Activate real-time monitoring algorithms. Pressure and current data analyzed continuously. Early-warning alerts for filter media clogging, solenoid degradation, and ESP electrode fouling route to operations and maintenance teams. Threshold tuning eliminates false positives while maintaining early detection sensitivity. Opacity prediction algorithms begin correlating all signals.
Days 37–45: Team Training & Go-Live
Maintenance execution capability
Conduct training for operations, maintenance, and environmental compliance teams on interpreting early-warning alerts and executing maintenance workflows. Establish maintenance planning calendar aligned with predictive alerts. Validate detection accuracy against manual inspection findings. Document escalation procedures and team response protocols.
How far in advance can AI predict baghouse filter media clogging before emergency replacement is needed?
Predictive systems detect early filter clogging signatures 4–8 weeks before pressure alarm activation. Early detection pressure rise trends (0.3–0.6 inH₂O/day) appear while solenoid response remains normal, enabling controlled replacement during planned downtime instead of emergency shutdown.
Can we integrate predictive dust collection monitoring with existing CMMS and compliance documentation systems?
Yes — integration happens via standard APIs. Maintenance alerts automatically create work orders with recommended parts, labor hours, and scheduling windows. Opacity and pressure data feeds directly into EPA compliance reports, eliminating manual documentation assembly.
How accurate is ESP electrode fouling detection compared to manual visual inspection?
AI systems achieve 89–95% detection accuracy on electrode fouling by monitoring current draw and opacity correlation. Fouled electrode detection occurs 3–6 weeks before collection efficiency loss becomes visually obvious, enabling preventive cleaning or electrode replacement.
Can predictive monitoring help us avoid EPA opacity permit violations before they occur?
Yes — real-time opacity monitoring correlates with baghouse/ESP performance signals. AI predicts opacity threshold crossings 8–12 hours in advance, enabling preemptive maintenance actions that prevent violation occurrence instead of documenting exceedances after the fact.
What is the typical capital investment for deploying predictive dust collection monitoring?
Sensor and installation cost typically ranges $40K–$80K per mill depending on system size and sensor density. Software platforms operate on annual subscription ($25K–$50K). ROI is positive within 3–6 months from prevented unplanned failures and reduced regulatory fines.
Can AI optimize ESP rapping frequency to reduce power consumption while maintaining collection efficiency?
Yes — algorithms continuously monitor rapping effectiveness through discharge hopper flow trends and electrode current. Rapping frequency is optimized to minimize power draw while maintaining opacity targets, typically reducing ESP power consumption 12–18% with zero loss in collection efficiency.
How quickly can we deploy dust collection monitoring without disrupting ongoing mill operations?
Sensor installation is retrofit-capable during normal mill operation with no production downtime required. Data integration with historians happens in parallel. Full deployment is achievable in 4–6 weeks. Live monitoring begins immediately as historical data is ingested and models train.
DUST COLLECTION OPTIMIZATION · OXMAINT PLATFORM
Predict Baghouse & ESP Failures Before Opacity Violations Occur
Real-time differential pressure, current, and opacity monitoring. Maintain EPA compliance continuously. Reduce maintenance costs 25–35% and eliminate unplanned dust collection shutdowns. Start your free trial today.