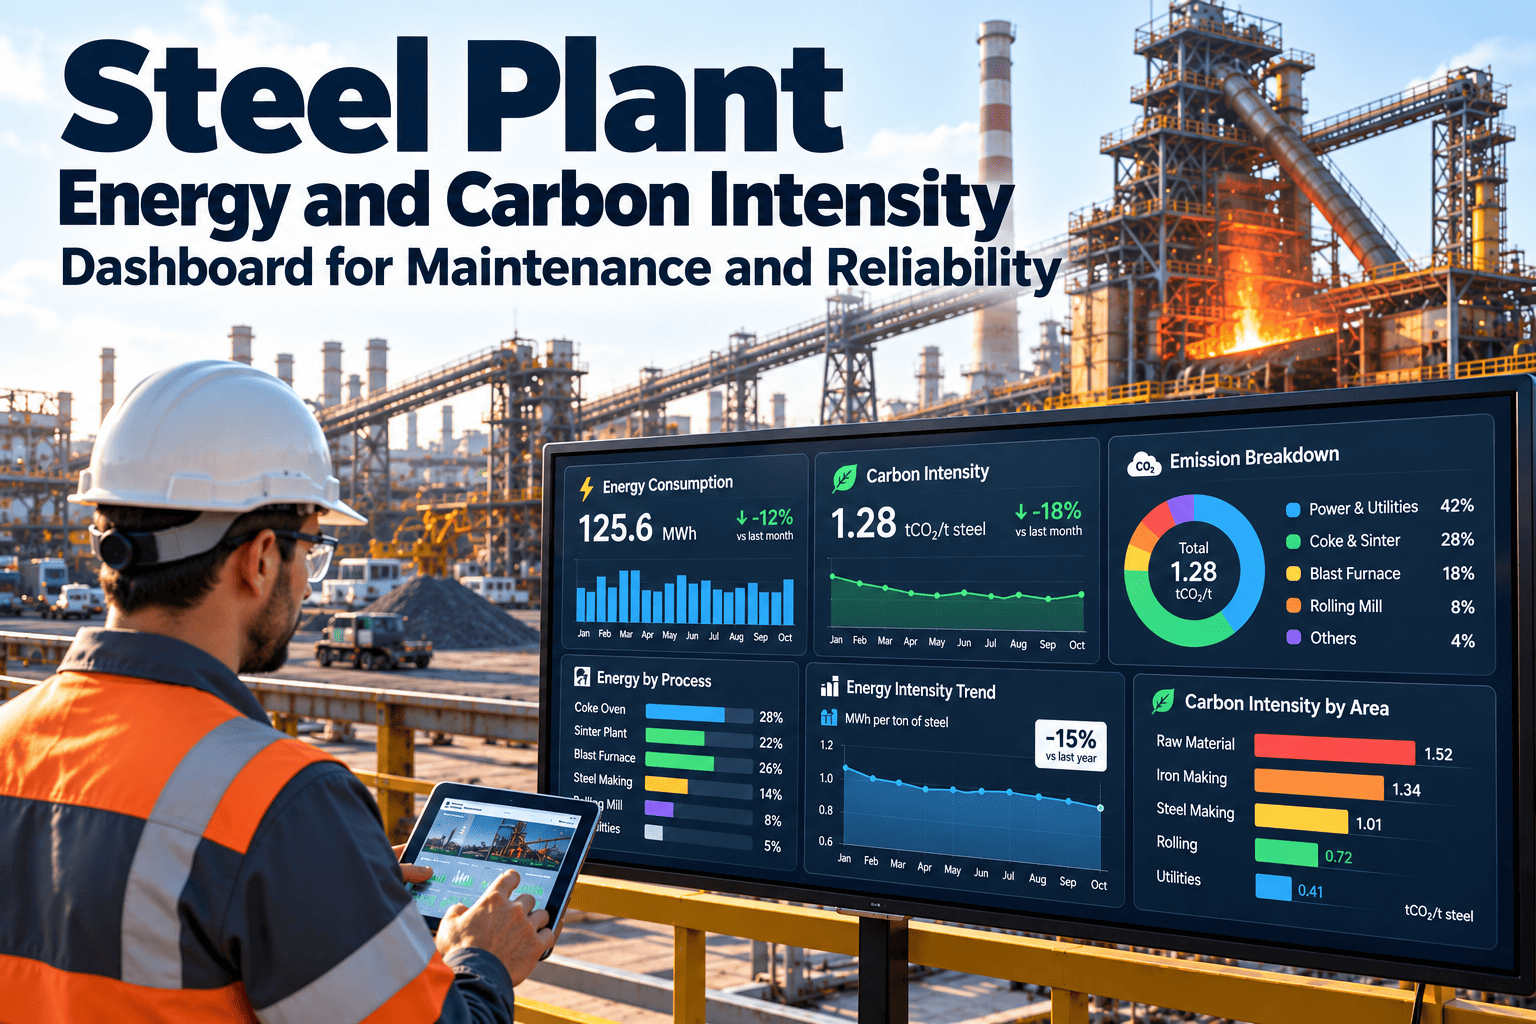
Most steel plant carbon dashboards stop at the meter. They show tonnes of CO2 and gigajoules per tonne of crude steel, but they say little about why the number moved. Yet a leaking steam trap, a degraded furnace lining, a misaligned motor or a stalled waste heat recovery unit changes energy intensity just as surely as a change in process route. This guide explains how to build an energy and carbon intensity dashboard that includes equipment condition, so maintenance and reliability teams can see which assets are raising the figure and act on them. To see how maintenance records can sit beside your reporting workflow, start with Oxmaint.
Steel Plant Energy and Carbon Intensity Dashboard for Maintenance and Reliability
Connect energy and emissions intensity to the equipment that influences it, so reliability work shows up as measurable reduction instead of a line in a sustainability report.
What a typical carbon dashboard shows and what it misses
Usually on the screen
- Total energy consumption by fuel and by month
- Scope 1 and Scope 2 emissions totals
- Intensity per tonne of crude or finished steel
- Year-on-year or target comparison
Usually missing
- Which assets are running in a degraded state
- Open corrective work that wastes energy while it waits
- Whether a drop in intensity came from a repair or from a production mix change
- Whether the meters feeding the dashboard are calibrated
A dashboard that cannot explain a movement in intensity will not tell an engineer what to fix.
Why the reporting pressure is rising
Several expectations are converging on steel producers, and each depends on data that the maintenance team helps keep trustworthy.
Define boundaries
The Greenhouse Gas Protocol separates direct Scope 1 emissions from purchased electricity under Scope 2 and value chain emissions under Scope 3.
Prove the data
Customers, auditors and verifiers increasingly ask how readings were taken, how meters are maintained and who approved corrections.
Meet carbon rules
The EU carbon border mechanism entered its definitive period on 1 January 2026, with the first annual declaration for 2026 imports due on 30 September 2027.
Act on losses
Energy management systems such as ISO 50001 expect continual improvement, which needs a defined list of actions tied to equipment.
A point on scope
Published European Commission guidance indicates that, for iron and steel, the definitive period focuses mainly on direct emissions. Rules differ by product and route and continue to evolve, so confirm current requirements with your compliance team.
Where steel plant emissions and energy sit by scope
Direct emissions on site
Coke ovens, blast furnace and stoves, converters, reheating furnaces, on-site boilers and flaring of process gases. Combustion efficiency and gas leaks are maintenance-driven.
Purchased electricity, steam or heat
Arc furnaces, rolling mill drives, compressors, fans, pumps and oxygen plants. Motor condition, drive settings and air or water leakage raise consumption.
Value chain emissions
Purchased raw materials, transport and downstream use. Maintenance influences this mainly through yield, scrap and rework losses.
The energy loss ladder: conditions that raise intensity
Each rung below links an equipment condition to an energy effect, a dashboard signal and a maintenance response. Use it as a starting list and rank rungs by your own plant data.
Anatomy of a maintenance-linked intensity dashboard
The layout below puts the headline figure beside the maintenance evidence. Each panel states the question it answers so reviews stay focused.
Intensity trend by area
Question: which area moved and when? Overlay major repairs, outages and campaign changes as markers.
Energy-critical asset condition
Question: which assets run degraded? Source: inspections and condition findings.
Open energy-loss work orders
Question: how much known waste is waiting? Source: corrective work orders by age.
Preventive maintenance compliance
Question: are efficiency-related PMs done on time? Source: PM schedule completion.
Meter and instrument calibration status
Question: can the numbers be trusted? Source: calibration tasks and records for flow, power, gas and weighing instruments.
Normalize before you compare
Energy intensity
Emissions intensity
Factors that distort intensity without any change in equipment health
- Production route and the share of scrap in the charge
- Product mix, grade and finishing requirements
- Capacity utilization and number of start-ups and stops
- Ambient temperature and cooling water conditions
Compare like with like, and annotate the dashboard with maintenance events so a reduction caused by a repair is not confused with a change in mix.
Show which maintenance actions moved your energy figures
Oxmaint keeps asset records, inspections, preventive maintenance and work orders together so reliability teams can tie actions to the loss they removed.
Before and after: report-only versus maintenance-linked
Report-only approach
- Intensity reviewed monthly by sustainability staff alone
- Energy losses discussed in general terms
- Meter issues found during verification
- Reduction projects separate from maintenance plans
Maintenance-linked approach
- Reliability and operations review intensity together
- Losses logged as work orders against named assets
- Meter calibration scheduled and recorded in advance
- Efficiency tasks built into preventive maintenance
Build the dashboard in five stages
Fix the boundaries
Agree which areas, fuels and products are in scope and how each metered stream maps to Scope 1 or Scope 2.
List energy-critical assets
Tag the furnaces, compressors, pumps, fans, drives and recovery units whose condition moves consumption.
Secure the meters
Put every metering instrument on a calibration schedule and keep the records with the asset.
Link events to numbers
Record repairs, leaks found and outages with dates so they can be overlaid on the intensity trend.
Review and act
Hold a monthly review with named owners for each open loss and a closing date.
Data quality checklist for audit-ready reporting
Instruments
Calibration dates, tolerances and as-found results stored per meter.
Gaps and corrections
Every estimated reading or manual correction has a reason and an approver.
Asset hierarchy
Meters and consumers are mapped to the same area structure as work orders.
Work order history
Efficiency repairs carry a clear cause code so they can be filtered and counted.
Outage records
Planned and unplanned stops are logged with start, end and cause.
Retention
Records are retained and retrievable for the period your verifier requires.
Where a CMMS fits in energy and carbon work
What the maintenance system holds
- Asset registers and hierarchy
- Preventive maintenance schedules and compliance
- Inspections and condition findings
- Work orders, backlog and spare parts usage
- Reports and dashboards for reviews
What usually stays elsewhere
- Real-time metering and historian data
- Energy management and emissions calculation tools
- Production tonnage from the plant system
- Regulatory submissions and third-party verification
Oxmaint covers the maintenance side of this picture. Energy and emissions figures typically come from your metering and reporting systems and are reviewed alongside it.
Maintenance levers differ by production route
The assets that matter most depend on whether the plant is based on blast furnace and converter steelmaking or on electric arc furnaces. Build the asset list for your own route.
Blast furnace and converter route
- Hot blast stoves, burners and combustion control for fuel efficiency
- Top gas recovery and by-product gas networks, including holders, valves and flares
- Coke oven battery condition and heating system integrity
- Oxygen plant compressors, which are large electricity consumers
- Gas cleaning fans and pollution control equipment availability
Electric arc furnace route
- Furnace transformer, electrodes, panels and power quality equipment
- Off-gas systems, ducts and heat recovery where installed
- Ladle furnace and vacuum equipment utilities
- Cooling water circuits and pumps serving the melt shop
- Rolling mill drives and reheating furnaces downstream
Write efficiency into preventive maintenance tasks
Energy improvements last only when the checks that protect them recur. Add short efficiency steps to routine tasks instead of running one-off campaigns.
Leak surveys
Schedule recurring walk-downs for compressed air, steam and gas lines, with each leak logged as a tagged work order.
Combustion checks
Include burner condition and air-to-fuel settings in furnace inspections and record the readings found.
Insulation and refractory
Record surface condition, hot spots and missing insulation during routine rounds, then plan repairs at the next outage.
Motor and drive condition
Add alignment, lubrication and thermal checks for large motors, fans and pumps that run continuously.
Heat exchanger fouling
Trigger cleaning by observed performance, such as pressure drop or temperature approach, alongside calendar intervals.
Control and instrument checks
Verify sensors, valves and control loops that govern temperature, pressure and flow, since faults there waste energy silently.
An agenda for the monthly energy and reliability review
Headline movement
Review intensity by area and note any change beyond normal variation.
Explain the cause
Check production mix, outages and maintenance events for each movement.
Open loss register
Walk through known energy losses by age, owner and planned close date.
Data integrity
Confirm meter calibration status and any estimated or corrected readings.
Decide actions
Assign work, parts and outage slots, and record decisions for the next review.
Mistakes that weaken an intensity dashboard
What goes wrong
- Comparing months without adjusting for production mix or utilization
- Claiming savings that were never traced to a specific repair
- Leaving meter errors unresolved until a verifier asks
- Showing so many indicators that no owner is accountable
What works better
- Normalize and annotate, then compare equivalent periods
- Link each claimed reduction to a closed work order and a measured before and after
- Calibrate meters on a visible schedule with records kept
- Limit the dashboard to a few measures, each with a named owner
Reading the dashboard: three common signals
Fuel per tonne rises while output is steady
Check furnace burners and refractory, steam and gas leaks, recuperator condition and fuel meter calibration. Review open corrective work orders on those assets before assuming a process change.
Electricity per tonne rises on one mill or fan
Look at product mix and loading first, then at alignment, bearing condition, lubrication and drive settings. A rising trend on one asset points to condition, not to plant-wide demand.
Intensity falls after a repair
Confirm the improvement against a comparable period and product mix, then keep the closed work order as evidence. A reduction you can explain is one you can repeat.
Who owns which part of the picture
Maintenance planner
Schedules efficiency tasks, keeps loss-related work orders moving and protects the parts needed to close them.
Reliability engineer
Analyzes which assets drive consumption and recommends repairs, upgrades or changes to inspection frequency.
Energy manager
Owns the intensity figures, normalization method and metering plan, and flags unexplained movement.
Operations
Provides production data and access for repairs, and decides how process settings affect consumption.
Sustainability and compliance
Handles reporting boundaries, verification and customer requests, drawing on records the plant teams maintain.
Plant leadership
Sets targets, funds repairs with clear energy benefit and expects each claimed saving to be traceable.
Frequently asked questions
Why should maintenance own part of the carbon dashboard?
Equipment condition drives a large share of avoidable energy use. Maintenance records explain why intensity moved and show which repairs delivered a reduction.
Which assets should I track first?
Start with the biggest consumers: furnaces, compressors, large motors and drives, pumps, fans and heat recovery units. Rank them using your own metered data.
Can a CMMS calculate carbon emissions?
Emissions calculation usually sits in dedicated energy or carbon tools. A CMMS supports it by keeping meter calibration, outage and repair records, and you can book a demo to see how.
How do I avoid misreading intensity changes?
Normalize for route, product mix and utilization, then annotate the trend with maintenance events. Compare equivalent periods only.
Does this help with ESG and customer reporting?
Yes. Calibration records, inspection history and work orders give verifiers evidence for how data was produced. You can sign up to organize those records.
Make every energy reduction traceable to a maintenance action
Link asset condition, inspections, calibration and work orders to your intensity reviews, so reliability work becomes visible in the numbers.