A reheating furnace with degraded regenerator brick linings consumes 15–20% more natural gas than design specification — but a monthly energy report arrives weeks after the equipment fails, making corrective action impossible. A blast furnace running hotter due to stave cooler fouling consumes excess coke — but without real-time Specific Energy Consumption (SEC) tracking, the cost bleed remains invisible until quarterly audit. In 2026, steel plants under PAT scheme (Perform, Achieve, Trade) compliance face legal penalties for missing SEC targets, while globally integrated operators compete on cost per tonne — a metric driven 8–15% by energy efficiency. The difference between a plant that monitors energy at portfolio level (total consumption) and one that tracks energy at asset level (reheating furnace, blast furnace, EAF, rolling mill) is 2–4% in controllable cost savings. OxMaint's energy dashboard integrates production data with maintenance event history, showing exactly which equipment conditions drive energy waste — and which maintenance actions recover efficiency.
Steel Plant Operations · Article ·
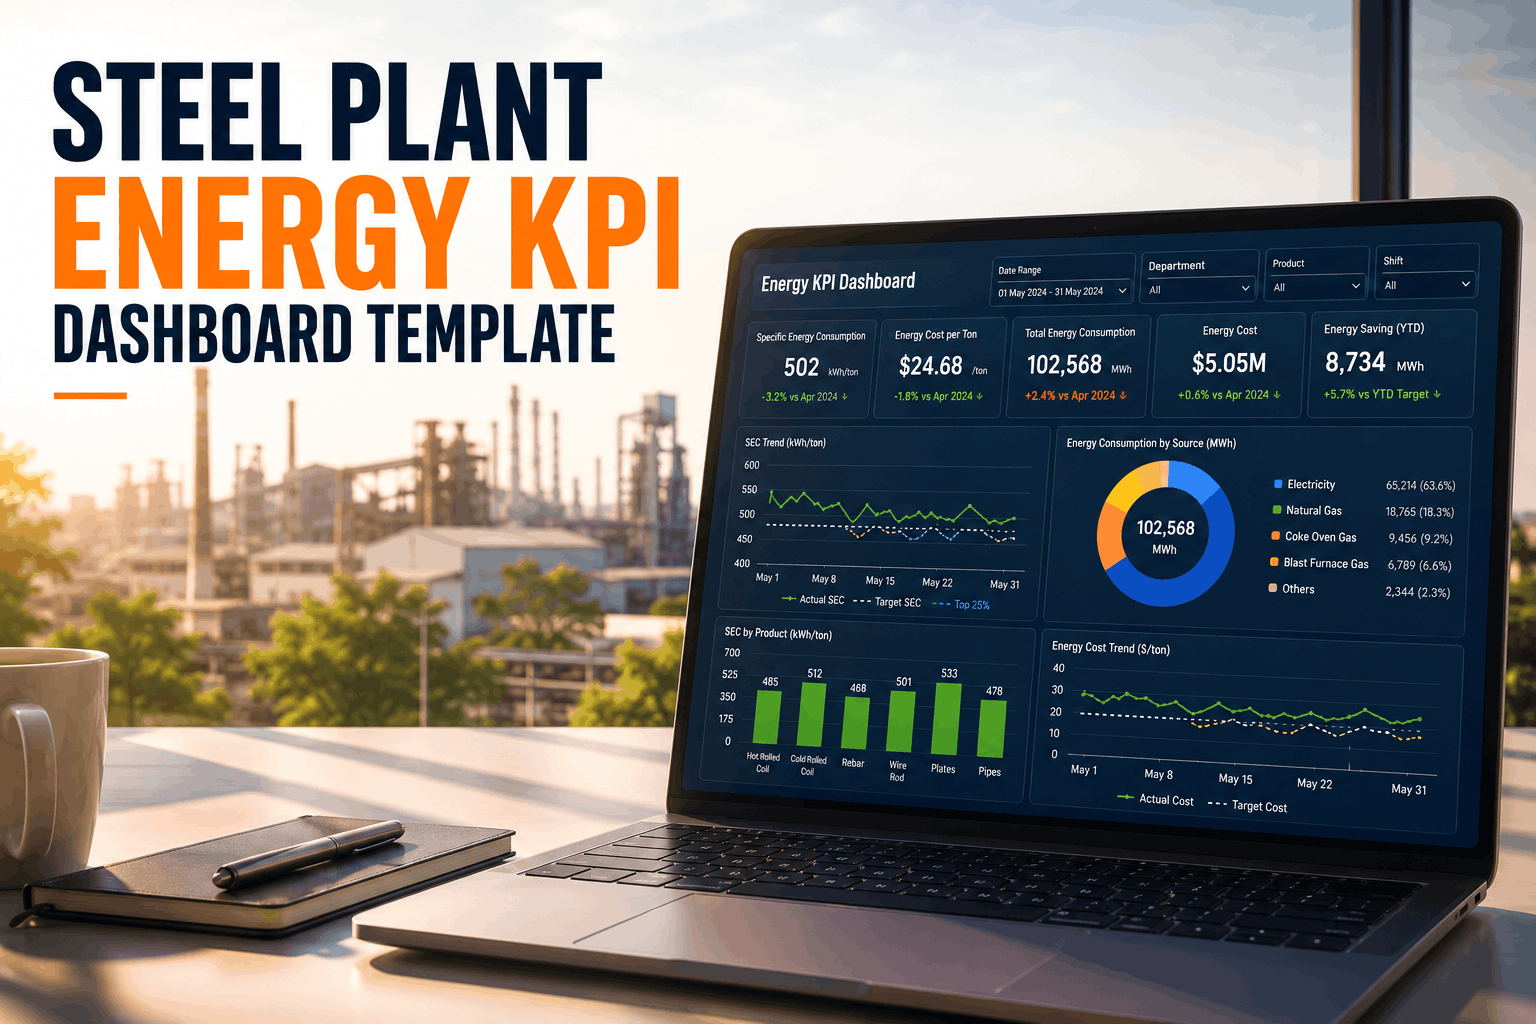
Steel Plant Energy KPI Dashboard Template
Track Specific Energy Consumption (SEC) per process unit, correlate energy consumption with maintenance events, identify equipment degradation driving energy waste, and optimize energy performance with real-time asset-level dashboards and PAT scheme compliance reporting.
15–20%Excess gas consumption in reheating furnace with degraded regenerator brick refractory
8–15%Controllable cost savings from asset-level energy monitoring vs. portfolio-level only
$1.2M–$2.8MAnnual energy cost opportunity at 300 TPD integrated steel plant from 2% SEC improvement
−18%Legal penalty for missing PAT scheme SEC targets per fiscal year under India compliance
The Energy-Maintenance Link — How One Degraded Furnace Brick Becomes $40k/Month in Wasted Energy
Energy waste in steel plants is not random. It follows a mechanical progression: equipment ages, seals fail, refractory erodes, heat losses increase, energy consumption climbs. Yet most energy managers see energy consumption as a fixed operating cost decoupled from maintenance performance. The reality: 35–45% of energy variance between similar-sized plants running similar grades is caused by maintenance-driven equipment condition differences. A reheating furnace running at design specification (all regenerator bricks intact, all heating zone seals functional) consumes X kWh per tonne. The same furnace with 20% refractory lining loss due to deferred brick replacement consumes X+18% kWh per tonne. One missing stave cooler passageway in a blast furnace costs $8k–$12k per month in excess coke and air consumption. A rolling mill with wear-degraded hydraulic system delivering below-spec pressure requires longer forming cycles, increasing electrical energy per tonne rolled. These are not energy problems — they are maintenance problems manifesting as energy cost. OxMaint links maintenance event history (when refractory was last replaced, when hydraulic system last serviced) directly to energy performance trends, showing exactly which equipment conditions drive waste and which maintenance actions recover efficiency.
Steel Plant Process Unit Energy KPIs — Key Metrics, Calculation, Monitoring Frequency
Blast Furnace SEC
kg coke + fuel gas energy / tonne hot metal
1,200–1,400 kg/t
Real-time (per charge)
Stave cooler fouling, hot blast temp control, tuyere blockage
Regenerator brick erosion, door seal condition, burner tuning
Hot Rolling Mill Energy
kWh main motor + stand motors per tonne finished product
28–38 kWh/t
Per shift (8h rolling window)
Roll/bearing wear, hydraulic pressure drops, motor efficiency
Cold Rolling Mill Energy
kWh electrical + coolant heating per tonne product
12–18 kWh/t
Per shift (8h rolling window)
Mill roll condition, backup roll wear, stand cooling system
Maintenance-Driven Energy Losses — A Root Cause Analysis Framework
Not all energy consumption variance is explainable by production schedule or product mix. Equipment condition — refractory age, seal integrity, hydraulic system wear, bearing condition — directly drives energy consumption. The root cause analysis framework below maps the three highest-impact equipment conditions to energy loss, quantifies cost per condition, and shows which maintenance intervals prevent the loss. Plants that integrate energy monitoring with maintenance KPI tracking (MTBF, PM compliance, seal inspection frequency) can identify which specific maintenance deferral is costing energy and either justify the maintenance investment with energy ROI or accept the cost consequence knowingly. OxMaint's dashboard calculates this root cause linkage automatically — flagging which equipment condition degradations correlate with energy consumption increases, and which maintenance completions correlate with energy recovery.
Hydraulic System Seal Leakage (pressure drop 2 bar under load)
+11% pump displacement needed to maintain spec pressure
$3,900/month
Hydraulic seal pack replacement (12-week interval)
Real-Time Energy Dashboard — Asset-Level Monitoring Per Furnace, Per Mill
A monthly energy report shows total consumption yesterday — useful for accounting, useless for operational decision-making. Real-time asset-level energy dashboards show energy consumption per process unit updated every 5–30 minutes, with alerts when any process deviates from baseline. If a reheating furnace jumps to +22% SEC, the shift supervisor gets an alert immediately. Operator can diagnose: is it product grade change (higher carbon steel requires more energy)? Is it outdoor temperature drop (heat losses increase in cold)? Is it furnace condition degradation (regenerator brick loss)? With real-time visibility, operational decisions can be made within the shift. Without it, the loss is discovered at month-end report and explained away as product mix. OxMaint's dashboard integrates production data (product grade, slab weight, mill speed) with energy meter data (kWh, gas consumption, coke rate) to show "energy normalized to standard conditions" — revealing true equipment efficiency degradation independent of grade or schedule variation.
Real-Time Asset Energy Feeds
Energy meters (production meters, utility metering) feed data every 1–5 minutes via OPC-UA, Modbus, or MQTT. No new meters required — integrate existing production SCADA data. Load from DCS historians (OSIsoft PI, Honeywell PHD, GE Historian).
Energy Normalization Algorithm
OxMaint automatically adjusts energy consumption for ambient temp, product grade, mill speed, production rate. Shows "energy at standard conditions" — revealing true equipment efficiency rather than operational variable noise.
Maintenance Event Correlation
When equipment goes offline for maintenance, energy KPI baseline automatically adjusts. OxMaint tracks energy before/after maintenance events — quantifying energy recovery from repairs and validating ROI on preventive maintenance.
Alert Thresholds & Performance Bands
Green band: 95–105% of baseline = normal operation. Yellow band: 105–115% = investigate. Red band: >115% = alert shift supervisor. Thresholds auto-adjust for seasonal variation and product mix changes.
PAT Scheme Compliance — SEC Calculation, ESCert Tracking, Energy Audit Documentation
India's Perform, Achieve, Trade (PAT) scheme under BEE (Bureau of Energy Efficiency) imposes binding SEC targets on 163 Designated Consumer steel units. Missing the SEC target in a 3-year cycle triggers financial penalties up to 18% of energy procurement cost. Non-compliance is not theoretical — it is legal and financial. Plants must calculate Specific Energy Consumption (TOE net energy input ÷ tonnes crude steel output) quarterly with audit-verifiable precision. Most steel plants source energy data from billing invoices, production reports, and manual logs — a process prone to 5–15% calculation error and impossible to audit. OxMaint automates PAT compliance by integrating energy meter data, production records, and maintenance events into a single auditable calculation. SEC is computed continuously (updated daily or weekly) rather than at audit deadline. When SEC drifts above target, OxMaint flags the gap immediately, giving plant managers 6+ months to execute energy recovery projects instead of discovering non-compliance at year-end.
PAT Scheme Timeline & Compliance Deliverables — FY 2025–26 Cycle
Baseline Year Q1–Q4 (FY 2023–24)
Establish SEC baseline & baseline energy consumption. Required: audit-verified energy data (BEE proforma). OxMaint captures all sources in unified system.
Baseline SEC established with audit trail
Target-Setting Meeting (Oct 2024)
BEE notifies plant of SEC reduction target (typically 1–3% per year for 3-year cycle). Plant confirms acceptance or appeals. OxMaint tracks target vs. actual from baseline.
If SEC heading above target, plant has 6+ months to execute catch-up projects. OxMaint quantifies energy impact of pending maintenance, helping prioritize work.
Early warning enables compliance recovery
Year-End Verification & Audit (Mar 2026)
BEE auditor reviews SEC calculation. OxMaint generates audit-ready report: energy meter data, production data, maintenance event history, SEC trend with variance analysis. All data linked to source systems.
SEC compliance verified, ESCert issued or penalty assessed
Frequently Asked Questions
What is Specific Energy Consumption (SEC) and why does it matter?
SEC is energy consumed per unit of output (e.g., kWh per tonne steel or gas per tonne reheated). It isolates energy efficiency from production volume — a plant can reduce total consumption by slowing down, but SEC shows if equipment is operating efficiently. PAT scheme targets are SEC-based, not total consumption.
How does OxMaint normalize energy consumption for grade and schedule variations?
OxMaint integrates production data (product grade, thickness, speed) with energy metering. It adjusts energy for known operational variables — high-carbon steel requires more refining energy, thicker slabs require more reheating — to show "standard-condition energy" that reveals true equipment efficiency independent of product mix.
Which maintenance intervals most directly impact energy consumption?
Refractory replacement (15–20% energy impact), stave cooler cleaning (12% impact), bearing replacement (9% impact), hydraulic seal replacement (11% impact), electrode carbon replacement (14% impact). OxMaint tracks energy before/after maintenance to quantify ROI.
How does OxMaint help with PAT scheme compliance?
OxMaint calculates SEC continuously from unified energy meter data, production records, and maintenance history. SEC is updated daily/weekly, not at audit deadline. When trending above PAT target, the system flags gap early, giving 6+ months for corrective energy projects instead of discovering non-compliance at year-end.
What data sources can OxMaint integrate for energy monitoring?
Existing SCADA historians (OSIsoft PI, Honeywell PHD, GE Historian), production meters, utility metering systems via OPC-UA, Modbus, or MQTT. No new meters required — OxMaint wraps existing infrastructure into unified analytics. Typical deployment takes 4–6 weeks from connection to live dashboard.
Can OxMaint identify which equipment degradation is causing energy waste?
Yes. OxMaint correlates energy consumption trends with maintenance event history. If energy jumps 15% and a reheating furnace brick replacement was deferred, the system flags the correlation. This quantifies ROI on maintenance and enables cost-benefit decision-making on deferred work.
How often should energy KPIs be reviewed by shift supervisors?
Real-time dashboards should be visible on the shift floor — asset-level energy updated every 5–30 minutes with color-coded alert bands (green/yellow/red). Shift supervisor is alerted immediately if any process deviates >15% from baseline, enabling same-shift operational diagnosis and correction.
Monitor Energy at Asset Level — Link Energy Waste to Maintenance Decisions in Real Time.
OxMaint's energy dashboard tracks SEC per furnace per mill, correlates energy consumption with maintenance events, and automates PAT scheme compliance — identifying exactly which equipment degradation costs energy and which maintenance actions recover efficiency.
.png)