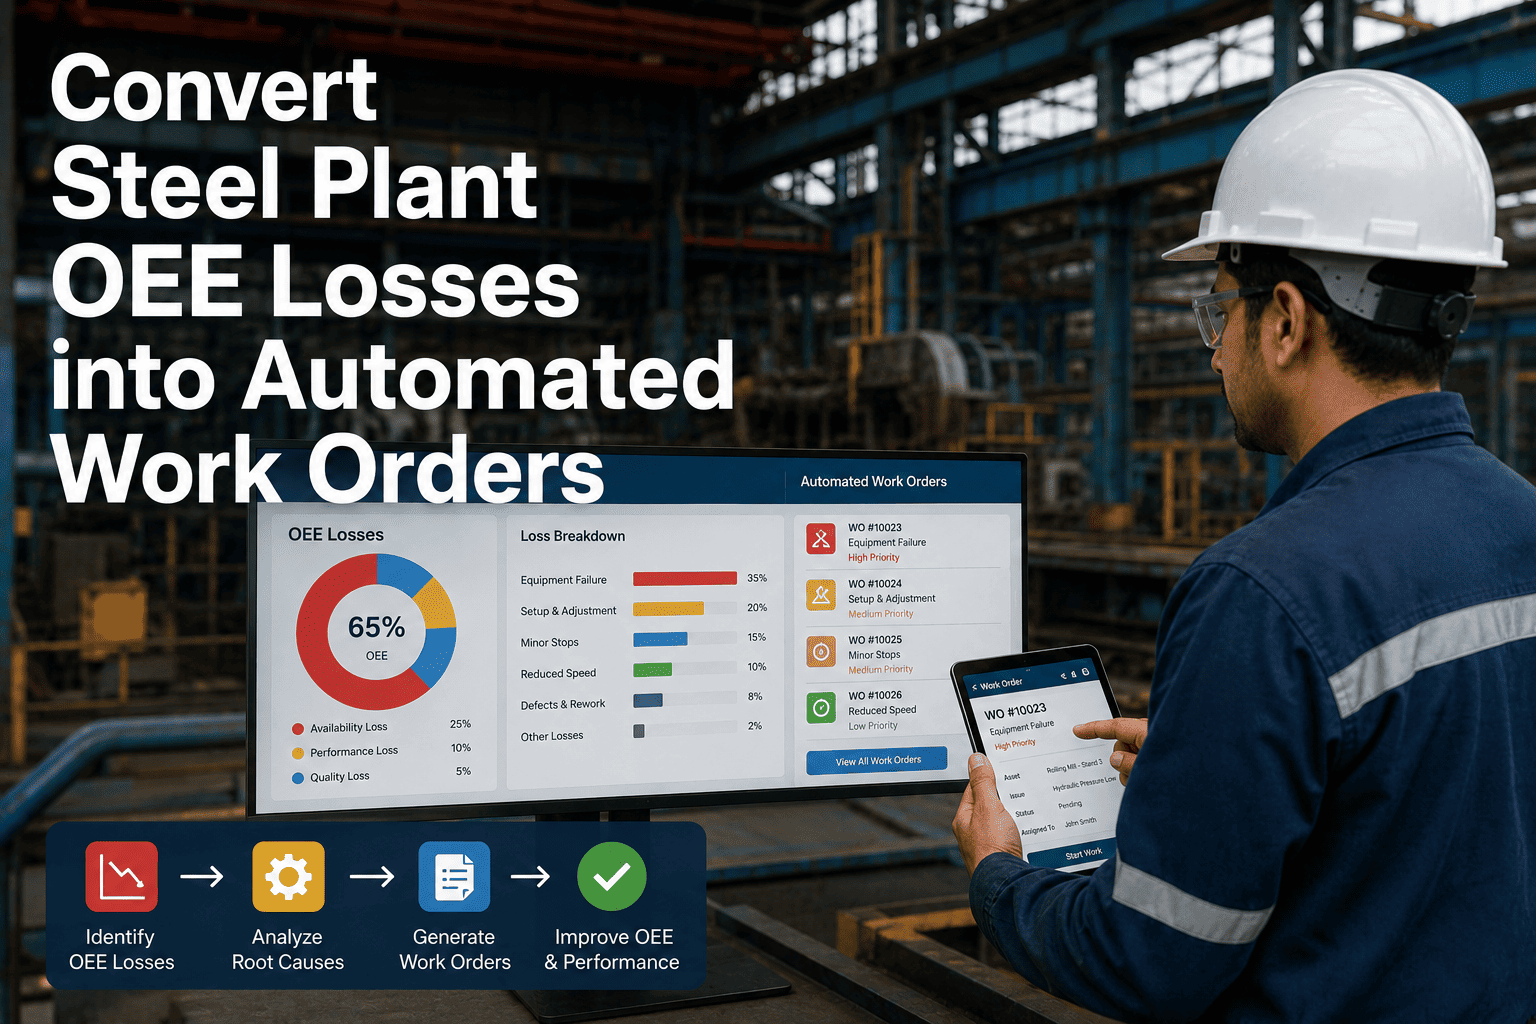
In 2026, steel plants operate at an average OEE of 45-65%, leaving millions in unrealized production capacity every year. The gap between your plant's current performance and world-class OEE (78-92%) traces directly to the Six Big Losses—equipment failures, setup losses, minor stoppages, reduced speed, process defects, and reduced yield. Sign Up Free to replace static Excel OEE loss tree templates with OxMaint's real-time loss tracking and automated corrective action workflows — capturing every production loss at point of occurrence across your blast furnace, caster, and rolling mills.
Transform Raw Downtime Data Into Structured Loss Trees — OEE Improvement at Scale
OxMaint auto-classifies every equipment failure, setup delay, speed loss, and quality rejection into the Six Big Losses framework — building a living OEE loss tree that surfaces root causes and prioritizes highest-impact improvement projects.
The Six Big Losses: What Your Steel Plant OEE Loss Tree Must Capture
Equipment Failures, Setup Losses & More — Real-World Steel Plant Impact
73 hrs
Single bearing failure cost one midwest mill in Q2 2025
$50B/yr
Unplanned stoppages cost US manufacturing sector annually
75%
OEE uplift achieved by Hutchinson Group across 40 plants
2-3
Loss categories typically account for 70-80% of total OEE loss
Six Big Losses Explained: Steel Plant Loss Tree Components
Availability, Performance & Quality — Mapped to Real Production Failures
| Six Big Loss Category |
OEE Factor |
Steel Plant Example |
Typical Causes |
| Equipment Failure |
Availability |
Caster bearing failure, furnace burner shutdown, conveyor jam |
Inadequate lubrication, worn parts, electrical fault, reactive maintenance |
| Setup & Adjustment Loss |
Availability |
Slab mill changeover (grade, thickness, width), roll change |
Unstructured changeover procedures, operator training gaps, missing guides |
| Minor Stoppages |
Performance |
Temporary jams, sensor blockages, hydraulic pressure dips, operator interventions |
Lack of autonomous maintenance, missing preventive checks, operator inexperience |
| Reduced Speed |
Performance |
Furnace running below target temp, caster running at 60% nameplate, rolling stand at reduced speed |
Outdated control settings, worn machinery, product quality constraints, insufficient capacity margin |
| Process Defects |
Quality |
Surface defects, dimensional variation, segregation, incorrect chemistry in coil |
Control drift, worn tooling, operator technique drift, incomplete temperature ramp-down |
| Reduced Yield (Startup) |
Quality |
First coil scrap after restart, ramp-up rejects on furnace cold-start, caster warm-up losses |
Long cold-start sequences, insufficient warm-up discipline, unstable initial conditions |
How OxMaint Replaces Static OEE Loss Tree Excel Templates with Live Data
From Manual Spreadsheets to Real-Time Loss Classification & Root Cause Trees
Loss Classification
Auto-Classified Six Big Losses
Every downtime event, speed deviation, and quality rejection automatically maps to correct loss category using configurable reason code trees — no manual categorization, 100% consistency.
Real-Time Dashboards
Live OEE Loss Tree by Equipment
Watch your OEE loss tree update in real time — Availability, Performance, Quality broken down to Six Big Losses across blast furnace, caster, and rolling lines with color-coded loss contributors.
Root Cause Workflows
Drill Down to Root Cause
Click any loss category and drill into detailed loss tree — timestamp, duration, operator notes, photos — with linked corrective action assignments and outcome tracking.
Loss Prioritization
Pareto Ranking by Hours Lost
OxMaint ranks your Six Big Losses by total hours lost over 4-week rolling window — focus improvement teams on top 2-3 loss drivers that represent 70-80% of OEE gap.
Monthly Reviews
Structured OEE Loss Tree Review
Use OxMaint's loss tree monthly for tactical project prioritization and quarterly for structural updates — export structured PDF loss trees with trend analysis for management reviews.
Multi-Site Comparison
Benchmark Across Blast Furnaces
Compare OEE loss trees across multiple blast furnaces, casters, and rolling lines — equipment-specific loss patterns highlight which assets need deepest improvement focus first.
Improvement Tracking
Connect Losses to Corrective Actions
Every loss event triggers optional corrective action workflows with status tracking — measure how many losses repeat, validate intervention effectiveness, and quantify OEE recovery.
Integration
PLC/SCADA Data Auto-Capture
OxMaint integrates with PLC/SCADA systems, production counters, and operator logs to calculate real-time OEE automatically — eliminating manual data collection and ensuring accuracy.
Why Steel Plants Fail With Excel OEE Loss Tree Templates
Static Spreadsheets Miss Real-Time Loss Signals — Here's the Cost
01
Minor Stoppages Go Completely Unrecorded
Excel loss trees capture only major downtime. Those 5-minute jams, sensor blockages, and operator interventions that happen 20-30 times per shift are never logged — yet they represent 30-40% of true performance loss in most steel plants.
02
Inconsistent Loss Categorization Ruins Benchmarking
Without automated reason code trees, technicians categorize losses differently — one engineer calls a speed dip "reduced performance," another codes it as "minor stoppage." Your loss tree becomes unreliable for shift-to-shift comparisons or equipment-to-equipment benchmarking.
03
Loss Tree Aging — Outdated Root Causes Persist
Excel templates rarely get updated quarterly as equipment changes and new failure modes emerge. You continue focusing improvement efforts on outdated Six Big Loss patterns while new loss drivers go undetected for months.
04
No Corrective Action Link — Losses Repeat Endlessly
Excel loss trees record what happened but have no mechanism to assign and track corrective actions. The same bearing failure occurs, gets categorized, and then repeats 6 months later because there's no closed-loop improvement system.
05
Manual Data Entry Delays Create Stale Loss Trees
Technicians return from the floor 2-3 hours later to manually enter loss data. By then, context is lost, details are missed, and the loss tree reflects yesterday's reality — not today's urgent OEE drivers.
Steel Plant OEE Loss Tree Deployment Results
Measurable Outcomes from OxMaint Loss Tree Rollouts
OEE Improvement Benchmarks from Digital Loss Tree Deployments
Reduction in Equipment Failure Loss (Availability)
Reduction in Minor Stoppage Hours (Performance)
Reduction in Process Defects (Quality Loss)
Cycle Time for OEE Loss Tree Updates (Monthly to Real-Time)
Improvement Action Closure Rate (Loss → Corrective Action → Resolution)
Build Your OEE Loss Tree in OxMaint: Four Steps
From First Loss Event to Actionable Loss Tree Dashboard
Step 1 — Configure Loss Categories
Set up your Six Big Losses framework in OxMaint with equipment-specific reason code trees. Define how each downtime event, speed deviation, and quality rejection maps to Availability, Performance, or Quality factors.
Step 2 — Connect Data Sources
Integrate your PLC/SCADA systems, production counters, and operator inputs to OxMaint. Enable automatic loss event capture from furnace thermocouples, caster sensors, rolling stand feedback, and operator logged interventions.
Step 3 — Launch OEE Dashboards
Start capturing OEE data immediately. Watch real-time dashboards show Availability, Performance, Quality scores alongside Six Big Losses breakdown — no retrospective analysis required, losses populate as they occur.
Step 4 — Pareto Rank & Act
OxMaint ranks losses by hours lost over 4-week windows. Form improvement teams to focus on the top 2-3 loss contributors that drive 70-80% of your OEE gap, with assigned corrective actions and outcome tracking.
Monthly Loss Tree Review
Conduct structured monthly OEE loss tree reviews with your operations and maintenance teams. Export Pareto-ranked loss trees as PDFs, identify repeat failures, and validate corrective action effectiveness quarterly.
Multi-Equipment Benchmarking
Compare OEE loss trees across blast furnaces, casters, and rolling stands to identify underperforming equipment and best-practice assets. Use equipment-specific loss patterns to customize maintenance and operations strategies.
Manufacturing plants that transition from static Excel OEE loss tree templates to OxMaint typically see OEE improvement of 8-15 percentage points within the first six months, driven entirely by structured loss identification and focused corrective action. The platform captures everything required for an industrial-strength loss tree — timestamp, duration, loss category, equipment, operator, root cause notes, photos — automatically at point of occurrence. Sign Up Free to build your first digital OEE loss tree today with no setup fees.
For multi-furnace steel plants requiring Six Big Loss implementation across all lines simultaneously, schedule a guided demo to walk through equipment hierarchy configuration, loss reason code tree customization, and PLC/SCADA integration with our product engineering team.
Start With OEE Loss Tree Data Today — Free Plan Includes Real-Time Loss Tracking
OxMaint's free tier gives you immediate access to loss tree dashboards, Six Big Loss classification, and Pareto ranking across all equipment — no credit card, no setup fee, first loss event logged within minutes.
What Steel Plant Leaders Say About OxMaint OEE Loss Trees
Customer Review: Real Impact from Live Loss Tree Deployments
We were running our continuous caster off a shared Excel workbook that got updated once per shift — at best. Minor stoppages were completely invisible, so our OEE reports always looked better than floor reality. After deploying OxMaint, we discovered that 42% of our performance loss came from unlogged 3-5 minute jams and sensor resets that nobody was categorizing. Within 4 months, focused improvement teams eliminated half of those events by upgrading sensor filtering. Our OEE jumped from 58% to 71%, and we finally had a real loss tree showing what was actually costing us. The PLC integration was seamless, and our operators immediately understood the automated loss classification — no more arguments about which category a failure belonged to.
— Operations Director, Midwest Steel Mill (Continuous Caster Division)
Frequently Asked Questions: Steel Plant OEE Loss Trees
What is an OEE loss tree and why do steel plants need one?
An OEE loss tree is a structured framework that breaks down all production losses into the Six Big Losses — equipment failure, setup time, minor stoppages, reduced speed, process defects, and startup yield loss. Steel plants use it to identify which losses represent the biggest OEE gap and prioritize improvement efforts accordingly.
How is OxMaint's digital loss tree different from an Excel template?
OxMaint captures loss data in real time at point of occurrence with automatic PLC/SCADA integration, while Excel templates require manual, delayed data entry. OxMaint's loss trees update live with true Six Big Loss classification, whereas Excel templates capture only major downtime and miss minor stoppages (30-40% of performance loss).
Can OxMaint integrate with our blast furnace and caster SCADA systems?
Yes. OxMaint integrates with PLC/SCADA systems to auto-capture production data, downtime events, speed deviations, and quality rejections. The platform then automatically classifies each event into the correct Six Big Loss category using your configured reason code trees.
How does OxMaint handle equipment-specific loss tree variations?
OxMaint allows you to customize reason code trees at the equipment level — a blast furnace has different failure modes than a rolling mill. The top levels (OEE factors and Six Big Losses) stay consistent for roll-up reporting, but lower levels adapt to each asset's unique equipment characteristics.
How often should we review and update our OEE loss tree?
Conduct tactical monthly reviews to prioritize improvement projects based on current loss Pareto rankings. Perform quarterly structural reviews to update reason codes and loss tree categories if equipment changes, new products are introduced, or loss patterns shift significantly.
Does OxMaint export loss trees for audits or management reviews?
OxMaint generates structured PDF loss tree reports on demand with Pareto rankings, trend analysis by loss category, and time-series charts. Export options include detailed loss event listings, summarized loss tree hierarchies, and comparative benchmarks across multiple pieces of equipment.
How does OxMaint connect loss events to corrective actions?
When a loss event is recorded, OxMaint flags it for optional corrective action assignment. You can link maintenance tasks, engineering improvements, or operator training directly to loss events, track closure status, and measure whether the same loss recurs after intervention.
Can I use OxMaint's loss trees to benchmark across multiple steel plants?
Yes. OxMaint supports multi-site deployment with consolidated OEE and loss tree dashboards. Compare Six Big Loss patterns across blast furnaces, casters, and rolling lines at different locations — identify which assets need deepest improvement focus based on equipment-specific loss profiles.
Build Your Steel Plant OEE Loss Tree in Days, Not Months
OxMaint replaces manual loss tree templates with automated real-time Six Big Loss classification — capture every failure, speed deviation, and quality rejection at point of occurrence across all equipment.
In 2026, steel plants operate at an average OEE of 45-65%, leaving millions in unrealized production capacity every year. The gap between your plant's current performance and world-class OEE (78-92%) traces directly to the Six Big Losses—equipment failures, setup losses, minor stoppages, reduced speed, process defects, and reduced yield. Sign Up Free to replace static Excel OEE loss tree templates with OxMaint's real-time loss tracking and automated corrective action workflows — capturing every production loss at point of occurrence across your blast furnace, caster, and rolling mills.
Transform Raw Downtime Data Into Structured Loss Trees — OEE Improvement at Scale
OxMaint auto-classifies every equipment failure, setup delay, speed loss, and quality rejection into the Six Big Losses framework — building a living OEE loss tree that surfaces root causes and prioritizes highest-impact improvement projects.
The Six Big Losses: What Your Steel Plant OEE Loss Tree Must Capture
Equipment Failures, Setup Losses & More — Real-World Steel Plant Impact
73 hrs
Single bearing failure cost one midwest mill in Q2 2025
$50B/yr
Unplanned stoppages cost US manufacturing sector annually
75%
OEE uplift achieved by Hutchinson Group across 40 plants
2-3
Loss categories typically account for 70-80% of total OEE loss
Six Big Losses Explained: Steel Plant Loss Tree Components
Availability, Performance & Quality — Mapped to Real Production Failures
| Six Big Loss Category |
OEE Factor |
Steel Plant Example |
Typical Causes |
| Equipment Failure |
Availability |
Caster bearing failure, furnace burner shutdown, conveyor jam |
Inadequate lubrication, worn parts, electrical fault, reactive maintenance |
| Setup & Adjustment Loss |
Availability |
Slab mill changeover (grade, thickness, width), roll change |
Unstructured changeover procedures, operator training gaps, missing guides |
| Minor Stoppages |
Performance |
Temporary jams, sensor blockages, hydraulic pressure dips, operator interventions |
Lack of autonomous maintenance, missing preventive checks, operator inexperience |
| Reduced Speed |
Performance |
Furnace running below target temp, caster running at 60% nameplate, rolling stand at reduced speed |
Outdated control settings, worn machinery, product quality constraints, insufficient capacity margin |
| Process Defects |
Quality |
Surface defects, dimensional variation, segregation, incorrect chemistry in coil |
Control drift, worn tooling, operator technique drift, incomplete temperature ramp-down |
| Reduced Yield (Startup) |
Quality |
First coil scrap after restart, ramp-up rejects on furnace cold-start, caster warm-up losses |
Long cold-start sequences, insufficient warm-up discipline, unstable initial conditions |
How OxMaint Replaces Static OEE Loss Tree Excel Templates with Live Data
From Manual Spreadsheets to Real-Time Loss Classification & Root Cause Trees
Loss Classification
Auto-Classified Six Big Losses
Every downtime event, speed deviation, and quality rejection automatically maps to correct loss category using configurable reason code trees — no manual categorization, 100% consistency.
Real-Time Dashboards
Live OEE Loss Tree by Equipment
Watch your OEE loss tree update in real time — Availability, Performance, Quality broken down to Six Big Losses across blast furnace, caster, and rolling lines with color-coded loss contributors.
Root Cause Workflows
Drill Down to Root Cause
Click any loss category and drill into detailed loss tree — timestamp, duration, operator notes, photos — with linked corrective action assignments and outcome tracking.
Loss Prioritization
Pareto Ranking by Hours Lost
OxMaint ranks your Six Big Losses by total hours lost over 4-week rolling window — focus improvement teams on top 2-3 loss drivers that represent 70-80% of OEE gap.
Monthly Reviews
Structured OEE Loss Tree Review
Use OxMaint's loss tree monthly for tactical project prioritization and quarterly for structural updates — export structured PDF loss trees with trend analysis for management reviews.
Multi-Site Comparison
Benchmark Across Blast Furnaces
Compare OEE loss trees across multiple blast furnaces, casters, and rolling lines — equipment-specific loss patterns highlight which assets need deepest improvement focus first.
Improvement Tracking
Connect Losses to Corrective Actions
Every loss event triggers optional corrective action workflows with status tracking — measure how many losses repeat, validate intervention effectiveness, and quantify OEE recovery.
Integration
PLC/SCADA Data Auto-Capture
OxMaint integrates with PLC/SCADA systems, production counters, and operator logs to calculate real-time OEE automatically — eliminating manual data collection and ensuring accuracy.
Why Steel Plants Fail With Excel OEE Loss Tree Templates
Static Spreadsheets Miss Real-Time Loss Signals — Here's the Cost
01
Minor Stoppages Go Completely Unrecorded
Excel loss trees capture only major downtime. Those 5-minute jams, sensor blockages, and operator interventions that happen 20-30 times per shift are never logged — yet they represent 30-40% of true performance loss in most steel plants.
02
Inconsistent Loss Categorization Ruins Benchmarking
Without automated reason code trees, technicians categorize losses differently — one engineer calls a speed dip "reduced performance," another codes it as "minor stoppage." Your loss tree becomes unreliable for shift-to-shift comparisons or equipment-to-equipment benchmarking.
03
Loss Tree Aging — Outdated Root Causes Persist
Excel templates rarely get updated quarterly as equipment changes and new failure modes emerge. You continue focusing improvement efforts on outdated Six Big Loss patterns while new loss drivers go undetected for months.
04
No Corrective Action Link — Losses Repeat Endlessly
Excel loss trees record what happened but have no mechanism to assign and track corrective actions. The same bearing failure occurs, gets categorized, and then repeats 6 months later because there's no closed-loop improvement system.
05
Manual Data Entry Delays Create Stale Loss Trees
Technicians return from the floor 2-3 hours later to manually enter loss data. By then, context is lost, details are missed, and the loss tree reflects yesterday's reality — not today's urgent OEE drivers.
Steel Plant OEE Loss Tree Deployment Results
Measurable Outcomes from OxMaint Loss Tree Rollouts
OEE Improvement Benchmarks from Digital Loss Tree Deployments
Reduction in Equipment Failure Loss (Availability)
-
May 22, 2026
- By Alex Jordan

.png)
-justification-template.png)