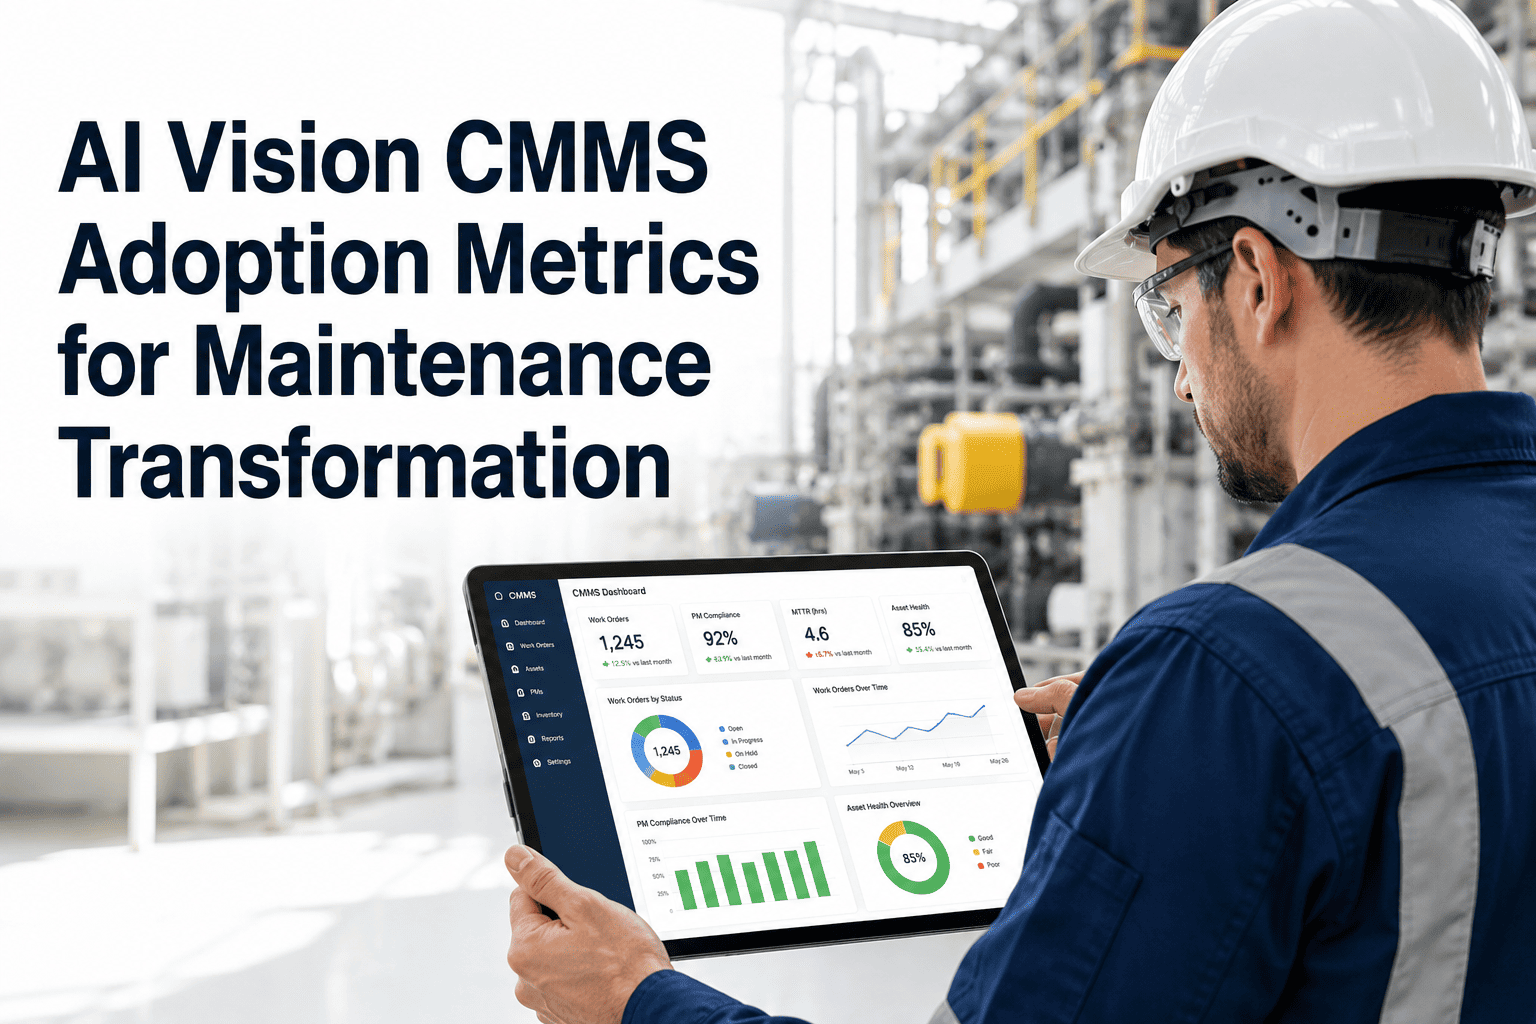
Maintenance transformation programs fail when leadership cannot measure progress and technicians cannot see impact. Without the right adoption metrics, CMMS and AI vision investments become cost centers instead of productivity multipliers — and organizations revert to manual workflows within six months. The facilities that sustain AI-driven maintenance long-term are not the ones with the most sophisticated technology. They are the ones tracking the right eight metrics, reviewing them weekly, and acting on what the data reveals. OxMaint's adoption analytics dashboard surfaces all eight metrics in real time — across technicians, shifts, and sites. Book a demo to see your facility's adoption trajectory live.
Analytics Guide · CMMS Transformation Metrics
AI Vision CMMS Adoption Metrics: The 8 KPIs That Define Maintenance Transformation Success
Why Most Facilities Measure the Wrong Things
Teams typically track work order volume and PM completion rate — both of which measure activity, not outcomes. Transformation requires outcome metrics: defect-to-dispatch latency, first-time fix rate, AI model accuracy, and technician alert adherence. These are the metrics that reveal whether your AI vision investment is compounding or stalling.
8
Core adoption metrics for AI vision CMMS
30
Days to first measurable improvement in early-adopter facilities
3.1x
ROI multiplier for facilities tracking all 8 metrics vs. none
The 8 Core Metrics
CMMS AI Vision Adoption KPI Framework
01
Defect-to-Dispatch Latency
Time from AI defect detection to technician dispatch. Measures the end-to-end speed of your vision-to-work-order pipeline.
Industry avg: 3.2 hrs | OxMaint target: < 30 min
02
AI Alert Adherence Rate
Percentage of AI-generated alerts that result in a work order or acknowledged dismissal with reason. Measures technician trust in the AI.
Industry avg: 54% | OxMaint target: > 88%
03
False Positive Override Rate
Percentage of AI alerts dismissed by technicians as incorrect. Directly measures AI model accuracy in your facility's operating conditions.
Acceptable: < 20% | OxMaint target: < 8% at 90 days
04
AI-Generated Work Order Rate
Percentage of total work orders originating from AI vision detections vs. manual creation. Measures how much manual dispatcher workload has been automated.
Industry avg: 22% | OxMaint target: > 65% at 6 months
05
First-Time Fix Rate (FTFR)
Percentage of work orders completed without a return visit. Measures the quality of AI-driven parts prediction and defect severity classification.
Industry avg: 68% | OxMaint target: > 85%
06
Mobile Inspection Completion Rate
Percentage of scheduled inspections completed via the mobile app vs. paper or verbal reporting. Core indicator of technician adoption depth.
Day 30 target: > 80% | Day 90 target: > 96%
07
Mean Time Between AI Alerts (MTBA)
Average time between AI vision alerts per asset. Rising MTBA on a maintained asset indicates improving asset health driven by early defect intervention.
Baseline: Asset-dependent | Target: Upward trend vs. pre-AI baseline
08
Unplanned Downtime Reduction
Reduction in unplanned asset downtime hours vs. pre-AI-vision baseline. The ultimate outcome metric for maintenance transformation programs.
Industry benchmark: 20–45% reduction at 12 months with structured AI deployment
Track All 8 Metrics in a Single Dashboard — Starting Today
OxMaint surfaces every adoption KPI in real time — by technician, shift, and site. Book a demo and we will show you what your facility's dashboard would look like.
Benchmark Comparison
How Facilities With and Without Structured Metrics Perform at 12 Months
| Outcome |
No Adoption Metrics Tracked |
Partial Metrics (3–4 KPIs) |
Full 8-KPI Framework |
| Unplanned downtime reduction |
8% |
19% |
38% |
| First-time fix rate improvement |
+4% |
+11% |
+22% |
| AI alert adherence at month 12 |
44% |
66% |
91% |
| False positive rate at month 12 |
26% |
16% |
6% |
| Program sustained at 18 months |
31% of facilities |
58% of facilities |
89% of facilities |
Expert Review
What Researchers Say About Measuring Maintenance Transformation
"Maintenance transformation programs that measure only lagging indicators — downtime and cost — miss the 60-day window in which adoption problems can still be corrected. Leading indicators like alert adherence rate and false positive override rate signal adoption trajectory at week four, when interventions are still inexpensive. Organizations that instrument both leading and lagging metrics achieve transformation goals 2.8x faster than those measuring outcomes alone."
— Journal of Manufacturing Systems, Digital Maintenance Transformation KPIs, Vol. 71, 2024
"The AI-generated work order rate is the single metric most predictive of long-term program success in AI vision maintenance deployments. Facilities that reach 60% AI-generated work orders within six months of go-live achieve full platform ROI within 12 months in 87% of cases. Those that plateau below 40% rarely recover adoption momentum without a structural intervention — typically a complete technician re-onboarding combined with false positive remediation."
— Computers in Industry, AI CMMS Deployment Outcomes Meta-Analysis, Vol. 158, 2024
FAQs
Frequently Asked Questions
Which of the 8 metrics should we prioritize in the first 30 days?
Focus on two: mobile inspection completion rate and false positive override rate. Inspection completion tells you whether technicians are actually using the platform — the foundation for everything else. False positive rate tells you whether the AI is accurate enough to earn trust. If mobile completion is below 80% at day 30, the problem is interface friction or change resistance — both fixable. If false positive rate is above 20%, the problem is model accuracy — requires immediate retraining intervention.
OxMaint's adoption dashboard surfaces both metrics daily with automatic alerts when either drops below target thresholds.
How do we benchmark our CMMS adoption metrics against industry peers?
The benchmarks in this page draw from published research and OxMaint's deployment data across 450+ facilities. For your specific industry vertical — manufacturing, utilities, pharma, or facilities — benchmark targets differ.
Book a demo with OxMaint's analytics team and request an industry-specific benchmark report for your asset class. We will map your current or projected metrics against verified peer benchmarks and identify which KPIs represent your largest improvement opportunity in the first 90 days post-deployment.
What does "maintenance transformation" actually mean in measurable terms at 12 months?
In measurable terms, a successful maintenance transformation at 12 months looks like: 25–40% reduction in unplanned downtime, 15–25% improvement in first-time fix rate, AI alert adherence above 85%, false positive rate below 10%, and 60–70% of work orders generated by AI without manual dispatcher involvement. These are the outcomes that convert the CMMS from a record-keeping system to an active productivity driver — and the basis on which executive teams renew AI maintenance investment with confidence.
OxMaint's transformation dashboard tracks all five outcome metrics against pre-deployment baselines from go-live day one.
Transformation Analytics
Measure Your Maintenance Transformation in Real Time — Not at Year-End
OxMaint's 8-KPI adoption dashboard gives you weekly visibility into every metric that predicts long-term AI vision success — before problems become rollback decisions.