Every cement plant knows its downtime number. Far fewer can say which three assets caused half of it, or which failure mode keeps coming back. That gap is the whole problem — you cannot reduce downtime you have only measured in total. Asset-level, failure-mode analysis breaks the number apart: it shows where the hours actually go, what they cost in lost clinker and cement, and which fixes move the needle. This guide walks that analysis and how to run it in OXMAINT AI, or book a demo of cement reliability analytics.
CEMENT PLANT · DOWNTIME ANALYSIS · RELIABILITY · 2027
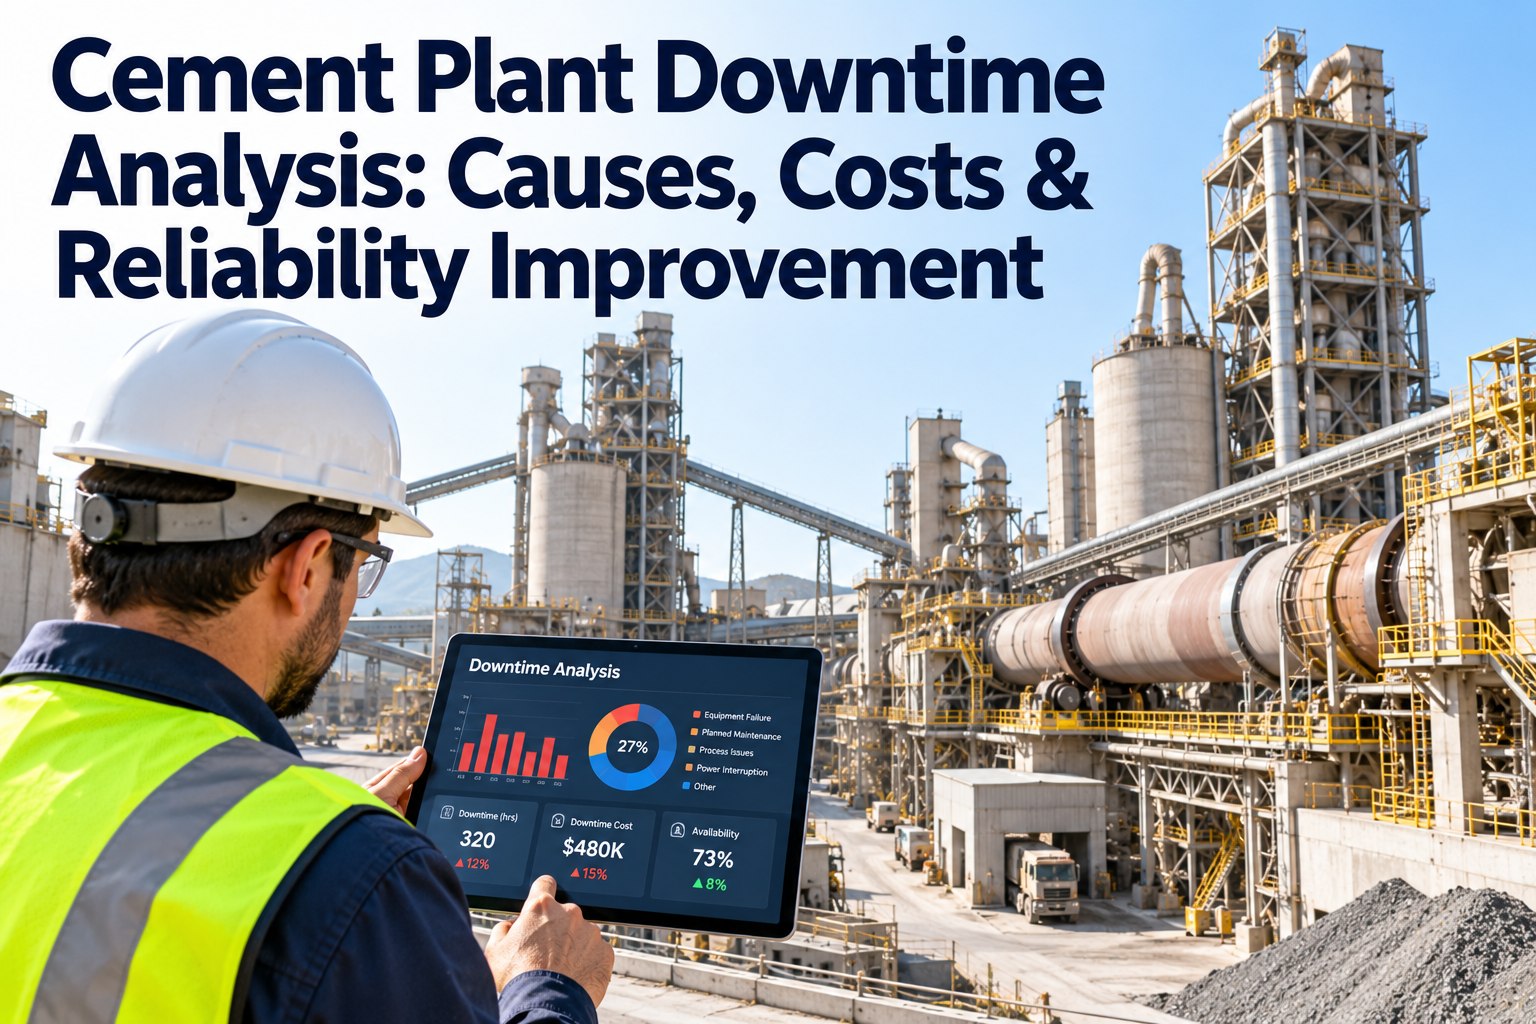
Cement Plant Downtime Analysis: Causes, Costs & Reliability Improvement
A total downtime figure tells you that you have a problem. It never tells you where. OXMAINT AI breaks downtime down by asset and failure mode, puts a cost on each stop, and turns the worst offenders into predictive maintenance work orders — so the analysis ends in a fix, not a report.
Where the hours go
Kiln & preheater
Raw & cement mills
Crusher
Cooler & fans
Packing & dispatch
A few assets carry most of the loss — illustrative
Not All Downtime Is Equal
The single most useful move in downtime analysis is to stop treating every stoppage the same. A Pareto view almost always shows that a handful of assets and a handful of failure modes account for the majority of lost hours. Rank them, and the maintenance plan writes its own priorities. Start free and rank your downtime by asset in OXMAINT AI.
The Vital Few
A small set of assets and failure modes drives most of the downtime. This is where reliability effort pays back fastest — one fix removes many hours.
The Trivial Many
A long tail of small, scattered stops. Worth tidying, but chasing these first is effort spread thin while the big losses keep repeating.
Where Cement Downtime Comes From
Cement is a continuous process, so a stop anywhere starves everything downstream. Analysis starts by attributing each stop to the right asset — these are the usual heavy hitters and how they fail.
Kiln & Preheater
Refractory wear, coating and ring build-up, burner and cyclone blockage, seal and drive faults. The highest-cost stop — a kiln restart is slow and expensive.
Raw & Cement Mills
Liner and grinding-media wear, gearbox and bearing failure, separator and mill-fan issues. High-tonnage assets where a stop cuts output sharply.
Crusher
Hammer, liner and bearing wear, tramp-metal jams, feed blockage. Starves the whole line if it stops and the stockpile runs low.
Clinker Cooler & Fans
Grate and drive wear, fan and damper faults, snowman build-up. Drags kiln stability and heat recovery when degraded.
Conveyors & Material Handling
Belt, idler and chute wear, misalignment, blockages. Frequent small stops that add up across the plant.
Packing & Dispatch
Packer, rotary-valve and loading faults. Lower cost per stop, but they throttle shipment when they recur.
Then by Failure Mode
Attributing a stop to an asset is only half the analysis. The failure mode — why it stopped — is what tells you which maintenance strategy will actually prevent it.
Failure Mode
Typical Signature
The Strategy That Prevents It
Wear & erosion
Gradual, predictable loss of liners, media, grates
Condition-based inspection + scheduled replacement
Bearing / gearbox
Rising vibration and temperature before seizure
Vibration baselines + predictive alerts
Refractory / coating
Shell hot-spots, build-up, ring formation
Shell scanning + planned reline in shutdowns
Blockage / jam
Sudden flow stop, tramp metal, build-up
Process monitoring + detection + clearing SOP
Electrical / instrument
Trips, drive faults, sensor failures
PM on protection + instrument calibration
This grid scrolls sideways on a phone. The failure mode, not just the asset, decides whether the right answer is a PM, a predictive sensor or a process fix — which OXMAINT AI assigns automatically.
Putting a Cost on the Hours
Downtime only drives decisions once it is money. The calculation is simple, and it is what turns a reliability case into a budget approval.
×
Lost Production
Downtime hours × throughput (t/h) × margin per tonne of clinker or cement.
+
Repair Cost
Labor, spare parts and contractor cost to make the fix, especially on an emergency basis.
+
Restart & Quality
Fuel and time to restart a kiln, plus off-spec product made during ramp-up.
+
Knock-On
Idle downstream assets, missed dispatch, overtime and expedited freight.
Cost each failure mode this way and the ranking often changes — a frequent cheap stop can cost more than a rare dramatic one. Book a demo and see downtime costed by asset in OXMAINT AI.
The Reliability KPIs That Track It
Analysis without metrics drifts. These are the numbers that tell you whether reliability is actually improving, each one reported by OXMAINT AI from the work-order and downtime record.
MTBF
Mean time between failures — rising MTBF means the asset is failing less often.
MTTR
Mean time to repair — falling MTTR means you recover faster when it does.
Availability
Share of scheduled time an asset is able to run — the headline reliability number.
Planned vs Unplanned
The ratio of scheduled work to breakdowns — a maturing plant shifts toward planned.
Downtime Cost
Lost value by asset and failure mode — the metric that sets the priorities.
Top Failure Modes
The recurring causes, trended over time, so a permanent fix can be judged.
Analysis Should End in a Work Order, Not a Slide.
The point of breaking downtime down by asset and failure mode is to act on it — a vibration baseline on the mill gearbox, a shell scan on the kiln, a planned liner change before the crusher fails. OXMAINT AI closes that loop, turning the worst offenders into scheduled and predictive maintenance.
1Measure downtime per asset
↓
2Rank by cost & failure mode
↓
3Assign PM or predictive fix
↓
4Track MTBF & cost down
How OXMAINT AI Drives Cement Reliability
OXMAINT AI is the AI-powered CMMS that holds the downtime record, the failure history and the condition data in one place — so the analysis, the costing and the fix all run off the same data. Start free and bring your cement assets onto OXMAINT AI.
Downtime by Asset
Every stop captured and attributed to the asset and failure mode behind it, ready to rank.
Cost Analysis
Lost production, repair and knock-on cost per event, so priorities follow the money.
Predictive Alerts
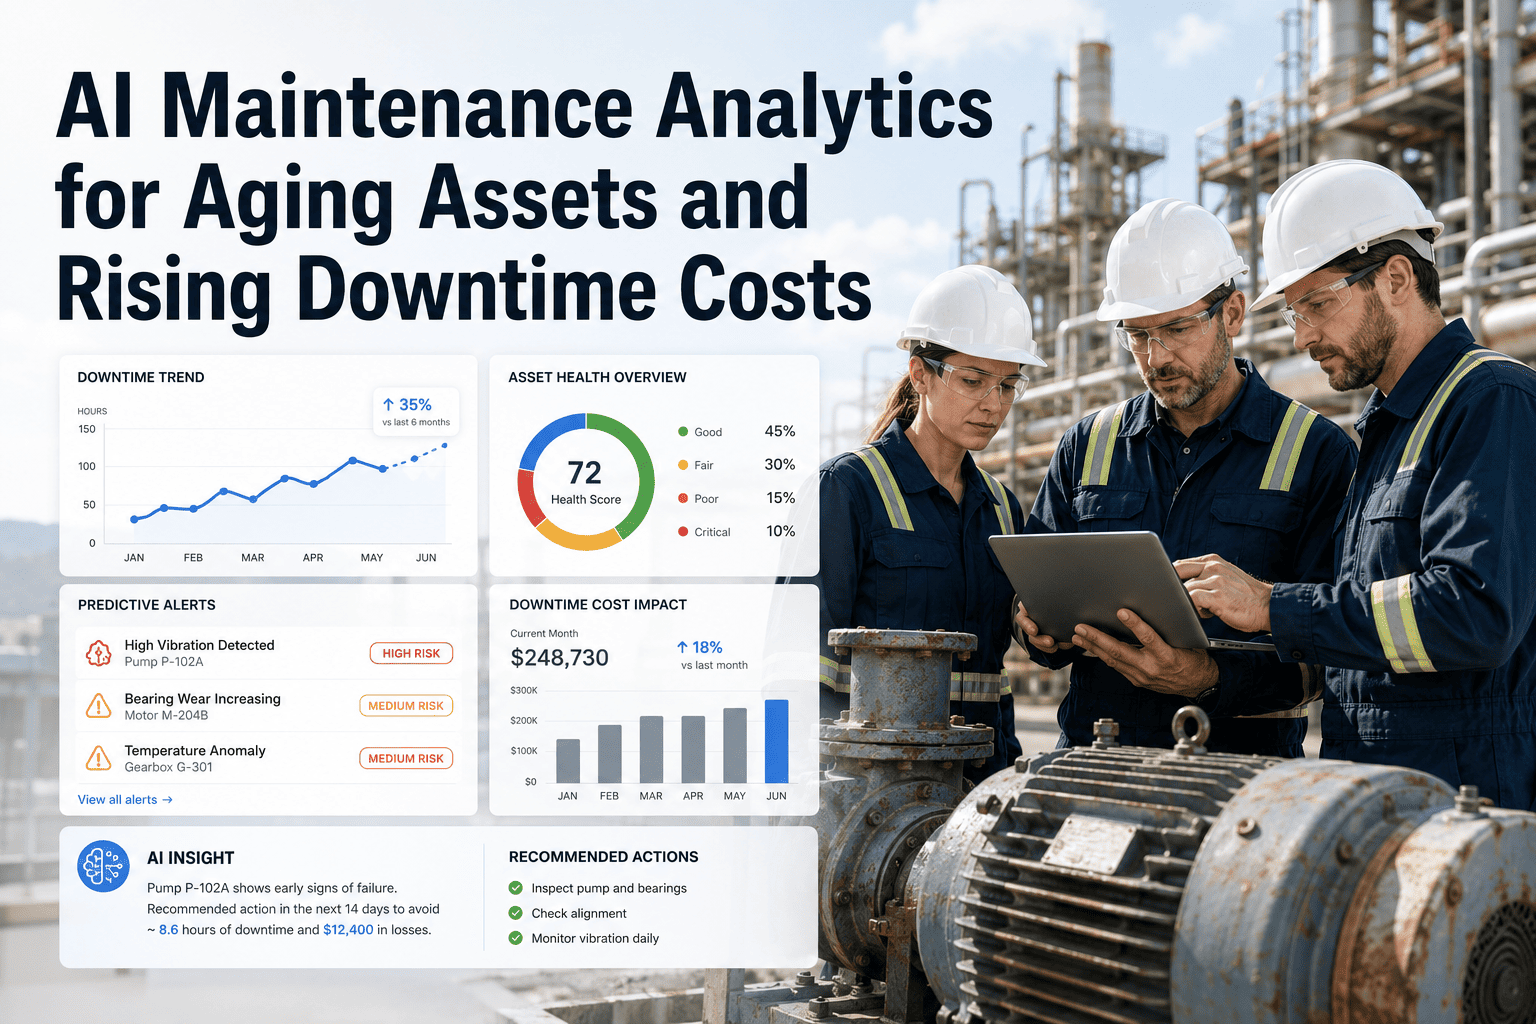
Vibration, temperature and shell signals watched against baselines, raising a work order on drift.
Preventive Scheduling
Liner, media and refractory work planned into shutdowns before the failure lands.
Reliability Dashboard
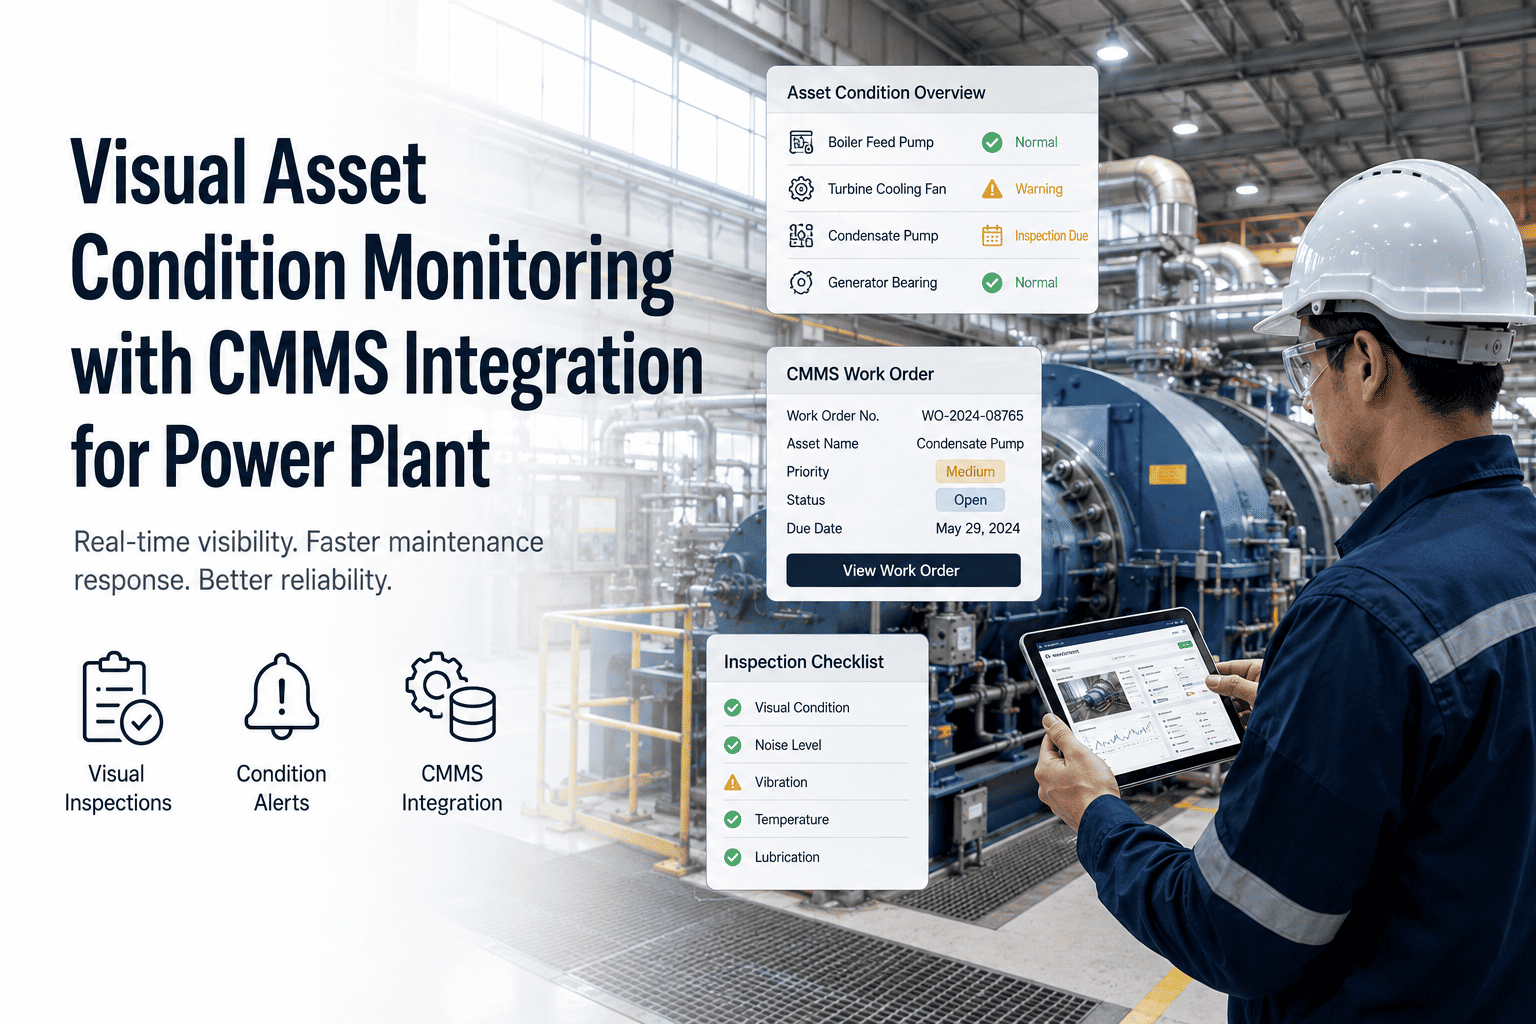
MTBF, MTTR, availability and downtime cost trended per asset in one live view.
Failure-Mode History
Recurring causes tracked across campaigns, so a root cause gets a permanent fix.
EXPERT REVIEW
Written for reliability engineers, maintenance managers and plant managers in cement manufacturing. The asset rankings, failure modes and cost components here are a general framework drawn from standard cement reliability practice — the actual downtime drivers, their costs and the right maintenance strategy depend on your plant's configuration, age, process and operating context, and should come from your own downtime data. The illustrative bar chart shows a typical pattern, not your plant's numbers. OXMAINT AI is a maintenance management and analytics platform that records, ranks and acts on downtime; it does not replace a reliability engineering study, an OEM's maintenance guidance, or your plant's own analysis.
Frequently Asked Questions
What is cement plant downtime analysis?
It is the practice of breaking a plant's total downtime down by asset and by failure mode, putting a cost on each, and ranking them so maintenance effort goes where it recovers the most production. Rather than knowing only that the plant lost a number of hours, it tells you that the kiln and two mills caused most of them, and that wear and bearing failures were the main modes — which is what makes a reliability plan actionable.
Start free and analyze your downtime in OXMAINT AI.
What causes the most downtime in a cement plant?
It varies by plant, but the kiln and preheater, the raw and cement mills, and the crusher are usually the heaviest contributors because they are high-tonnage, continuous assets where a single stop is long and costly. The kiln in particular carries the highest cost per stop, since a restart is slow and fuel-intensive. The only way to know your own order is to attribute every stop and rank it.
Book a demo and see downtime ranked by asset in OXMAINT AI.
How do you calculate the cost of cement plant downtime?
Add lost production (downtime hours × throughput × margin per tonne), the repair cost of labor and parts, the restart and off-spec cost — significant for a kiln — and the knock-on cost of idle downstream assets and missed dispatch. Costing each failure mode this way often reorders the priorities, because a frequent cheap stop can quietly cost more than a rare dramatic one.
Book a demo of downtime costing in OXMAINT AI.
Which KPIs measure cement plant reliability?
The core set is MTBF (how often an asset fails), MTTR (how fast you recover), availability (the share of time it can run), the ratio of planned to unplanned work, and downtime cost by asset. Tracking them per asset — not just plant-wide — is what shows whether a specific reliability action actually worked. A CMMS reports them straight from the work-order and downtime record.
How does predictive maintenance reduce cement plant downtime?
Predictive maintenance watches condition signals — vibration, temperature, kiln shell hot-spots — against a known-good baseline and flags a developing failure while there is still time to plan the fix into a shutdown rather than suffer a breakdown. Applied to the few assets and failure modes the analysis shows cause most of the loss, it converts the worst unplanned stops into scheduled work.
Start free and set up predictive maintenance in OXMAINT AI.
Turn the Downtime Number Into a Plan.
Run cement downtime analysis on OXMAINT AI: every stop attributed to its asset and failure mode, costed, ranked, and turned into the preventive or predictive work order that stops it recurring — so reliability climbs and the lost-hours number falls.