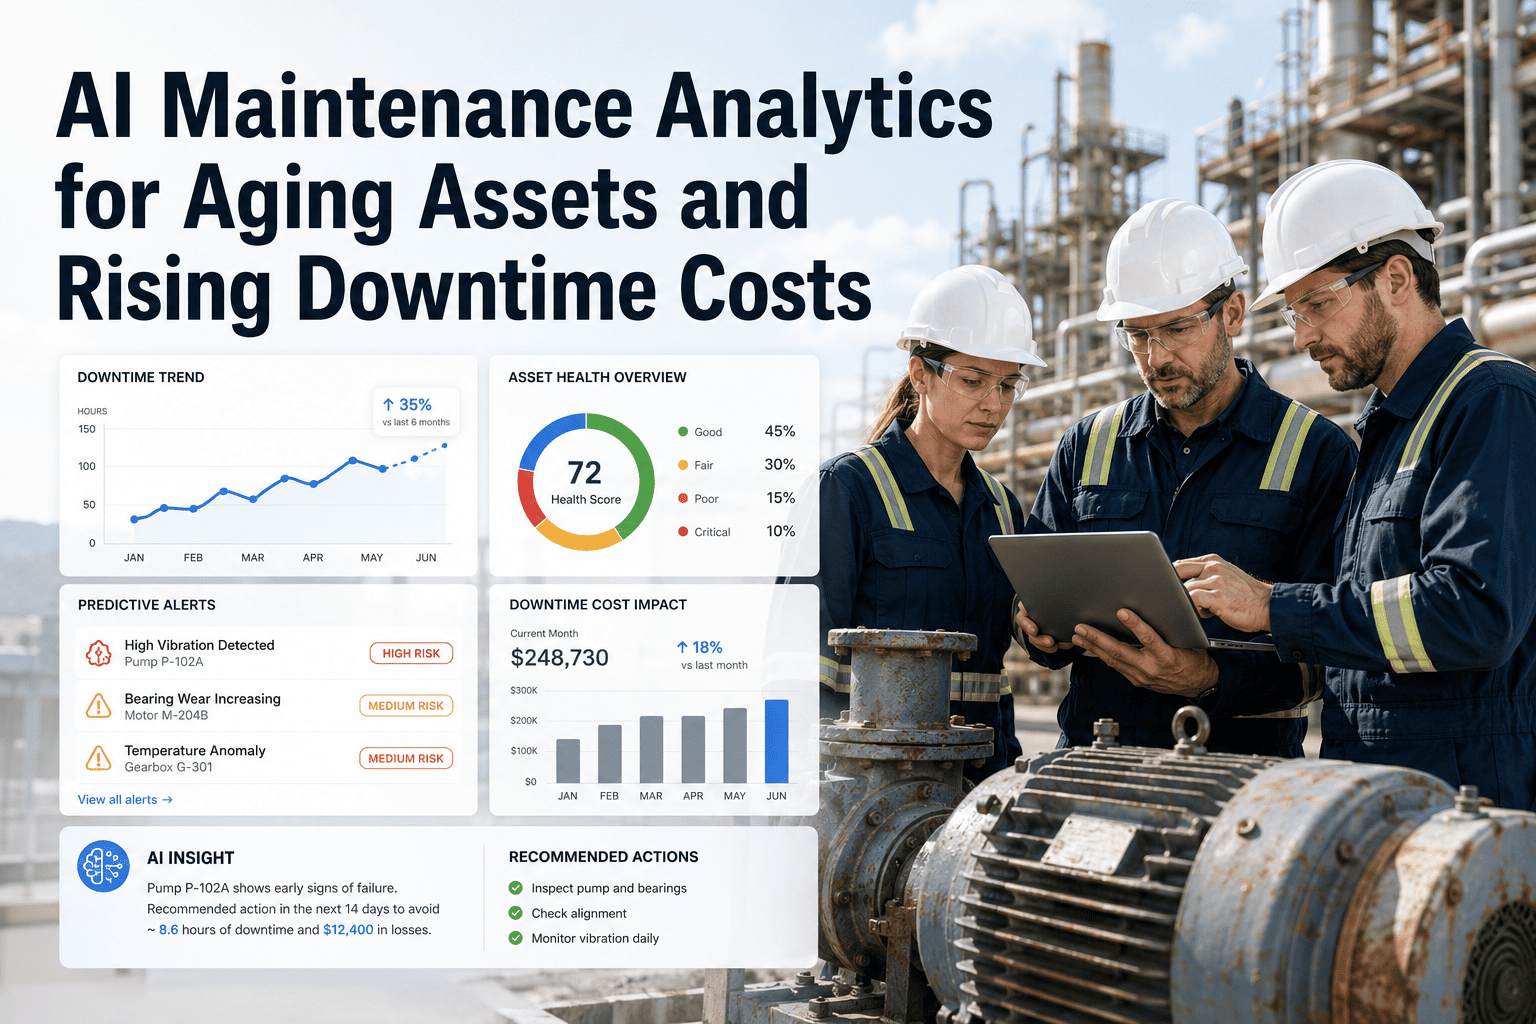
The average age of production equipment in North American manufacturing facilities has risen to 27 years — a level not seen since the post-war industrial hangover of the late 1950s. Aging assets do not fail predictably. They fail at the intersection of wear accumulation, deferred maintenance, environmental stress, and operating condition drift. AI maintenance analytics exists to find that intersection before the failure occurs, and to give maintenance leaders the specific, asset-level intelligence they need to defend capital budgets, prioritize PM spend, and reduce the rising cost of unplanned downtime on aging fleets. OxMaint's analytics and reporting module was built precisely for this challenge.
Asset Reliability — Problem-Solution
When Assets Age, Analytics Have to Get Smarter
Aging equipment does not give you clean failure patterns. AI analytics reads the noise and finds the signal — before the line stops.
Average equipment age — North American manufacturing
$50B
Annual US manufacturing downtime cost
82%
Of failures occur randomly, not on a schedule
Why Aging Assets Break Traditional PM Programs
Time-based PM was designed for assets in steady-state wear. Aging equipment has passed through multiple wear phases — early life, mid-life, and accelerated degradation — and no longer responds predictably to interval-based maintenance. A bearing replaced every 90 days on a 10-year-old motor may need replacement every 45 days by year 20, or may last 180 days depending on operating conditions that vary shift to shift. AI analytics replaces the fixed interval with a dynamic condition model that updates with every data point.
Failure intervals shorten but stay unpredictable as components age through multiple wear curves
AI models learn each asset's individual degradation curve from historical failure and condition data
PM schedules set at installation become misaligned with actual condition within 3–5 years
Dynamic PM interval adjustment based on real-time condition monitoring replaces fixed schedules
Aging equipment has more failure modes simultaneously active — vibration, thermal, electrical, mechanical
Multi-signal analytics combine vibration, temperature, current, and process data into a single health score
Maintenance cost per asset rises but capital replacement cannot be justified without data
Cost-per-failure and cost-per-operating-hour analytics generate the repair-vs-replace data point automatically
Failure patterns buried in years of work order history are not visible without analysis
AI pattern recognition surfaces recurring failure modes and their leading indicators from historical WO records
Five Analytics Capabilities That Change Outcomes on Aging Fleets
01
Asset Health Scoring
Every monitored asset receives a composite health score (0–100) updated continuously from sensor feeds and maintenance events. Scores below 60 trigger automatic review. A score trend — not just the number — reveals whether an asset is degrading slowly or accelerating toward failure.
Typical result: 35% reduction in surprise failures within 90 days of deployment
02
Cost-Per-Operating-Hour Tracking
Maintenance cost divided by production hours run gives the real cost of keeping each asset in service. As assets age, this number climbs. When it crosses the threshold of new equipment operating cost, the replacement case makes itself — with data that finance will accept.
Typical result: Capital replacement decisions 40% faster with data-backed justification
03
Recurring Failure Mode Detection
AI scans work order history for assets that experience the same failure type more than twice in any 12-month window. Recurring failures on aging assets indicate a structural problem — wrong PM task, inadequate lubrication, or design life exceeded — not a random event.
Typical result: 28% of recurring failures traced to wrong PM specification
04
PM Effectiveness Analysis
Not all PM tasks prevent failures equally. Analytics measures failure rate before and after each PM task type, by asset class. Tasks that show no correlation with failure reduction on aging assets are flagged for revision — freeing PM hours for tasks that actually move the reliability needle.
Typical result: 22% PM task reduction with no change in failure rate
05
Downtime Attribution
OxMaint attributes every downtime event to an asset, failure mode, shift, and maintenance response time. Over 3–6 months, this builds a downtime heat map that shows which assets, which shifts, and which failure categories are driving the bulk of production loss on aging equipment.
Typical result: Top 20% of assets account for 70–80% of downtime cost
Get a Downtime Heat Map for Your Fleet
OxMaint's analytics team can build an initial asset health and downtime attribution report from your existing maintenance data within days of starting a free trial. See which assets are driving your downtime costs before your next budget review.
The Downtime Cost Multiplier for Aging Equipment
| Asset Age Band |
Average MTBF Change |
Repair Cost vs New |
Downtime Frequency |
AI Analytics Value |
| 0–7 years |
Stable or improving |
40–60% of new cost |
Low — predictable |
Baseline calibration |
| 8–15 years |
Declining 10–20% per 3 yrs |
60–85% of new cost |
Moderate — watch list |
Early condition alerts |
| 16–25 years |
Declining 25–40% per 3 yrs |
85–120% of new cost |
High — active monitoring |
Health scoring critical |
| 25+ years |
Unpredictable — accelerating |
120–200%+ of new cost |
Very high — daily review |
Replace vs repair daily |
Expert Review
"
The fundamental error in aging asset management is applying the same analytics framework that works for new equipment. New equipment fails early or not at all. Aging equipment fails from wear-out mechanisms that follow their own trajectory — and that trajectory is unique to each machine, each operating environment, and each maintenance history. The only way to manage aging assets intelligently is to instrument them individually and build asset-specific models. Generic benchmarks become increasingly useless after year 15. AI analytics that learns from each machine's own history is the only tool that actually improves with age — which is exactly the property you need when your fleet is getting older.
Dr. Priya Anand, P.Eng
Asset Lifecycle Strategist — 19 years reliability engineering, heavy industry and process manufacturing
Frequently Asked Questions
Can AI maintenance analytics work if we do not have IoT sensors on our aging equipment?
Yes — AI analytics on aging assets does not require sensor hardware as a prerequisite. OxMaint can build failure pattern analysis, PM effectiveness scoring, and cost-per-hour tracking entirely from work order history, inspection records, and operator observations that already exist in your maintenance data. Sensor integration adds predictive capability, but the analytics layer starts delivering value from day one using existing records.
Start a free trial to see what your current data already shows.
How does OxMaint's analytics help build the business case for capital equipment replacement?
OxMaint tracks cost-per-operating-hour for each asset — the total maintenance spend divided by production hours run in any period. As aging assets accumulate repair costs, this metric rises above the equivalent cost for new equipment. OxMaint generates the repair-versus-replace comparison automatically, including projected maintenance costs over the next 12–24 months based on degradation trends. This gives finance a data-backed replacement justification rather than a maintenance manager's qualitative judgment.
Book a demo to see this report built live.
How long does it take for OxMaint's AI analytics to produce accurate asset health scores on aging equipment?
Initial health scores are generated within 24 hours of data ingestion using statistical baselines from your historical records. These scores improve in accuracy over 30–90 days as the AI calibrates against actual failure events in your environment. Assets with rich maintenance histories produce more accurate early models — which is an advantage with aging equipment that has years of records available. The accuracy improvement timeline is reviewed during the
onboarding demo.
Your Aging Assets Are Telling You Something — OxMaint Translates It
Every failure, every PM, every downtime event in your maintenance history is a data point. OxMaint turns that history into forward-looking asset intelligence. Book a 30-minute session to see what your fleet data already reveals.