cmms-roi-calculator-guide-maintenance-leaders

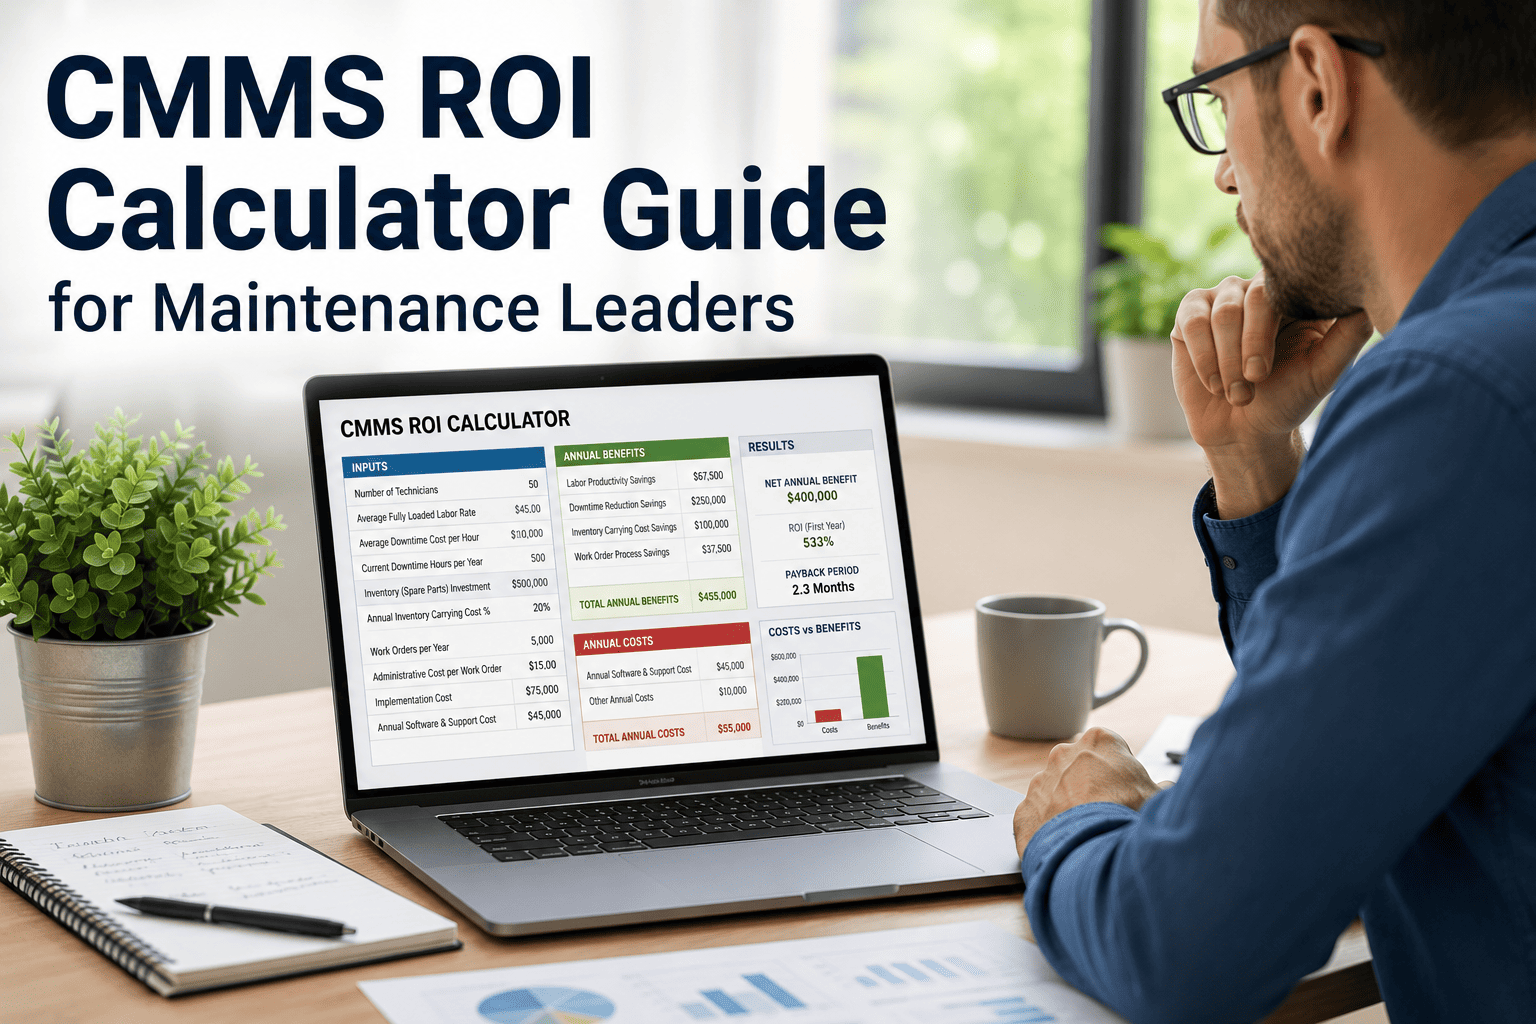
CMMS ROI Calculator Guide for Maintenance Leaders


Most maintenance managers can tell you exactly what their CMMS costs. Very few can tell a CFO exactly what it saves — and that gap is usually what kills the renewal budget or blocks the first purchase entirely. The mistake almost every team makes is stopping the ROI math at labor savings, which typically accounts for only a quarter to a third of the real value a CMMS delivers. Sign in to OxMaint to pull your current downtime, overtime, and parts spend into one baseline report. Book a demo to see a live ROI model built from your own facility numbers.

OxMaint · CMMS ROI Calculator Guide
A CMMS is never really a software cost. It is a reallocation of money you are already spending — just moved from reactive repairs into planned work.

The ROI Formula Finance Teams Actually Trust

CFOs do not approve software on operational intuition. They approve it on three numbers: payback period, year-one return, and a multi-year value trend.

ROI = (Total Annual Savings − Annual CMMS Cost) ÷ Annual CMMS Cost
Run this once with a conservative estimate and once with your actual baseline data. Present both — CFOs trust a range more than a single confident number.

Five Savings Categories Every CMMS Business Case Needs

Labor savings alone under-represents the true value. A complete ROI case adds four more streams that most teams never quantify.

Unplanned downtime reduction

25–50%
Labor productivity / wrench time

Up to 2×
Spare parts and inventory carrying cost

18–19%
Reactive-to-planned labor cost shift

30–50%
Asset life extension / deferred capex

20–40%
Ranges reflect typical outcomes reported across facilities that move from a mostly reactive maintenance approach to a structured, CMMS-driven preventive program.
You do not need a perfect baseline to start this calculation. You need last year's downtime hours, overtime spend, and parts invoices — OxMaint can turn that into a savings model in one session.

A Worked Example: 10-Technician Manufacturing Plant

Abstract percentages convince nobody. A worked scenario with real before-and-after numbers is what moves a CFO from questioning the request to approving it.

Before CMMS
Maintenance strategy split70% reactive / 30% planned
Technician wrench time25–35% of shift
Work orders completed on schedule~35%
Emergency parts procurement2.4–3.2× standard rate
After 12 Months on OxMaint
Maintenance strategy split40% reactive / 60% planned
Technician wrench time55–65% of shift
Work orders completed on schedule~85%
Emergency parts procurementReduced on 40–60% of events

Where the Payback Timeline Usually Lands

Payback speed depends on how reactive your current baseline is — the worse the starting point, the faster the return.

Facility ProfileTypical Payback PeriodPrimary Driver
High reactive spend, no PM structure3–6 monthsEmergency repair and overtime elimination
Mixed reactive / preventive baseline6–9 monthsPM compliance gains, parts control
Established preventive program9–18 monthsAsset life extension, compliance readiness
Multi-site or regulated operation12–18 monthsAudit prep time, insurance and penalty avoidance
Scroll right to view full comparison on mobile
Expert Review
This ROI framework was reviewed by OxMaint's analytics team against customer deployments across manufacturing, facility management, and multi-site operations. The five-category model consistently produced more accurate CFO-ready numbers than labor-savings-only estimates, because it captures the parts, compliance, and asset-life value streams that traditional calculations leave out.

Frequently Asked Questions — CMMS ROI Calculation

Start with last year's downtime hours, overtime spend, parts and inventory cost, and any compliance-related costs such as fines or audit prep time. Sign in to OxMaint to pull these into a single baseline report automatically.
Use both, but label them separately. Hard savings are reductions in actual spend, while cost avoidance covers failures and penalties that never happened — CFOs accept both when each is clearly quantified. Book a demo to see how each is tracked separately in the dashboard.
Most teams see early wins in overtime and emergency parts spend within the first 60 to 90 days, with the full five-category picture maturing over the first year. Sign in to OxMaint to track savings against your baseline from week one.
Yes. Year one is typically driven by downtime and labor gains, while years two and three add compounding value from asset life extension and lower total inventory holding. Book a demo to see a 3-year cumulative value projection for your facility.
Presenting best-case numbers as guaranteed outcomes. Conservative estimates that under-promise and over-deliver build far more credibility with finance than an aggressive single figure. Sign in to OxMaint to generate a conservative and an optimistic scenario side by side.
OxMaint · CMMS ROI · Analytics & Reporting

The CFO does not need to believe maintenance is valuable. They need a payback period, a year-one number, and a data source they can audit at any time.

Baseline capture. Five-category savings tracking. Payback and multi-year projections. Executive-ready dashboards — updated automatically, not rebuilt every budget season.



Share This Story, Choose Your Platform!