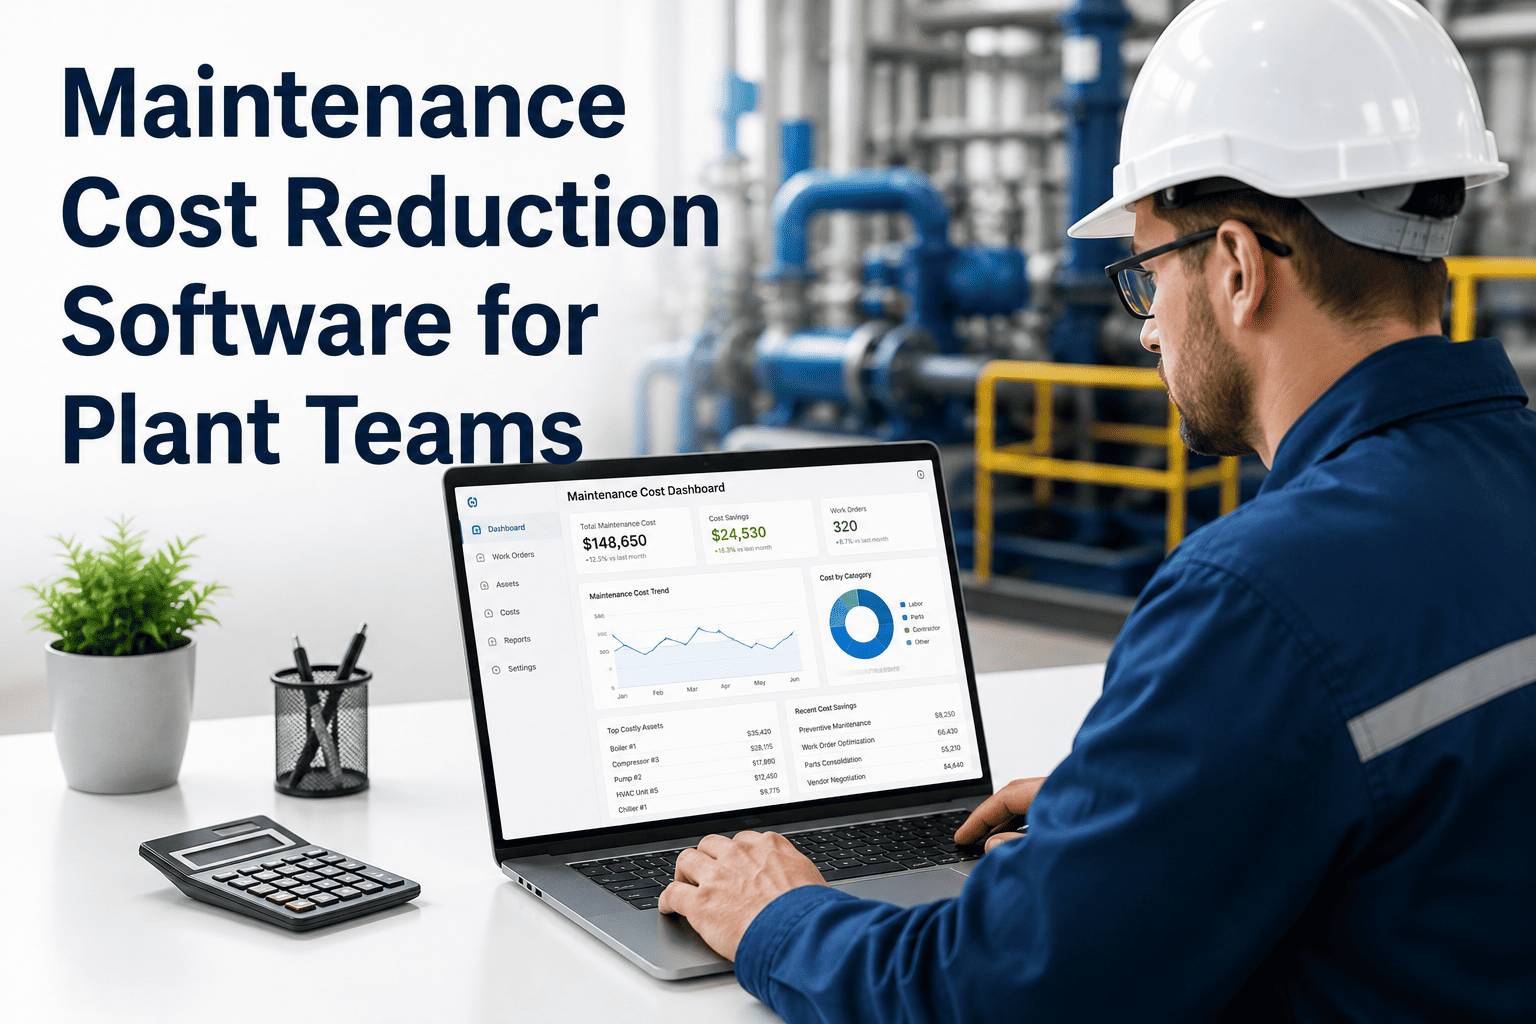
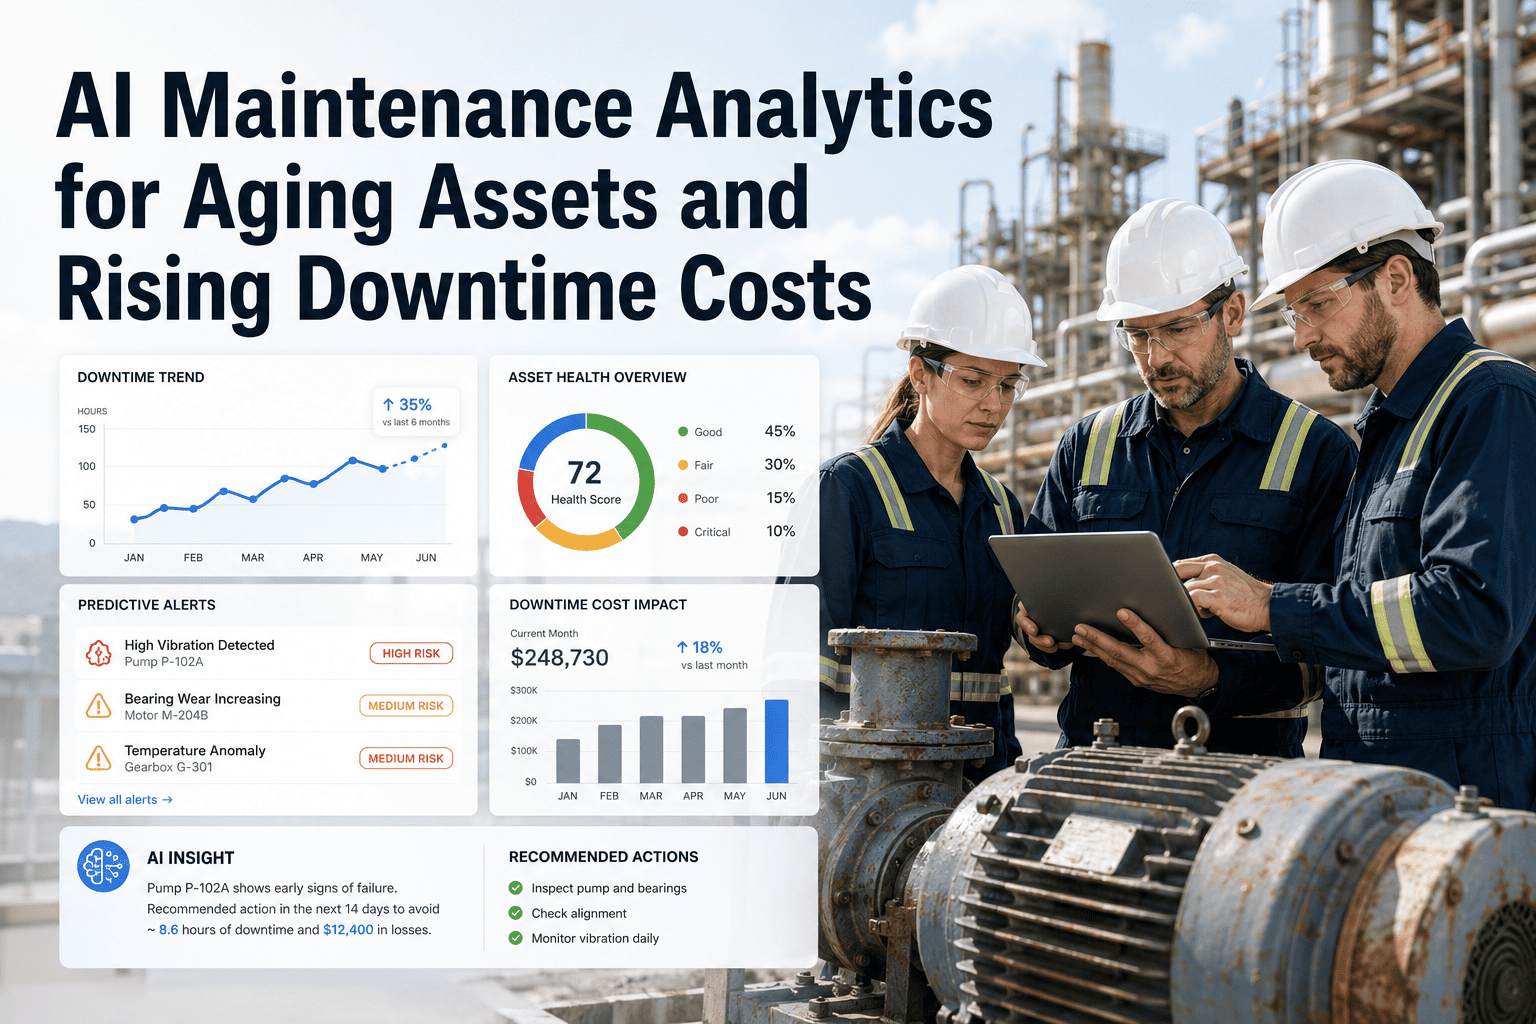
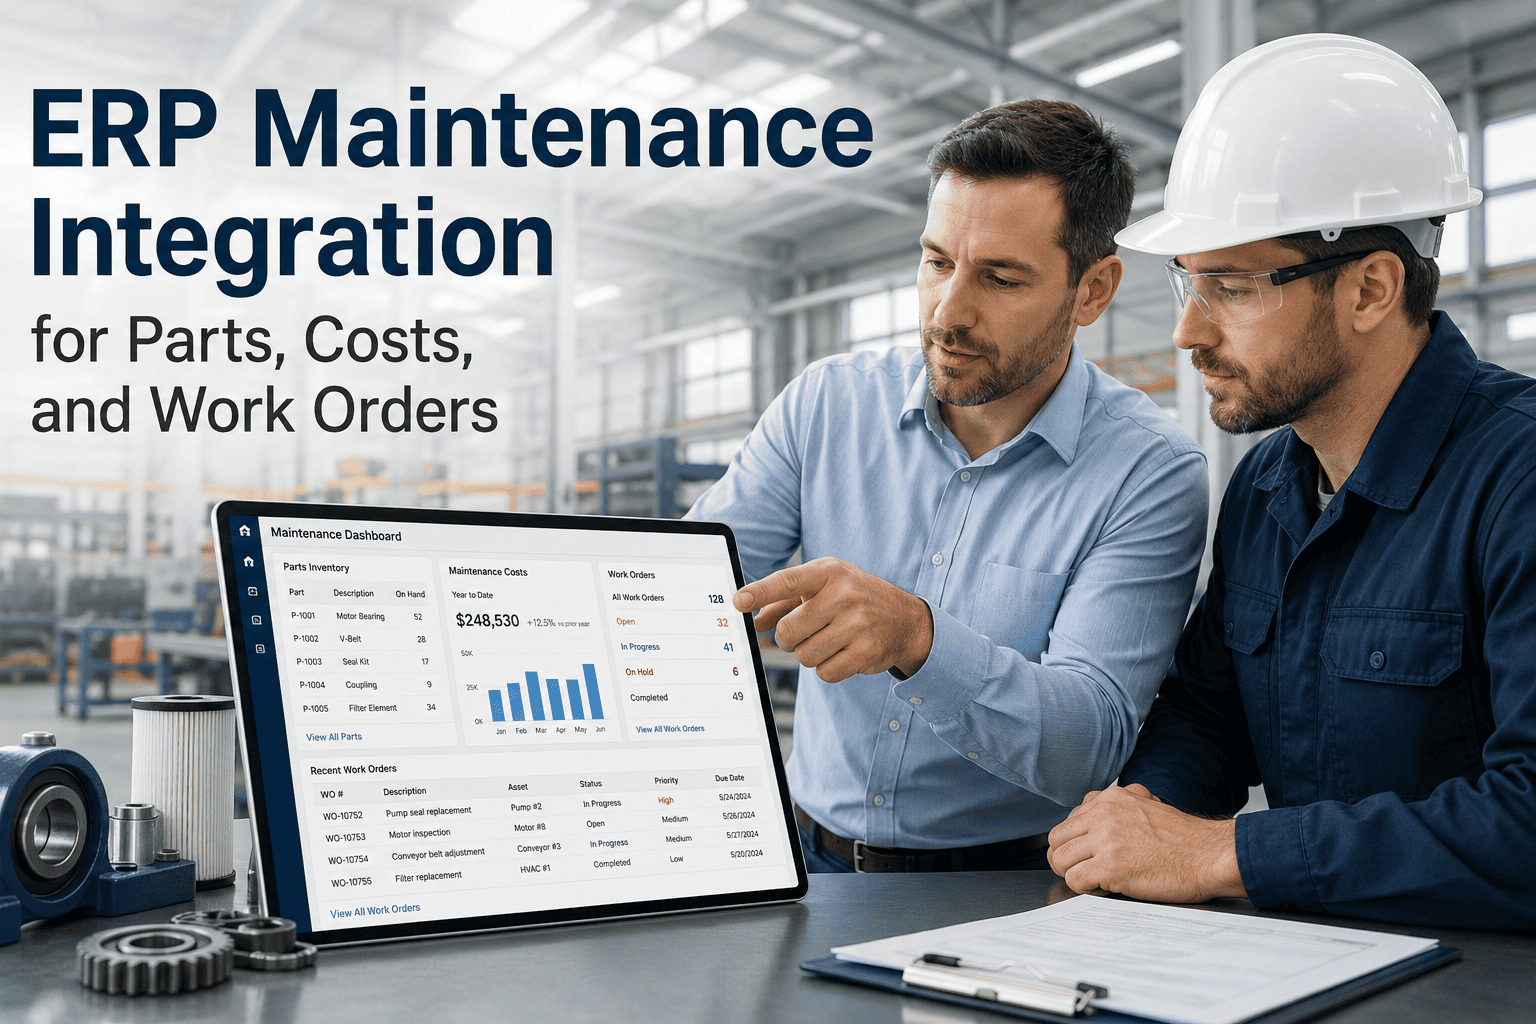
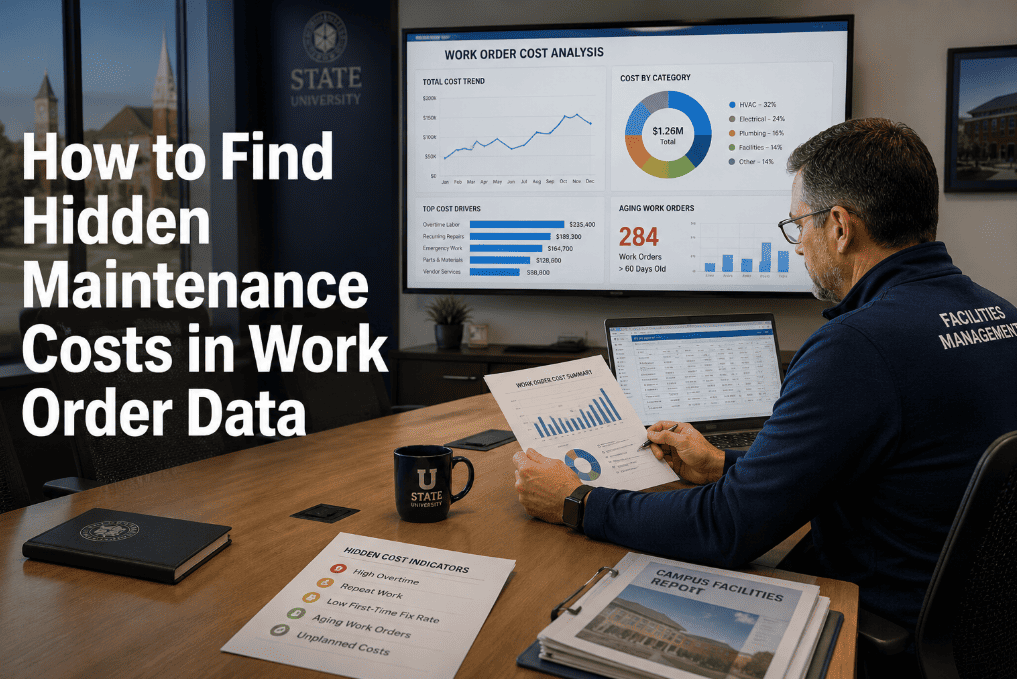
Most plant maintenance budgets bleed money in places no line item ever shows — overtime premiums on emergency callouts, rush freight on parts that should have been pre-staged, and downtime that never gets logged against the asset that caused it. OxMaint's analytics and reporting tools tie labor hours, parts usage, and downtime directly to the work order and asset that generated them, so the true cost of every breakdown becomes visible instead of buried across spreadsheets nobody reconciles. Book a 30-minute demo to see cost-driver reporting running on your own asset list, or start free and pull your first cost report this week.
MAINTENANCE COST CONTROL · CMMS ANALYTICS · ROI
Where Your Maintenance Budget Is Actually Going
Most plants can name their total maintenance spend. Few can name which assets, which failure types, or which shift patterns are driving most of it. Here is how to find out — and what closing that gap is worth.
70%+
of true repair cost sits in overtime, rush freight, and downtime — costs that rarely appear on the parts invoice
4x
higher average cost of an emergency repair compared to the same job planned and scheduled in advance
20%
of assets typically generate 70–80% of total maintenance spend in an unmanaged plant
THE HIDDEN COST PROBLEM
The Maintenance Cost Iceberg
When a budget gets approved, it covers what is visible — the parts invoice, the standard labor hours, the planned downtime window. What actually gets spent is almost always larger, because the costs that sink a maintenance budget happen below the surface, in categories nobody assigns to a specific work order.
What Gets Approved
Parts invoice price
Standard labor hours
Scheduled downtime window
What Actually Gets Spent
Overtime & emergency callout premium
Expedited freight & rush order fees
Unplanned production downtime
Secondary damage to adjacent components
Supervisor re-planning & reassignment time
See Your Own Cost Iceberg
OxMaint ties labor, parts, and downtime to the asset and work order that caused them — so the hidden tier becomes a report, not a guess.
REACTIVE VS DATA-DRIVEN
The Same Five Cost Drivers, Two Different Outcomes
The cost categories below don't change between a reactive shop and a data-driven one. What changes is whether the cost gets traced back to the asset that caused it — and that single difference is where most of the savings come from.
| Cost Driver |
Reactive Approach |
Data-Driven Approach |
Typical Impact |
| Emergency parts ordering |
Parts ordered at rush pricing once the asset is already down |
Usage history flags likely failures early, parts staged ahead of need |
Lower rush-order premium per incident |
| Repeat failures |
Same fault re-opened as a fresh work order each time |
Failure codes tied to asset history, repeat faults flagged automatically |
Fewer return visits on chronic assets |
| Labor hours |
Estimated from memory, rarely compared to plan |
Actual hours logged per work order, benchmarked by asset class |
Clear view of where labor time is spent |
| Downtime |
Tracked informally, often not captured at all |
Downtime logged against the specific asset and work order |
Downtime becomes a tracked cost, not a guess |
| Inventory & parts spend |
Reactive ordering, no usage pattern visible |
Parts usage tied to specific assets and work order history |
Reduced emergency procurement spend |
WHERE THE MONEY LEAKS
Five Places Maintenance Budgets Quietly Overspend
2–3x
Overtime & Emergency Callouts
Callouts outside scheduled hours carry overtime and premium pay rates that rarely get tracked back to the asset that caused them.
15–25%
Expedited Freight & Rush Parts
Typical premium paid for rush shipping and emergency parts orders compared to standard lead-time procurement.
Untracked
Unplanned Downtime
In most plants, downtime cost is never logged against the work order — so it never appears in a maintenance cost report at all.
1 in 3
Repeat & Chronic Failures
Repeat failures that could have been flagged from the asset's own history before the second breakdown occurred.
Hrs / Week
Re-Planning & Admin Time
Lost to supervisors re-shuffling schedules and reassigning technicians every time an unplanned failure breaks the plan.
HOW THE LEAK GETS FOUND
From Work Order to Cost-Driver Report
1
Every work order logs labor hours, parts used, and downtime against one specific asset — not a general ledger code.
2
Costs roll up automatically by asset, asset class, and failure type instead of sitting in disconnected spreadsheets.
3
Reports rank assets and fault codes by total cost, surfacing the small group of equipment driving most of the spend.
4
Leadership redirects PM coverage, spare parts stocking, or capital budget toward the assets the data shows are worth it.
Turn Work Order Data Into a Cost Report
No spreadsheet exports, no manual pivot tables — OxMaint's reporting layer ranks your highest-cost assets automatically.
EXPERT REVIEW
Plant Reliability & Maintenance Cost Strategist
20+ Years in Industrial Maintenance Operations & Cost Control
In nearly every plant I have audited, the maintenance budget that gets approved and the maintenance cost that actually gets spent are two different numbers — and the gap almost always hides in overtime, rush freight, and downtime nobody logged. The plants that close that gap are not the ones that cut spending; they are the ones that start tagging every cost to the asset and work order it came from. Once that data exists, the highest-cost assets identify themselves, and you stop guessing which equipment needs a bigger PM budget and start knowing.
FREQUENTLY ASKED
Maintenance Cost Reduction — Common Questions
How do I find out which assets are actually costing the most to maintain?
Tag every work order's labor hours, parts cost, and downtime to a specific asset, then run a report ranking assets by total cost over a 6–12 month window. The assets at the top of that list are usually a small fraction of the portfolio.
Sign up free and pull this report against your current work order history.
Is reactive maintenance really more expensive than planned maintenance?
Yes — emergency repairs combine overtime pay, rush freight on parts, and the cost of unplanned production downtime, which together typically run several times higher than the same repair scheduled in advance.
Book a demo to see how planned-versus-reactive cost comparisons look inside a real reporting dashboard.
How does linking costs to work orders help with next year's budget?
A budget built on actual historical cost by asset class is far more defensible than one built on last year's total plus a flat increase. When labor, parts, and downtime are already tied to work orders, building next year's plan becomes a query instead of a guessing exercise.
Start free to begin building that history now.
Can I track downtime cost without buying a separate system?
Downtime can be logged directly on the work order that addresses the failure, alongside labor and parts, without a dedicated downtime-tracking tool. The key is making downtime a required field at work order closure rather than an optional note.
Book a demo to see how OxMaint structures this at closeout.
How long before cost reports become reliable after switching to a CMMS?
Most plants see usable cost-driver patterns within 60–90 days, once a full maintenance cycle of work orders has been logged with consistent labor, parts, and downtime data. Reliability improves further after a full seasonal cycle.
Sign up free to start that data clock today.
OXMAINT · ANALYTICS & REPORTING
Stop Guessing Where the Budget Goes. Start Measuring It.
OxMaint connects every labor hour, part, and downtime minute to the asset and work order that generated it — so your highest-cost equipment shows up in a report, not a postmortem.