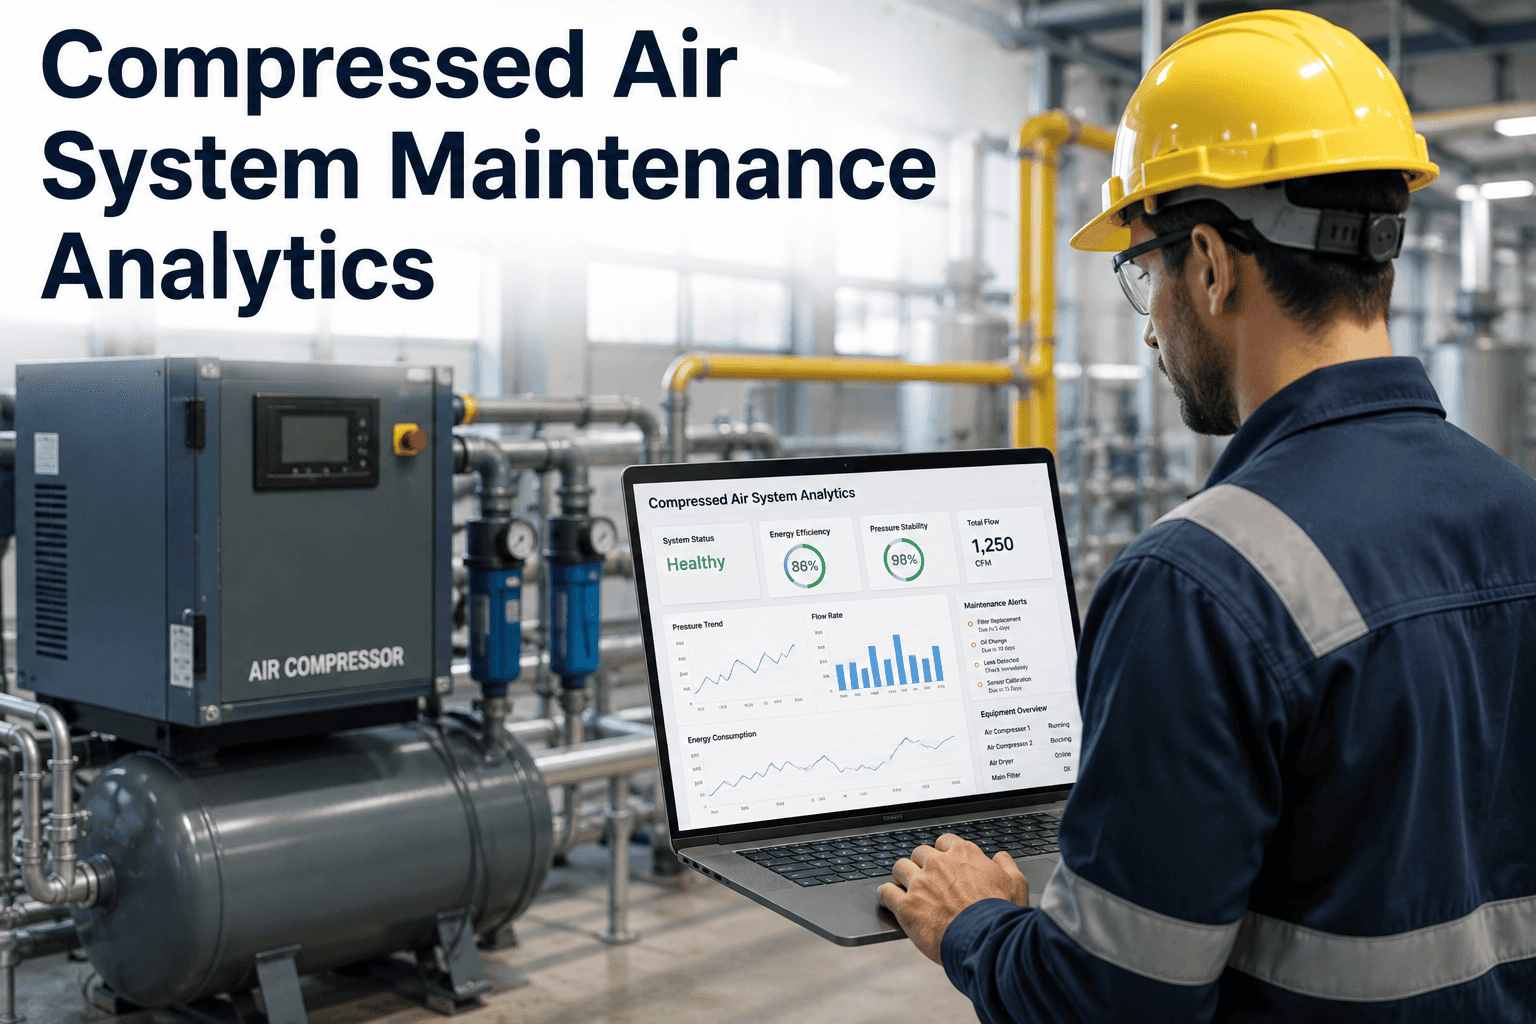
Compressed air systems are among the most expensive utilities on any manufacturing floor — yet they are also the most poorly monitored. Studies consistently show that 20 to 30 percent of compressed air output is lost to undetected leaks, inefficient pressure settings, and equipment drift that goes unnoticed until production suffers or energy bills spike. Without maintenance analytics, plant teams are forced to rely on periodic manual audits that capture only a snapshot of system performance. OxMaint brings continuous analytics and reporting to compressed air systems — tracking pressure trends, leak patterns, and component health so that maintenance decisions are driven by data rather than guesswork. Book a demo to see how analytics transforms compressed air maintenance from reactive to strategic.
Compressed Air System Maintenance Analytics
How data-driven maintenance on compressed air systems cuts energy waste, prevents unplanned downtime, and turns your most expensive utility into your most controlled one.
Why Compressed Air Leaks Stay Hidden Without Analytics
Manual leak detection — typically an annual ultrasonic survey — captures system performance at a single point in time. Leaks develop between surveys, pressure drops are compensated by throttling compressors higher, and energy consumption climbs invisibly. The table below shows what plants typically discover when they move from periodic audits to continuous analytics in OxMaint.
| Detection Method | Leak Discovery Speed | Energy Waste Visibility | Root Cause Tracking |
|---|---|---|---|
| Annual ultrasonic survey | Once per year | Snapshot only | None |
| Monthly pressure logging | 30-day lag | Trend without context | Manual correlation |
| Continuous analytics in OxMaint | Real time | Per-zone, per-compressor | Automatic fault correlation |
How OxMaint Processes Compressed Air Data Into Action
What Analytics Reveals About Your Compressed Air Spend
| Leak Size | Air Loss (CFM) | Annual Energy Waste | Annual Dollar Waste | Detection Method |
|---|---|---|---|---|
| 1/16 inch | 3.8 | 2,210 kWh | $265 | Manual survey |
| 1/8 inch | 14.5 | 8,430 kWh | $1,012 | Manual survey |
| 1/4 inch | 52.0 | 30,260 kWh | $3,631 | Pressure trend logging |
| 3/8 inch | 105.0 | 61,110 kWh | $7,333 | Pressure trend logging |
| 1/2 inch | 185.0 | 107,670 kWh | $12,920 | OxMaint analytics |
Key Analytics KPIs for Compressed Air Systems
What Plant and Maintenance Leaders Report
We used to do an annual leak survey and fix maybe 40 leaks. After connecting our pressure and flow sensors to OxMaint analytics, we identified 127 leaks in the first quarter — including eight that were each costing us over $500 a month. The analytics did not just find more leaks; it found the expensive ones first because it ranked them by actual energy impact, not just size.
Our energy team had been blaming the compressor supplier for high specific power readings for two years. OxMaint analytics correlated the efficiency drop to a progressively failing air dryer that was causing the compressors to work against higher inlet moisture. One $4,200 dryer repair dropped our specific power by 11 percent. That kind of root cause connection is impossible without continuous analytics tied to asset history.
Frequently Asked Questions
What data sources does OxMaint use for compressed air analytics?
OxMaint ingests data from compressor controllers, flow meters, pressure transducers, dew point sensors, and power meters via standard industrial protocols. The analytics engine normalizes these inputs into unified asset health and performance reports. Book a demo to review your sensor compatibility.
Can OxMaint analytics detect leaks without dedicated leak detection hardware?
Yes — by analyzing pressure decay rates, load/unload cycle patterns, and flow differentials across zones, OxMaint can identify leak presence and approximate severity using data most plants already collect. Dedicated ultrasonic sensors improve precision but are not required. Start free to configure your data sources.
How does analytics-driven maintenance reduce compressed air energy costs?
By detecting leaks and inefficiencies in days rather than months, analytics prevents the compounding energy waste that occurs between manual audits. OxMaint also tracks repair effectiveness so you can verify that each fix delivered the expected savings. Book a demo to see the energy savings dashboard.
Is this applicable to small manufacturing facilities with one or two compressors?
Absolutely — even a single compressor system with two to three sensors generates enough data for OxMaint to track efficiency trends, detect abnormal cycling, and automate filter replacement scheduling. The ROI per compressor is often higher in smaller plants because manual oversight is proportionally more expensive. Start free to set up your first compressor.
Your Compressors Are the Second Most Expensive Utility on Your Floor. Stop Managing Them Blind.
OxMaint analytics turns continuous sensor data into prioritized maintenance actions — so every leak is found, every repair is verified, and every kWh is accounted for.


.png)
