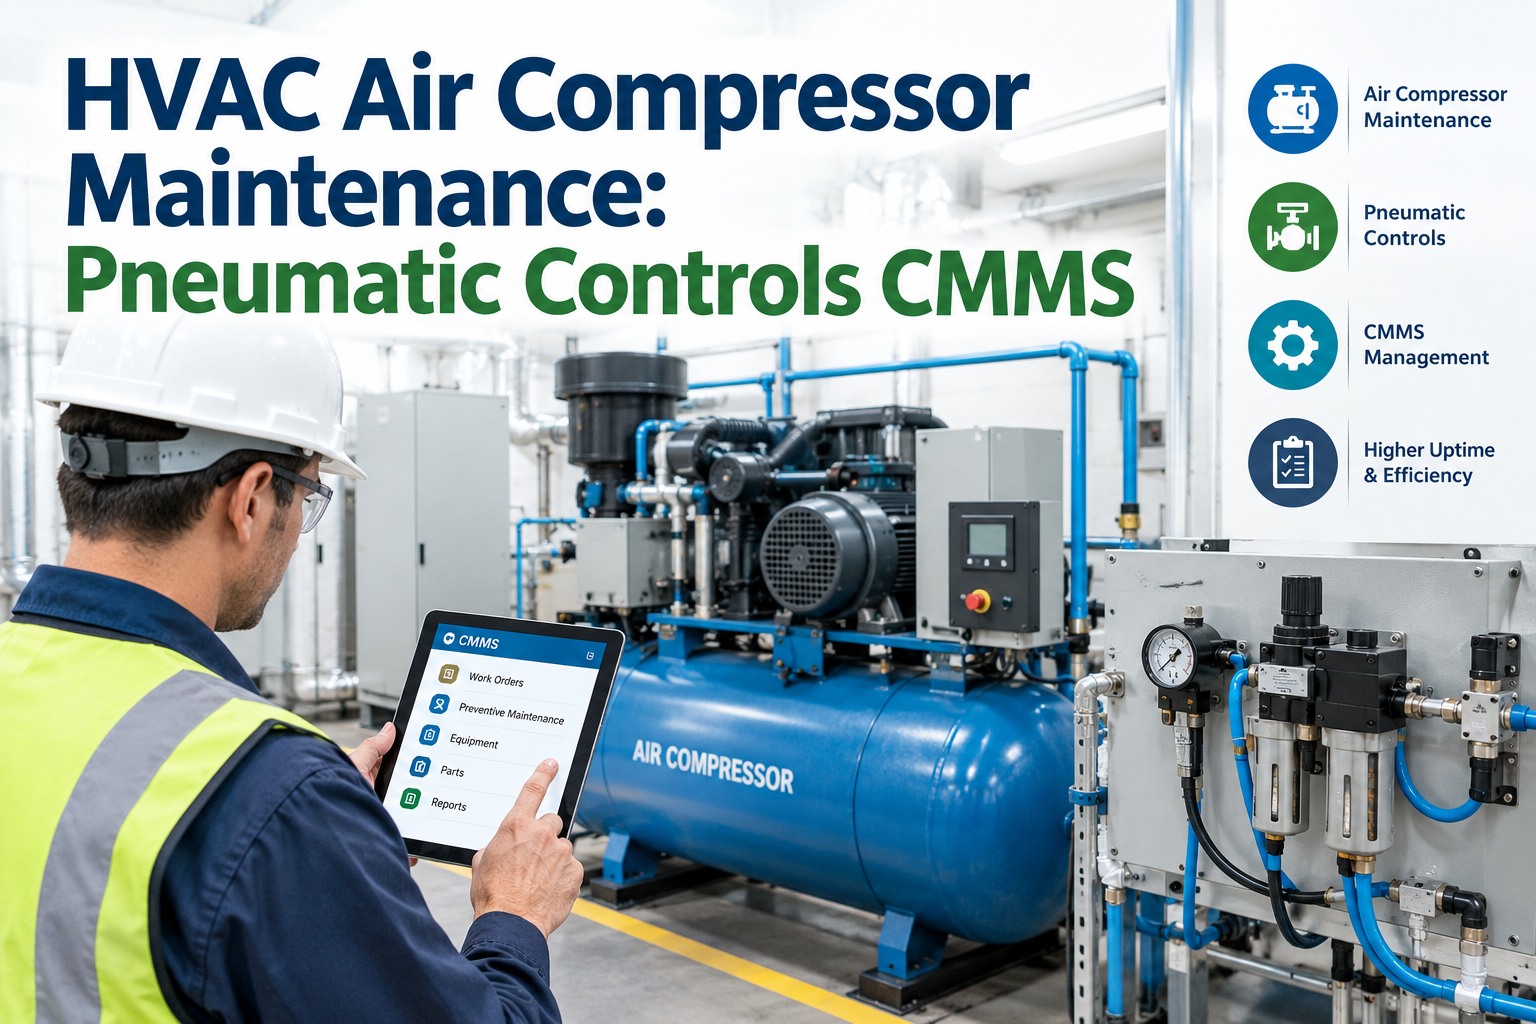
Compressed air is the only utility a plant manufactures itself, meters almost nowhere, and leaks from every fitting in the building. It is also the fourth utility and the most expensive one to generate — air compressors account for roughly 10% of all electricity consumed by American industry, and in a typical plant somewhere between 25% and 35% of every cubic foot generated never reaches a tool. It escapes through pipe leaks, pressure mismatches, and compressor inefficiency before doing a single unit of useful work. What makes this worse than ordinary waste is that it compounds. Leaks drop system pressure, so operators raise the compressor discharge setpoint to compensate, and every 2 psi of added pressure costs about 1% more energy at full load — while simultaneously pushing harder through every leak already in the system. The plant ends up running an entire extra compressor just to replace air it is throwing away. This guide covers a compressed air maintenance program that breaks that cycle: compressor PM, filter and dryer maintenance, leak detection, and pressure loss analysis. Start a free Oxmaint trial and run a digital compressed air audit linked to your assets, or book a demo to see leak rate and pressure loss tracked by zone.
Manufacturing · Compressed Air · Energy Reliability
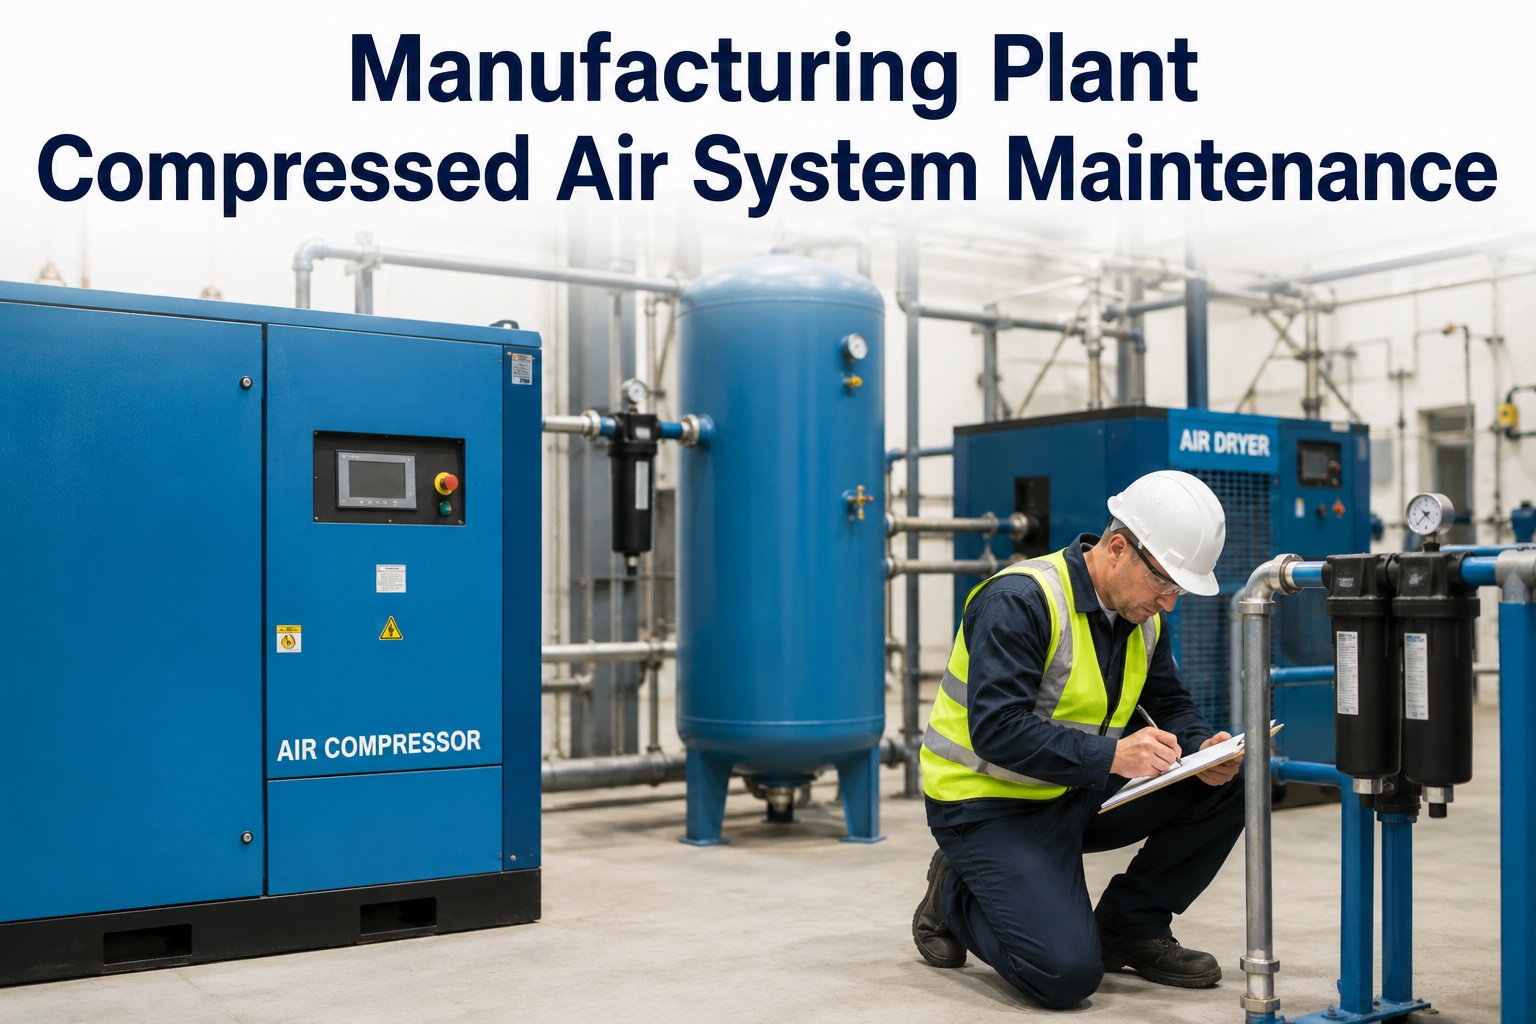
Manufacturing Plant Compressed Air System Maintenance
Compressor PM, filter replacement, leak detection programs, dryer maintenance, and pressure loss analysis — how plants stop wasting a third of the most expensive utility they generate, and turn compressed air into a controlled system.
-
25–35%
of generated air lost before it reaches any tool
-
~10%
of all US industrial electricity goes to air compressors
-
$2,500/yr
cost of one undetected leak at a 1/8-inch fitting
-
2 psi = 1%
every 2 psi of extra pressure adds ~1% to energy use
The Cycle That Drains the Budget
Leaks Don't Just Waste Air — They Raise the Pressure
The most expensive thing about a compressed air leak is not the air it releases. It is what the plant does in response. Follow the loop, and you can see why a system with untreated leaks gets more expensive every year, not just once.
-
1
Leaks develop across the system
Fittings, hose connections, valve seats, and quick-disconnects. A typical plant runs 50 or more leak points at once — cumulative waste equal to one additional compressor running continuously. -
2
Pressure sags at the point of use
Tools at the far end of the distribution network stop performing. Pressure drop is compounded by clogged filters, saturated dryers, and poor connection practices. -
3
Someone raises the discharge setpoint
The fastest fix is more pressure. Plants routinely run 20 to 40 psi above what end-use equipment actually needs — and every 2 psi costs about 1% more compressor energy. -
4
Higher pressure makes every leak worse
The same holes now pass more air. Compressors run longer under load, shortening machine life and driving maintenance cost up — and the loop tightens.
Break the loop at step one: detection and repair can bring leakage below 10% of compressor volume, and most facilities recover the full cost of leak detection equipment within 3 to 12 months on energy savings alone. Book a demo to see leak rate ranked by energy cost, not by noise.
Five Audit Zones
Where to Look, in Order
A compressed air program is structured across five zones, from generation to the point of use. Each has its own PM tasks, its own failure modes, and its own contribution to the waste total. Work them as a repeatable framework, not a one-time survey.
- 1 · Compressor Room Log control mode and average load; target 70–85%. Below 40% load means modulation or a VFD is needed. Offline compressors idling in standby draw 20–30% of full-load power while producing nothing.
- 2 · Air Treatment A saturated dryer or clogged coalescing filter passes moisture and oil aerosols downstream — corroding pipe, contaminating equipment, and causing quality rejects that dwarf a filter change. A healthy refrigerant dryer holds a 3–7°C pressure dew point at rated flow.
- 3 · Distribution Network Receiver capacity targeted at 1–4 gallons per SCFM of output for demand buffering, with tank corrosion, ASME stamp, relief valve date, and condensate drain checked. Seized isolation valves prevent sectioning the system for maintenance.
- 4 · End-Use Points Audit pneumatic tools, cylinders, and blow-off nozzles for artificial demand and inappropriate uses — air applied where a fan, a pump, or a blower would do the job for a fraction of the cost.
- 5 · Energy Metering Record compressor runtime, kWh, and system pressure during both production and idle periods. Without metering there is no baseline — and no way to prove a repair paid for itself.
The most frequent pressure-drop problem areas are after-coolers, separators, dryers, filters, regulators, and poor connections at the point of use. Sign up for Oxmaint to run all five zones as a digital inspection.
The Arithmetic of a Hole
What Each Leak Actually Costs
Leaks are the single largest source of compressed air waste, and their cost scales with size and pressure. A plant with dozens of fittings, hose connections, and valve seats is not losing a little air — it is funding a second compressor.
| Finding | Impact | Action |
|---|---|---|
| One 1/8-inch leak at 100 psi | ~25 CFM wasted; $2,500+/yr | Tag, repair, verify |
| 50+ simultaneous leak points | 20–30% of compressor output | Zone-ranked repair program |
| Excess discharge pressure | ~1% energy per 2 psi | Reduce to true end-use need |
| Clogged filter elements | 5–15% more compression work | Replace on differential pressure |
| Compressor idling in standby | 20–30% of full-load power | Sequencing and control review |
An annual ultrasonic survey captures a single point in time and typically finds only 40–50% of actual leaks — new ones develop between surveys while consumption climbs invisibly. Book a demo to see continuous leak detection replace the annual survey.
Find the Expensive Ones First
Rank Leaks by Energy Cost, Not by How Loud They Hiss
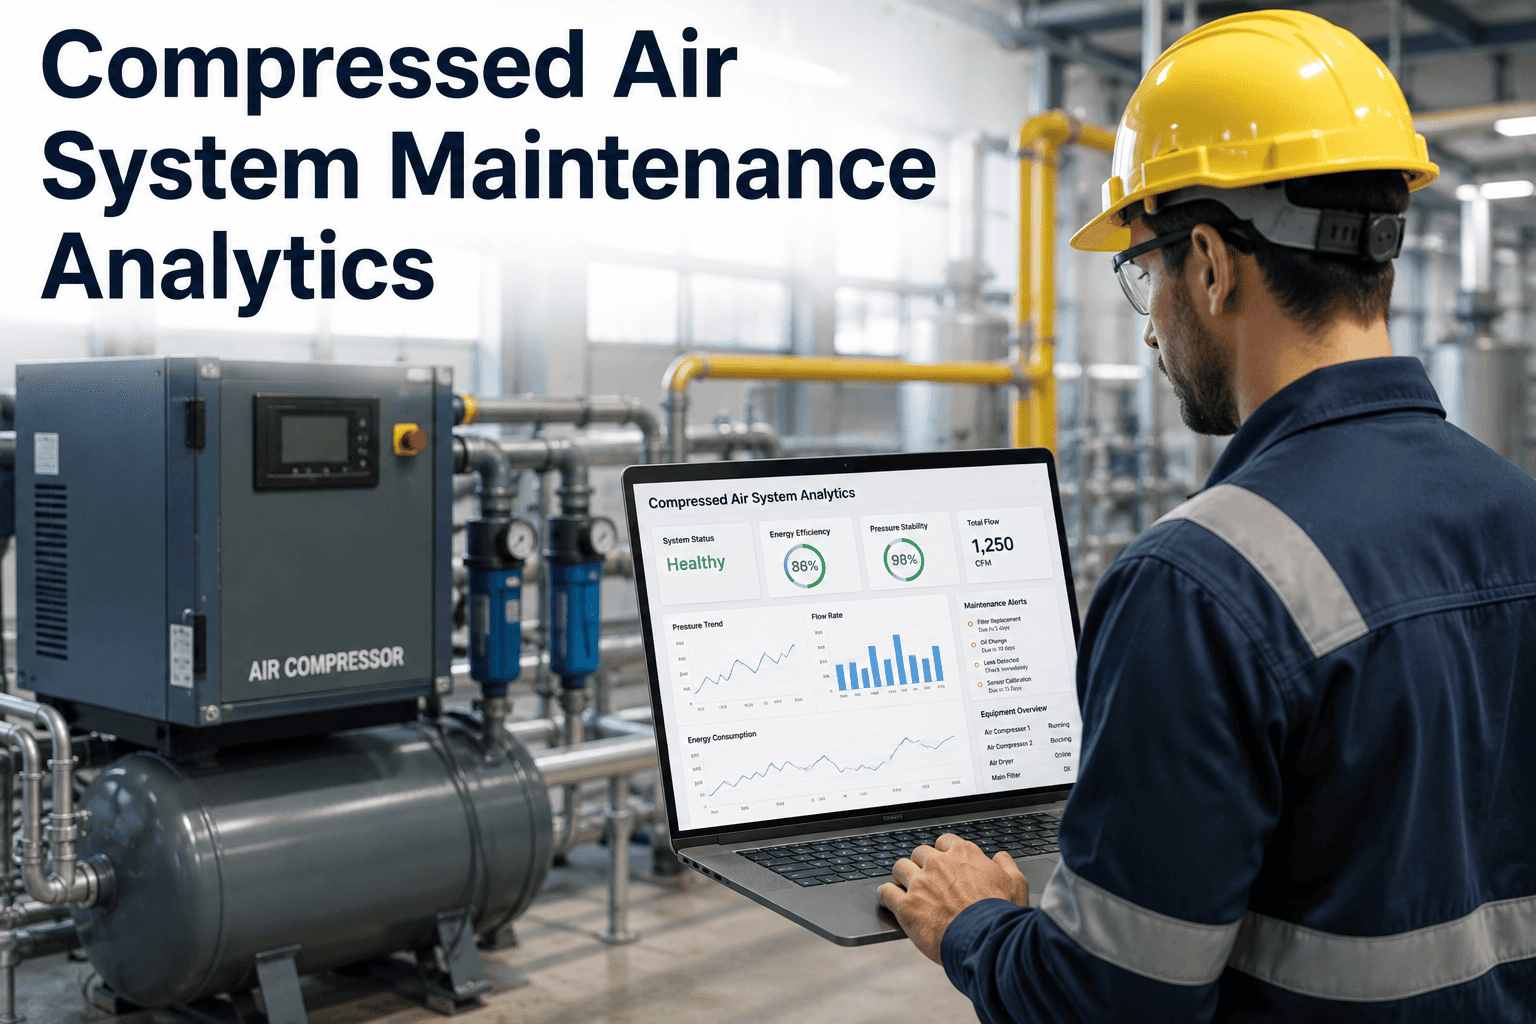
The reason continuous monitoring beats the annual walkaround is not that it finds more leaks — though it does. It is that it finds the expensive ones first. Pressure, flow, temperature, and runtime data from compressors, dryers, filters, and distribution sensors let an analytics engine calculate leak rate per zone, flag abnormal load/unload cycling that signals leaks or artificial demand, and trigger filter replacement on differential pressure before excessive drop forces the compressors to overwork. Plants that move from periodic audits to continuous analytics routinely uncover several times the leaks a manual survey found — and the ranked repair list means the first work order fixes the biggest bill, not the loudest fitting.
Oxmaint for Compressed Air
How Oxmaint Runs Air System Maintenance
-
Zone Leak Rate
Waste Ranked by Cost
Calculate leak percentage per distribution zone so repair is prioritized where waste is highest — not where the noise is loudest — turning a leak list into an ROI-ordered work queue.
-
Filter & Dryer PM
Replace on Pressure Drop
Monitor differential pressure across each filter stage and trigger replacement work orders before excessive drop forces compressor overwork — with dryer dew point trended against its 3–7°C target.
-
Cycle Analytics
Abnormal Cycling, Flagged
Load/unload cycle deviation alerts surface leaks, pressure regulator faults, and artificial demand automatically — the patterns that show a system compensating rather than performing.
-
Compressor PM
Condition Over Calendar
Trend discharge pressure, temperature, oil condition, vibration, and power draw per compressor so valve faults, bearing degradation, and cooling inefficiency are caught before an unplanned shutdown.
-
Digital Audit
Five Zones, One Checklist
Run the compressor room, treatment, distribution, end-use, and metering audit as a digital inspection linked to equipment assets — documenting findings and building a continuous improvement record.
-
Energy Baseline
Prove the Repair Paid
Log runtime, kWh, and system pressure across production and idle periods to hold a specific-power baseline — so every leak repair and pressure reduction shows up as a number, not a claim.
Frequently Asked
Compressed Air Maintenance Questions
How much compressed air does a typical plant waste?
Between 25% and 35% of everything generated is lost before it reaches a tool, primarily through pipe leaks, pressure mismatches, and compressor inefficiency. Leaks alone commonly account for 20–30% of compressor output, and a typical plant runs 50 or more leak points simultaneously — cumulatively equivalent to operating an extra compressor continuously just to replace wasted air. Detection and repair can bring leakage below 10% of compressor volume. Sign up for Oxmaint to measure your leak rate by zone.
Why is raising system pressure such an expensive fix?
Because it costs energy twice. For systems in the 100 psig range, every 2 psi increase in discharge pressure raises energy consumption by roughly 1% at full load — and plants routinely run 20 to 40 psi above what end-use equipment actually requires. Worse, the higher pressure pushes more air through every existing leak, so the waste that caused the pressure drop now grows. Reducing pressure to the true end-use requirement is one of the highest-return actions available.
Is an annual leak survey enough?
It is a snapshot, not a program. A manual ultrasonic survey captures system performance at a single point in time and typically detects only 40–50% of actual leaks, missing emerging problems that develop between audit dates. In the meantime pressure drops get compensated by throttling compressors higher and consumption climbs invisibly. Continuous monitoring of pressure, flow, and runtime detects leaks within days rather than months, and ranks them by actual energy impact. Book a demo to see continuous detection in action.
Why do filters and dryers matter beyond energy?
Because air treatment protects the process and the pipe. A saturated dryer, clogged coalescing filter, or failed separator passes moisture and oil aerosols into distribution — corroding pipework, contaminating end-use equipment, and generating product-quality rejections that dwarf the cost of a filter change. Clogged filters also raise intake restriction and increase compression work by 5–15%. A refrigerant dryer in good condition delivers a 3–7°C pressure dew point at rated flow. Sign up for Oxmaint to trigger filter changes on differential pressure.
Detect · Repair · Lower Pressure · Measure
Treat Air Like the Utility It Is
Every untagged leak, every psi of unnecessary pressure, and every filter changed on a calendar instead of a pressure reading is money leaving the plant through a fitting nobody is watching. Oxmaint gives manufacturing teams one platform to calculate leak rate by zone, replace filters on differential pressure, flag abnormal compressor cycling, run the five-zone audit as a digital inspection, and hold an energy baseline — so the most expensive utility in the plant becomes the most controlled one.