Condition monitoring for valves (control & safety) is the practice of continuously tracking vibration, temperature, acoustic emissions and process variables to detect early fault signals like stiction, leak-by and seat wear weeks before a failure escalates. Modern control and safety valve reliability programs rely on these early warning signals to shift maintenance from reactive firefighting to condition-based intervention — cutting unplanned downtime by 30–50% and extending asset life. This guide covers the most effective condition monitoring techniques, sensor placement strategies, threshold setting and the workflow needed to turn abnormal readings into scheduled repairs. By pairing these methods with OxMaint's AI-powered CMMS, your team can automatically convert sensor data into actionable work orders. Start Free Trial to close the loop between detection and repair.
Are your control & safety valves failing between scheduled overhauls?
Up to 70% of unplanned valve failures produce detectable early warning signals 2–6 weeks in advance. Without online monitoring, those signals go unnoticed — and a single emergency shutdown on a critical control valve can cost $12K–$250K per incident in lost production. OxMaint turns every abnormal reading into an automatic work order so your team acts before the failure, not after.
Best Condition Monitoring Techniques for Valves (Control & Safety)
Not every valve needs every sensor. The right combination depends on valve type, criticality ranking (ISO 55000), operating duty and the failure modes most likely for that service. Here are the five techniques that consistently deliver the highest detection rates for control and safety valve health monitoring.
Vibration Monitoring
Accelerometers on the valve body and actuator mounting detect stem friction, guide wear and packing degradation. Baseline RMS velocity below 3.5 mm/s is typical for healthy control valves; sustained increases of 40–60% signal developing mechanical looseness or stiction.
Temperature Monitoring
RTDs and thermocouples on valve bodies track process temperature deviations that indicate internal leak-by, cavitation or flashing. A 15–25°C rise above baseline on a control valve outlet often points to seat erosion or insufficient flow capacity.
Acoustic Emission
High-frequency acoustic sensors detect leak-by through seats and partial valve openings — often the earliest sign of seat wear in safety relief valves. Detection thresholds typically sit at 35–55 dB above background for passing valves under full differential pressure.
Positioner Feedback
Smart valve positioners log valve travel, actuator pressure and response time. Tracking valve travel histogram deviations and hysteresis greater than 5% reveals stiction and packing friction before they impact loop control performance or product quality.
Oil & Lubricant Analysis
For actuator gearboxes and hydraulic systems, quarterly oil analysis catches metal particle counts, viscosity loss and water ingress. Particle counts above ISO 4406 code 18/16/13 correlate with accelerated gear and bearing wear in pneumatic actuators.
Process Parameter Trends
Flow rate, pressure drop and controller output trends reveal developing valve faults. A gradual increase in controller output above 80% to maintain setpoint signals loss of valve capacity due to seat wear, cavitation damage or debris accumulation in the trim.
How to Set Up Valves (Control & Safety) Online Monitoring — Step by Step
A phased rollout over 6 months lets you prove ROI on critical assets before scaling. Each phase delivers measurable value — from baseline establishment to full predictive coverage.
Asset Criticality Ranking
Rank valves by consequence of failure (safety, production loss, environmental). Tag the top 15–20% as criticality A — these receive full condition monitoring coverage first. Document failure modes (FMEA) for each: stiction, leak-by, seat wear, spring fatigue, packing failure.
Sensor Selection & Placement
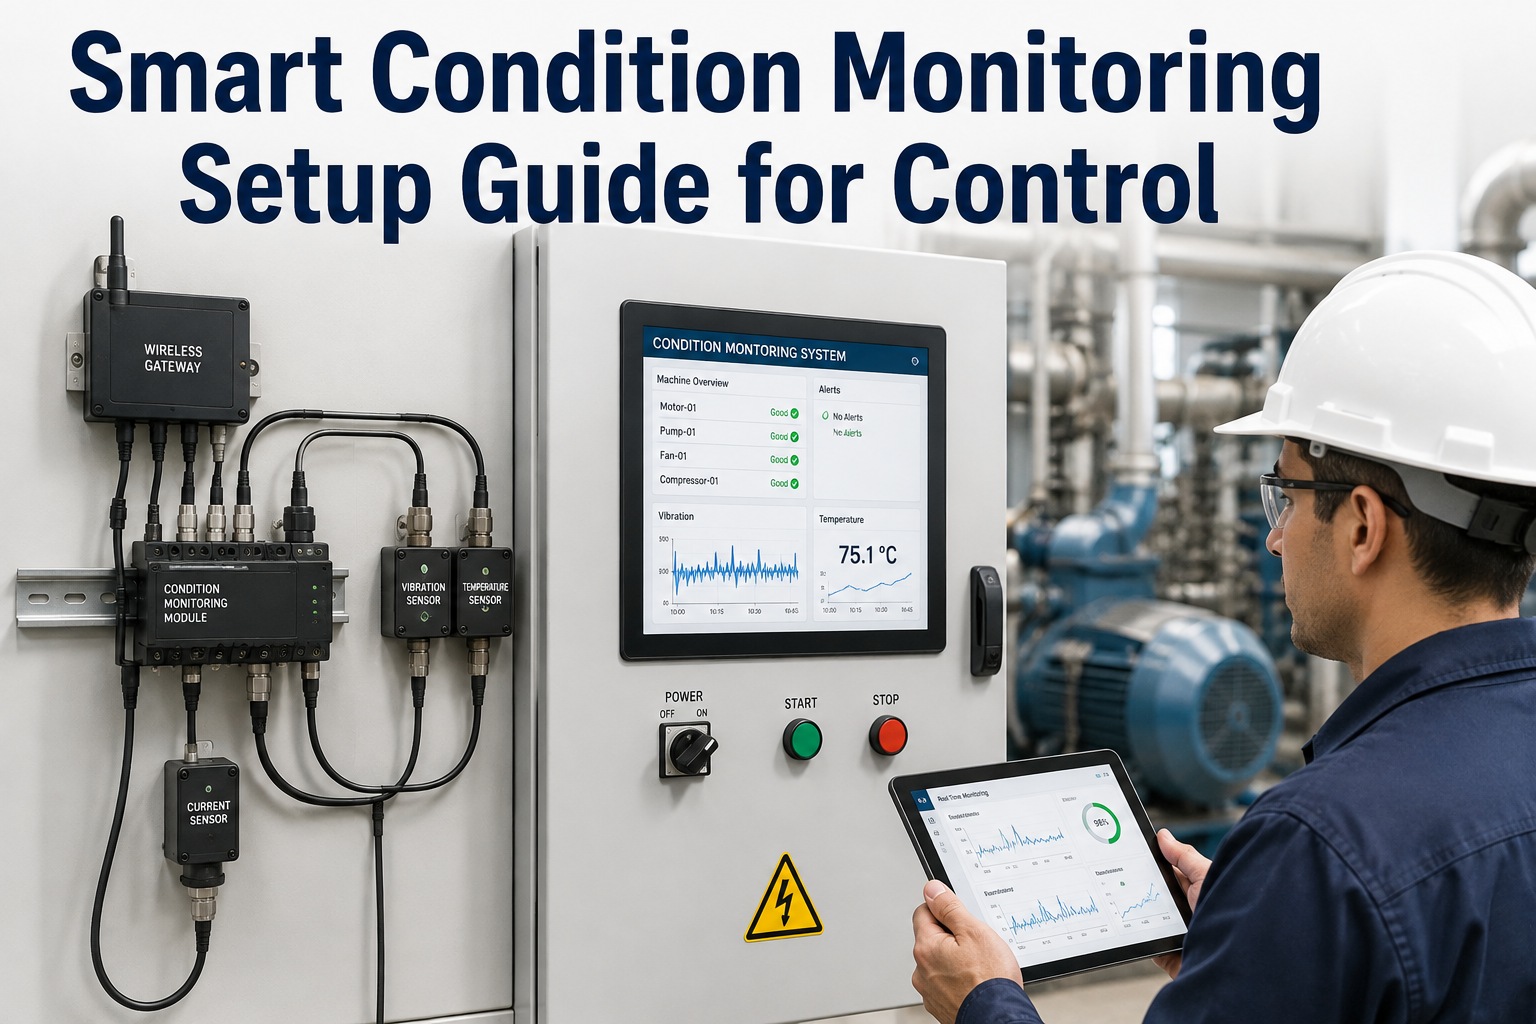
Install vibration sensors on actuator yokes, temperature sensors on valve bodies downstream, and acoustic sensors on discharge piping. Connect smart positioners via HART, Foundation Fieldbus or wireless gateways. Sensor placement within 150mm of the stem packing yields the strongest signal.
Baseline Establishment
Collect 30–60 days of stable-operation data to establish baseline signatures. Record vibration spectra, temperature profiles, valve travel histograms and response times under normal load. Baseline standard deviation defines your warning and alarm threshold bands.
Threshold Configuration
Set warning thresholds at mean + 2σ and alarm thresholds at mean + 3σ, or use ISO 10816 velocity zones (Zone A/B/C/D). Configure rate-of-change alarms for rapid degradation. Map each alarm to a predefined recommended action and priority level in OxMaint.
Workflow Automation
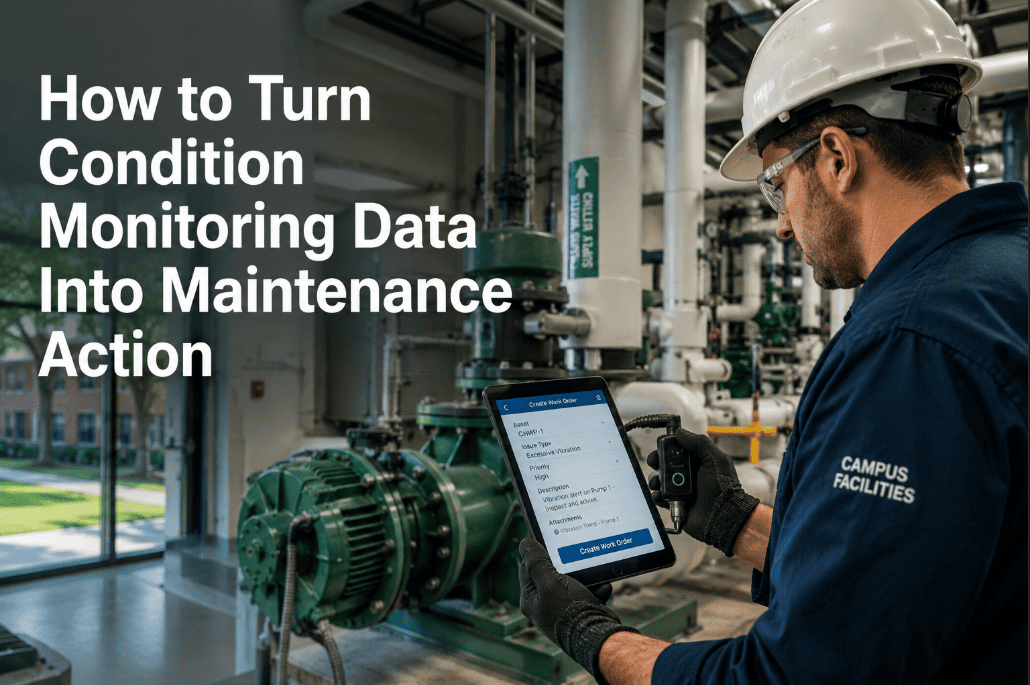
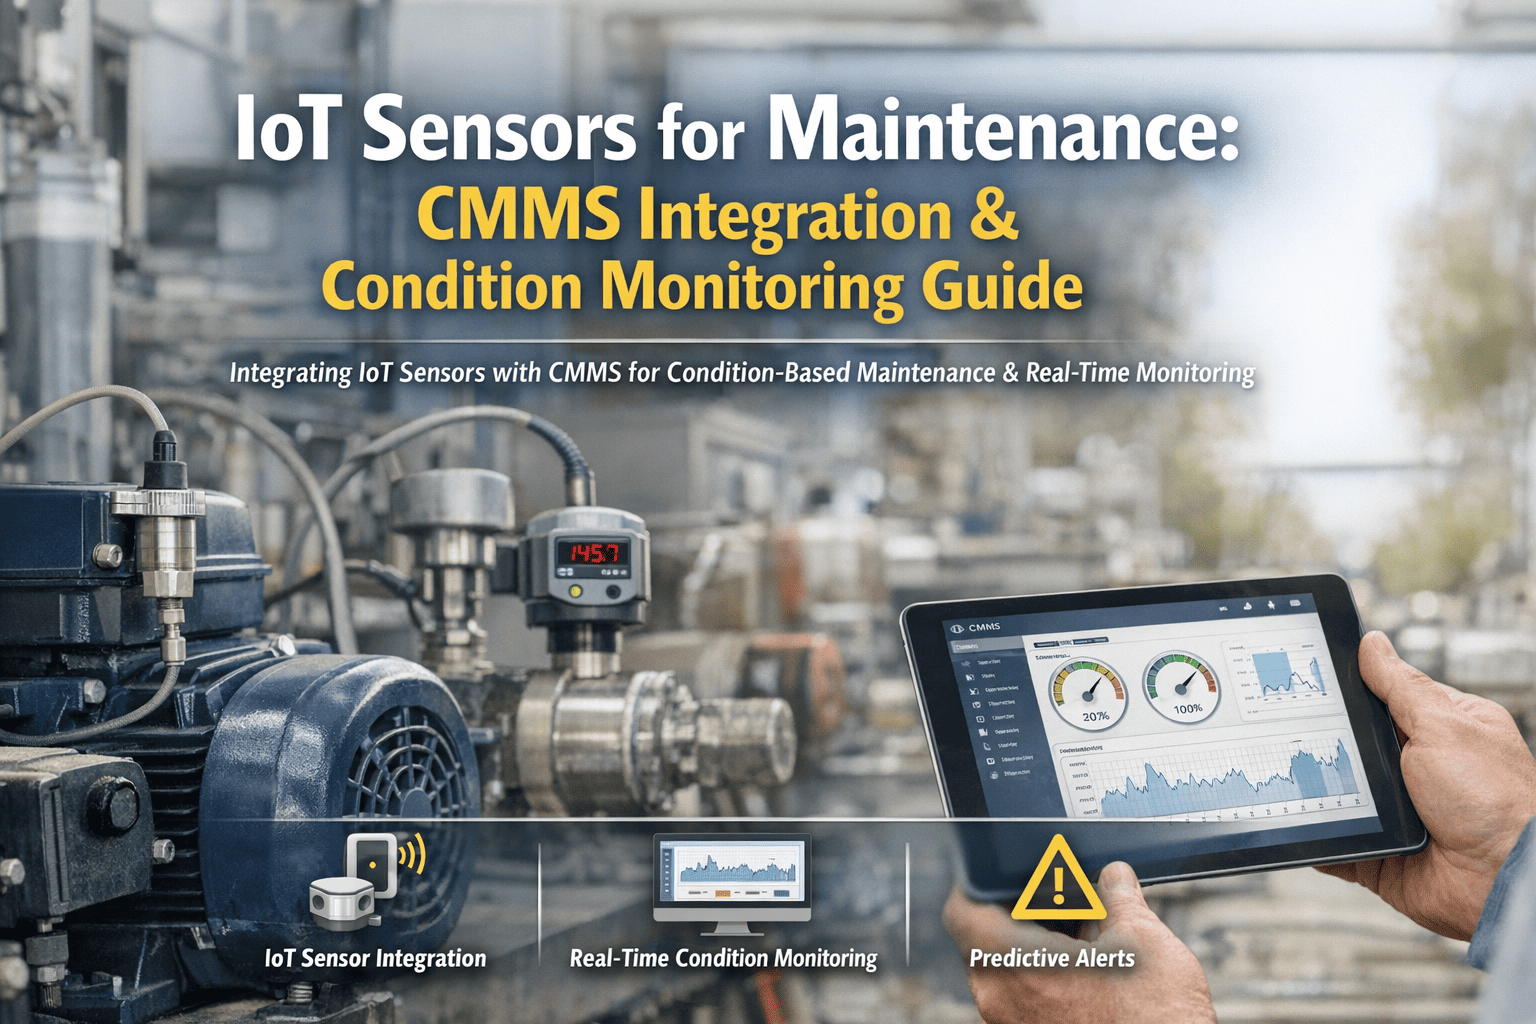
Connect sensor data streams to OxMaint so threshold breaches auto-generate work orders with the asset's trend chart, fault diagnosis and recommended repair procedure attached. Technicians receive mobile notifications; planners see scheduled windows — no manual data entry required.
Review & Optimize
Analyze detection accuracy, false alarm rates and intervention outcomes. Adjust thresholds, add assets and expand to lower-criticality valves. A well-tuned program typically achieves 85%+ detection accuracy with fewer than 10% false alarms within two quarters.
Early Fault Detection in Action: A 180-Valve Petrochemical Plant
Consider a mid-sized petrochemical plant with 180 control and safety valves, spending $42K annually on reactive repairs and losing an average of 22 production hours per year to unplanned valve failures. Here is how condition monitoring changes the economics.
Valves inspected on fixed 12-month intervals regardless of condition. Failures discovered during operation. Maintenance team spends 60% of time on emergency response.
Top 36 critical valves instrumented. OxMaint auto-generates work orders on threshold breach. Failures predicted 3–5 weeks ahead. Maintenance team reallocates 60% of time to preventive work and reliability improvement projects.
Valves (Control & Safety) Vibration & Temperature Monitoring Thresholds
Thresholds must be asset-specific. Generic defaults cause false alarms on high-duty valves and missed faults on low-activity service. Use these ISO 10816-aligned reference bands as a starting point, then narrow them using your baseline data.
| Monitoring Parameter | Normal Zone (A/B) | Warning Zone (C) | Alarm Zone (D) | Likely Fault Mode |
|---|---|---|---|---|
| Vibration velocity (mm/s RMS) | 1.0 – 3.5 | 3.6 – 7.1 | > 7.1 | Stiction, guide wear, looseness |
| Temperature rise above baseline (°C) | 0 – 10 | 11 – 20 | > 20 | Leak-by, friction, cavitation |
| Acoustic emission (dB above background) | 0 – 25 | 26 – 45 | > 45 | Seat wear, internal passing |
| Valve hysteresis (% of span) | 1 – 3 | 4 – 6 | > 6 | Packing friction, stem binding |
| Response time (sec vs baseline) | +0 – 15% | +16 – 35% | > +35% | Actuator degradation, air supply |
| Controller output saturation (% open) | 30 – 75 | 76 – 85 | > 85 | Loss of capacity, trim erosion |
How OxMaint Closes the Condition Monitoring Loop
Sensors generate data — but data alone does not prevent failures. OxMaint's AI-powered CMMS converts condition monitoring signals into scheduled, documented, cost-tracked interventions. Here is what changes when your monitoring data flows into OxMaint.
Auto-Generated Work Orders
When a vibration, temperature or acoustic threshold breaches, OxMaint creates a priority-ranked work order with the fault type, trend chart, asset history and recommended repair procedure pre-attached — zero manual entry, zero missed alarms.
Predictive AI Diagnostics
OxMaint's AI engine analyzes trend patterns across all monitored valves, comparing degradation curves against historical failure signatures to forecast remaining useful life — so planners can schedule interventions during planned turnarounds.
Full Asset Reliability History
Every reading, alarm, work order, spare part used and technician note is permanently logged against each valve's asset record. Audit-ready reports for IEC 61511, OSHA PSM and ISO 55000 compliance are one click away.
Spare Parts Pre-Staging
When OxMaint predicts a valve intervention, it checks spare parts inventory for seat kits, packing sets and actuators — and auto-generates purchase requisitions for missing items so parts arrive before the scheduled repair date.
"We instrumented 42 critical control valves and connected the data to OxMaint. In the first quarter alone, the system flagged three developing seat-wear failures and auto-generated work orders before any operator noticed a process deviation. Our unplanned valve downtime dropped from 19 hours to 4 hours per year."
See OxMaint on your valves — book a 30-min demo
Watch how sensor thresholds trigger automatic work orders, how AI predicts remaining useful life, and how your team shifts from reactive to predictive in one platform. No pressure, no slides — just your assets in OxMaint.
Frequently Asked Questions About Valve Condition Monitoring
What is condition monitoring for valves (control & safety)?
Condition monitoring for valves (control & safety) is the continuous or periodic measurement of vibration, temperature, acoustic emission, positioner feedback and process parameters to detect developing faults like stiction, leak-by and seat wear before functional failure occurs. Unlike fixed-interval preventive maintenance, it triggers interventions based on actual asset condition — typically providing 2–6 weeks of advance warning.
Which sensors are best for valves (control & safety) health monitoring?
For control valves, smart positioner feedback combined with vibration sensors on the actuator yoke provides the highest detection rate for stiction and mechanical wear. For safety valves, acoustic emission sensors are the gold standard for detecting internal leak-by through seats. Temperature sensors on the valve body add a third layer for thermal fault detection. You can connect all three data streams into OxMaint — Start Free Trial to see how.
How do you set warning and alarm thresholds for valve monitoring?
Collect 30–60 days of baseline data under normal operating conditions, then set warning thresholds at mean + 2 standard deviations and alarm thresholds at mean + 3σ. Alternatively, use ISO 10816 vibration severity zones (A through D) as reference bands. Refine thresholds quarterly based on false alarm rates and actual failure data to improve detection accuracy.
How much does a valve condition monitoring program cost?
A typical program for 30–50 critical valves costs $15K–$45K for sensors, gateways and initial configuration, plus $6K–$18K per year for monitoring software like OxMaint. Most plants achieve payback in 4–8 months through reduced reactive repair costs, avoided unplanned downtime and extended valve life. A single avoided emergency shutdown on a critical valve often covers the entire first-year investment.
Can OxMaint integrate with existing valve sensors and positioners?
Yes. OxMaint accepts data from vibration sensors, temperature probes, acoustic monitors and smart valve positioners via standard industrial protocols including HART, Modbus, OPC UA and wireless gateways. Threshold breaches automatically generate work orders with trend data attached.Book a walkthrough to see integration with your specific sensor stack.
Stop catching valve failures after they happen
Join the maintenance teams using OxMaint to detect faults early, automate work orders and extend asset life — all in one AI-powered CMMS platform built for control and safety valve reliability.
Free 14-day trial · No credit card