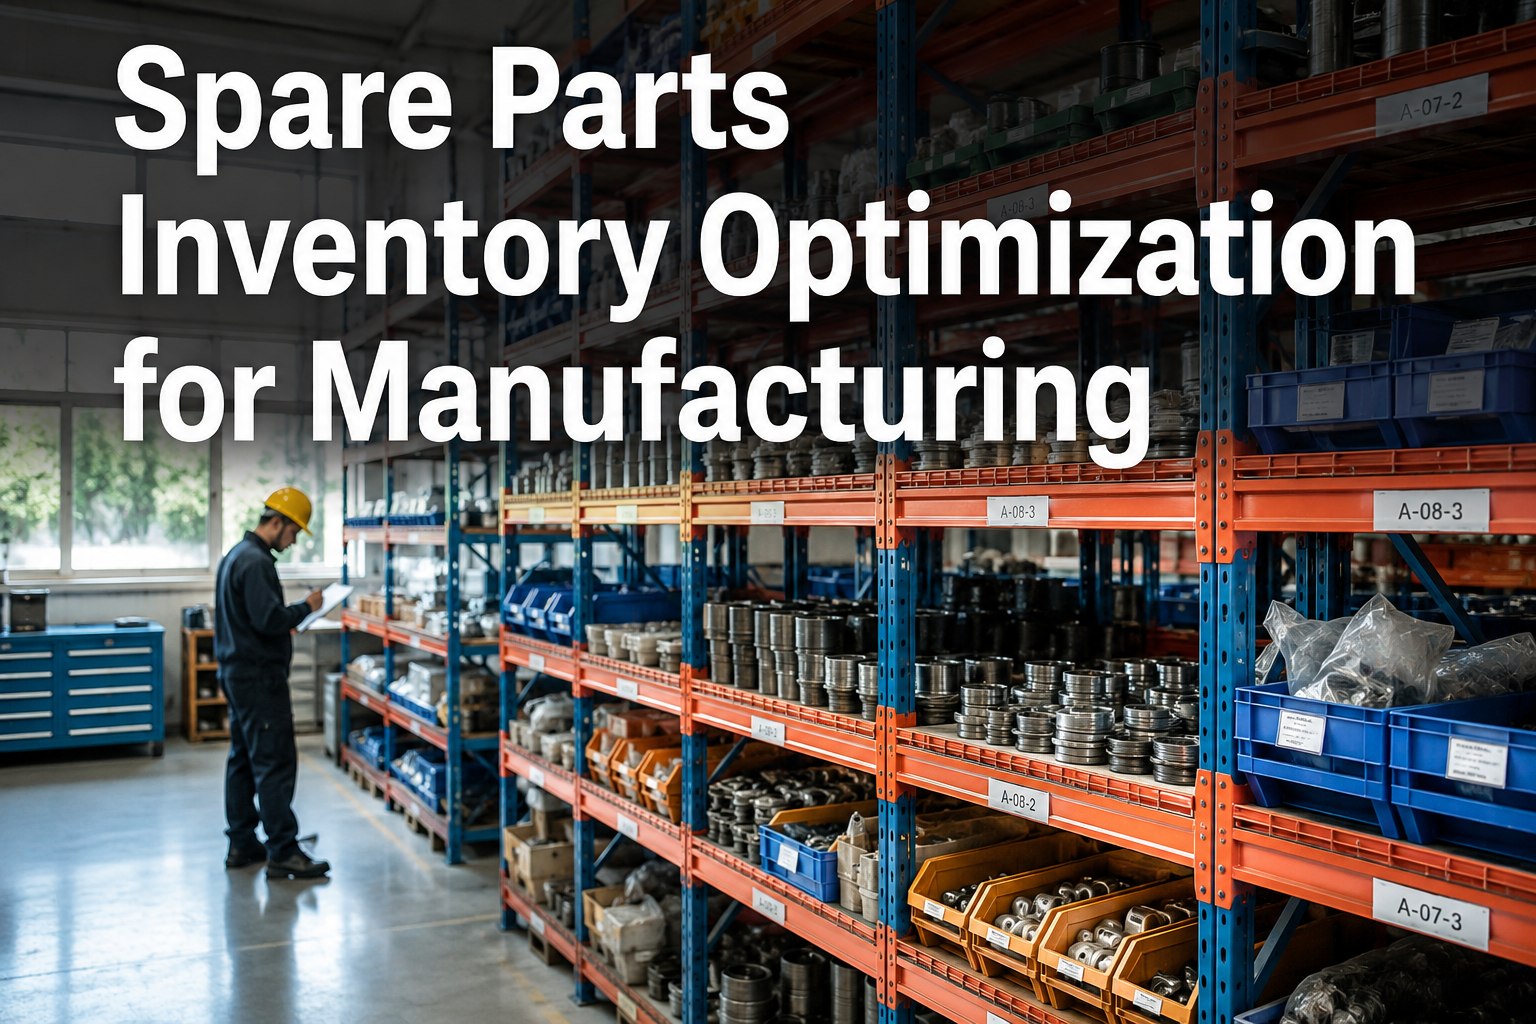
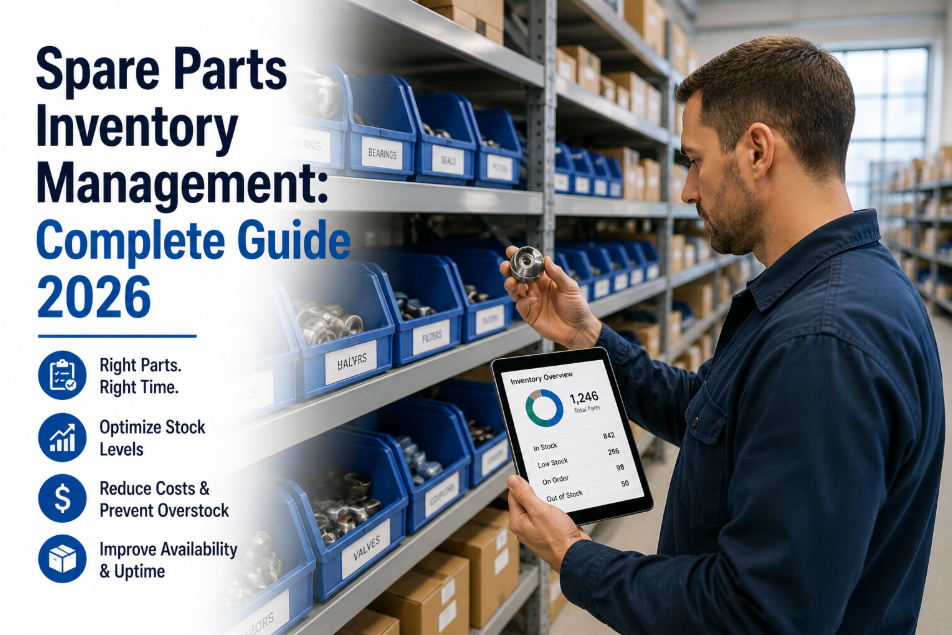
Spare parts inventory is the silent tax on every maintenance budget: industry benchmarks put MRO carrying cost at 18–30% of average inventory value per year, yet the typical plant still reports 15–25% dead stock and a stockout every few weeks on critical spares. The real fix isn't buying more—it's classifying what you already own by criticality, sizing min/max against actual lead-time demand, and letting the CMMS re-order instead of your most experienced tech. OxMaint turns that framework into a live MRO program; you can Start Free Trial to see your first ABC re-classification in under an hour.
A 15% stockout risk shouldn't cost you 30% in carrying fees.
Right-size every spare by criticality, lead-time and usage velocity — then let OxMaint re-order automatically. Stop paying warehousing rent on parts that never move while the one bearing you actually need is on back-order.
Your store-room is optimised for fear, not for throughput.
When a single hour of downtime costs $8,000–$25,000, maintenance teams do the rational thing: they hoard. The result is a store-room where 80% of value sits in 20% of SKUs that rarely move, while the 5% of parts that actually gate uptime are under-stocked. The numbers below are what that fear actually costs.
U.S. manufacturers hold an estimated $50B+ in spare-parts inventory at any given moment — much of it duplicating SKUs across sister plants that don't share visibility.
In plants without a CMMS-linked store-room, technicians spend an average of 6–14 hours per week just searching for parts, substitutes or kitting information.
Industry surveys consistently attribute 5–8% of unplanned downtime to "parts not available" — a category that is almost entirely preventable with proper min/max and lead-time planning.
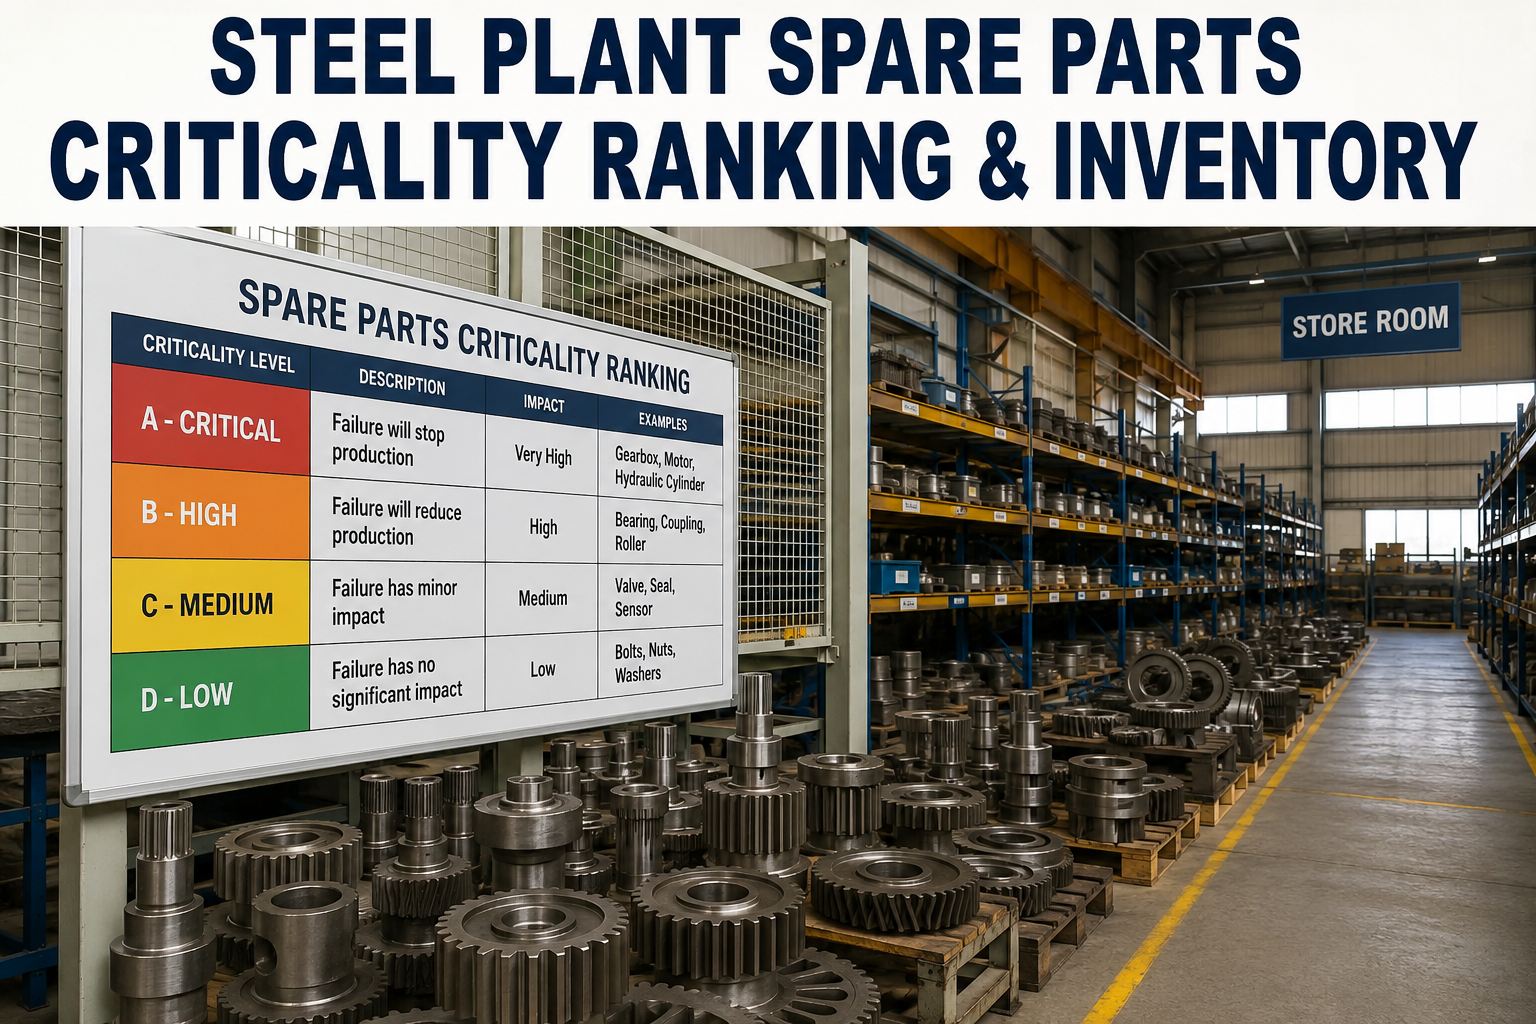
Three filters that decide whether a part deserves shelf space.
Most plants classify spares by annual spend alone — useful for procurement, useless for reliability. OxMaint layers three independent filters so a $4 bearing that stops a $2M line gets treated like the critical spare it actually is.
ABC by annual usage value
Pareto-classify every SKU by trailing-12-month issue value. A-items (top 20% of SKUs) typically hold 70–80% of value and warrant tight cycle counts; C-items (bottom 50%) are candidates for vendor-managed or on-demand supply.
Criticality rating per asset
Tag each spare to the asset it serves, then inherit that asset's criticality (1–4). A part on a Tier-1 production asset is stocked differently than the identical part on a redundant utility pump — even at the same unit cost.
Lead-time and substitution
A 3-day local distributor and a 14-week imported gearbox demand wildly different safety stock. OxMaint factors vendor lead-time, OEM vs. aftermarket, and approved substitutions into the reorder math automatically.
OxMaint calculates both per SKU, then layers a criticality multiplier: Tier-1 assets target 99% service level; Tier-4 assets run at 85–90% to avoid over-stocking low-impact spares.
Not every spare deserves the same shelf logic.
Once ABC, criticality and lead-time are set, the stocking policy writes itself. The table below is the default OxMaint policy matrix — editable per SKU, per plant, per season. The result: critical spares rarely stock out, insurance spares stay capped, and C-items migrate off the shelf entirely.
| SKU tier | Criticality | Stocking policy | Min / Max logic | Target service level |
|---|---|---|---|---|
| A · High-value, high-velocity | Tier 1–2 | Min/Max with auto-reorder | Min = LT demand + 2σ · Max = Min + EOQ | 99% |
| B · Medium velocity | Tier 2–3 | Min/Max with review | Min = LT demand + 1.5σ · Max = Min + 2× EOQ | 95% |
| C · Low velocity, low cost | Tier 3–4 | Vendor-managed or on-demand | Min = 0 · Max = 1 (or consignment) | 90% |
| Insurance / long-lead | Tier 1 only | Single-unit strategic stock | Min = 1 · Max = 1 (rotable) | 100% (risk-capped) |
| Dead stock candidate | Any | Flag for disposal / redeploy | No issue in 24 mo · no open WO | — |
From $42K in dead stock to a 99.2% fill rate in 90 days.
A 180-asset food-processing plant was spending $42,000/year carrying spares it never issued, while simultaneously recording 11 stockouts per quarter on critical motors and bearings. Here's what changed when they ran the OxMaint MRO program for one quarter.
- $42K annual dead-stock carrying cost
- 11 critical stockouts per quarter
- 2,840 SKUs, no criticality tags
- 9 hrs weekly parts-hunt time per tech
- $8.4K dead-stock carrying cost (-80%)
- 1 critical stockout in the quarter
- 1,910 active SKUs, 100% tagged
- 1.5 hrs weekly parts-hunt time per tech
Free up working capital without touching uptime.
Dead stock isn't harmless — every dollar of idle inventory is a dollar of working capital plus 18–30¢/year in carrying cost. OxMaint flags candidates automatically using a four-rule filter, then routes them to redeploy, return, scrap or sell.
No-issue rule
Flag any SKU with zero issues in the trailing 24 months AND no open work order referencing it. OxMaint runs this scan nightly across the full catalog.
Criticality cross-check
If the part serves a Tier-1 asset with no substitution, protect it as insurance stock regardless of velocity. Criticality overrides the no-issue rule.
Redeploy scan
Check sibling plants for open demand on the same SKU. OxMaint's multi-site view surfaces redeploy opportunities before you scrap or discount.
Disposition
Route the remainder: vendor return (if within window), aftermarket sale, controlled scrap, or — last resort — obsolescence write-off with full audit trail.
What a tuned MRO program feels like on the floor.
"We cut $58K of dead stock in the first quarter and didn't add a single stockout. The criticality layer is what made it safe — OxMaint knew which 'slow movers' were actually insurance parts we had to keep."
"Auto-reorder on min/max took the parts-hunting off my techs. The shift from 9 hours/week to under 2 is real time we put back into PM compliance — OEE on line 3 is up 4.1 points since we went live."
Tune your store-room in the next 14 days.
Upload your current BOM and issue history — OxMaint returns a full ABC + criticality re-classification, dead-stock hit list, and recommended min/max within the first session.
Five questions plant teams ask before going live.
How long does it take to see the first dead-stock savings?
Most plants see their first dead-stock hit list within 24 hours of importing a BOM and 12 months of issue history. The actual cash recovery depends on how aggressively you execute dispositions — plants that redeploy to sister sites or negotiate vendor returns typically free up 10–20% of working capital in the first 90 days. You can Start Free Trial and run the scan before your next storeroom count.
What if a part has no usage history — new equipment or a rare insurance spare?
OxMaint uses OEM-recommended initial stocking levels and lead-time-based safety stock for zero-history SKUs, then refines the min/max as actual demand data accumulates. For insurance spares on Tier-1 assets, the system defaults to a single-unit strategic stock and flags it for rotable consideration rather than treating it as dead stock.
Can OxMaint handle multi-site spare parts sharing?
Yes. The multi-site view lets you see aggregate demand across plants, surface redeploy opportunities before scrapping, and set plant-specific min/max while sharing a master SKU catalog. This is typically where the largest dead-stock savings come from — the same $1,200 valve sitting idle in Plant A is on emergency order in Plant B.
How does OxMaint decide service level per part?
Service level targets are inherited from the asset criticality tier: Tier-1 assets default to 99%, Tier-2 to 95%, Tier-3 to 90%, Tier-4 to 85%. You can override per SKU, but the criticality-driven default prevents the common failure mode where every part gets "just in case" 99% service — which is how carrying cost balloons in the first place.
Will it integrate with our existing ERP and purchasing workflow?
OxMaint exports approved reorder POs to most major ERPs and can run in a CMMS-only mode if you prefer to keep procurement in your existing system. To see the integration path for your specific stack, Book a Demo and we'll map it live.
Stop paying rent on parts you'll never install.
Run your first ABC re-classification and dead-stock scan in under an hour. OxMaint turns your MRO room from a cost center into a reliability advantage.
Free 14-day trial · No credit card

.png)
