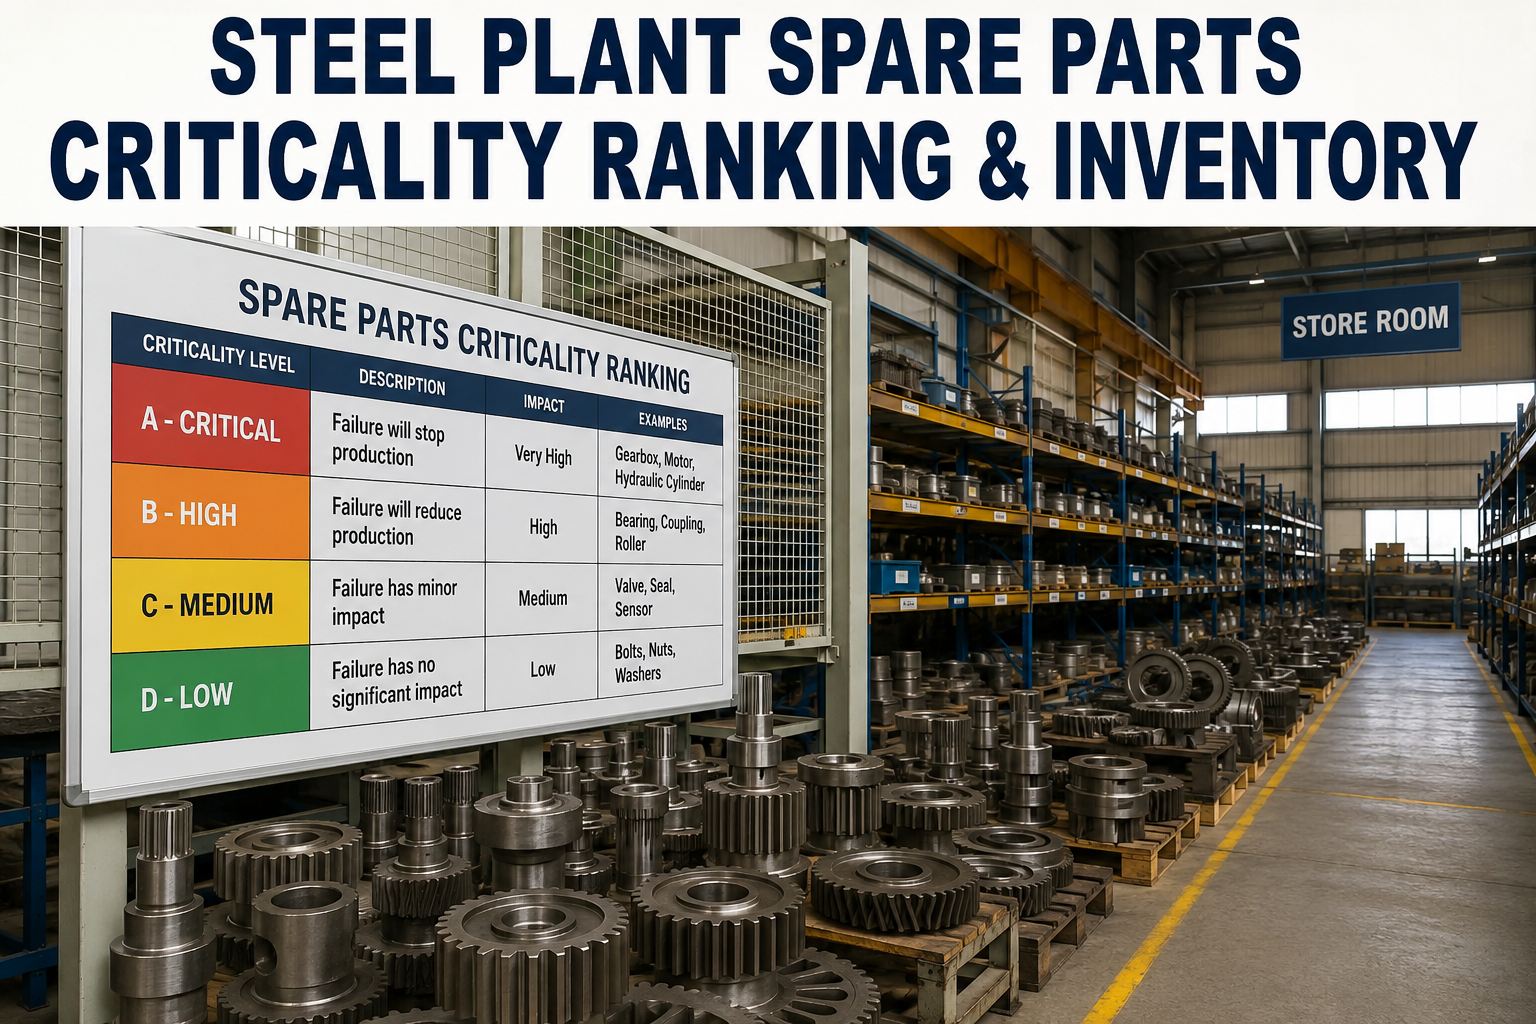
A steel plant storeroom is a paradox. A $180,000 EAF transformer bushing sits on a shelf for eight years without being touched, while a $12 bearing race that stopped a caster last Tuesday is on backorder for six weeks. The plant is simultaneously overstocked and out of stock — carrying millions in dead inventory and paying air-freight premiums for parts that should have been on hand. This is what happens when every spare part is managed with the same flat logic: reorder when low, hope for the best. World-class steel operations solve it with criticality ranking — the discipline of scoring every SKU on operational impact, financial value, and demand predictability, then setting stocking policy from the score. Oxmaint is the maintenance management software that runs this framework for steel plants: ABC-VED criticality matrices, automatic reorder triggers, and consumption-based demand forecasting built directly on top of your asset hierarchy. Start a free Oxmaint trial to run the criticality ranking on your steel plant storeroom, or book a demo to see the inventory framework mapped to your MRO catalogue.
Steel Plant · MRO Inventory · Spare Parts Software
Steel Plant Spare Parts Criticality Ranking & Inventory Optimization
The four-tier framework, the scoring matrix, the reorder-point formula, and the CMMS setup that cuts steel plant storeroom cost 20–30% while keeping the critical spares available every shift.
-
40–50%
of steel plant maintenance spend sits in MRO spare parts inventory
-
20–30%
of inventory value is consumed annually just to hold it — warehousing, obsolescence, cost of capital
-
23%
less inventory held by plants running risk-segmented stocking — while hitting 98% service levels (Bain)
-
18 mo
typical lead time on custom mill rolls and EAF transformer components — the parts that must be stocked
The Storeroom Paradox
Why Steel Plant Storerooms Overflow and Stock Out at the Same Time
A steel plant storeroom carries a fundamentally different problem from a production warehouse. Demand is intermittent and driven by unpredictable failure, not by production schedule. Most linear forecasting techniques break on "lumpy" MRO consumption. Meanwhile the cost of a wrong bet is asymmetric — an unnecessary bearing costs a shelf space, a missing tuyere costs $500,000 an hour of blast furnace downtime. This is the reality that a flat "reorder when low" policy cannot handle.
-
01
Intermittent, Failure-Driven Demand
A gearbox seal used twice in six years cannot be forecast the same way as monthly HVAC filters. Standard usage-based reordering triggers on the wrong parts.
-
02
Asymmetric Failure Cost
A missing consumable is inconvenient. A missing insurance spare on a critical asset is a multi-million-dollar event. The stocking policy must reflect the downside, not the average.
-
03
Extreme Lead Times on the Vital SKUs
Custom-forged mill rolls, high-voltage transformers, and specialty castings run 12–24 months to procure. If it is not on the shelf when the asset fails, production waits — for months.
-
04
Duplicate SKUs and Dead Stock
Multi-generational storerooms accumulate parts for equipment that was decommissioned a decade ago. Without a purge discipline, 15–25% of inventory has zero probability of ever being consumed.
The Four-Tier Criticality Pyramid
The Framework Every SKU Falls Into
World-class steel plants classify every part into one of four criticality tiers, based on what happens if the part is not available when the asset needs it. The tiers drive stocking policy, safety stock levels, review frequency, and where capital gets deployed. This is the pyramid, from top-heavy financial exposure down to high-turnover consumables.
Vital · Insurance Spares
~10% of SKUs · ~40% of inventory value
Absence causes immediate production stoppage, safety incident, or environmental violation. Stocked at 99.9% availability regardless of turnover — the SKU is a financial insurance policy.
Essential · Critical Operating Spares
~20% of SKUs · ~30% of inventory value
Loss causes degraded operation or scheduled downtime within days. Stocked with safety buffer, replenishment tied to consumption rate and lead time.
Important · Routine MRO
~30% of SKUs · ~20% of inventory value
Loss delays repairs but production continues. Standard EOQ ordering, monthly review cycles, min-max reorder policy.
Standard · Consumables & General
~40% of SKUs · ~10% of inventory value
Fasteners, filters, PPE, general lubricants. Vendor-managed inventory or point-of-use bins. Zero specialized stocking discipline required.
The rule the pyramid reveals: 30% of the SKUs (Vital + Essential) protect roughly 90% of the potential downtime exposure — and that is exactly where the capital and the discipline belong.
The Classification Matrix
The Four Factors That Score Every Part
Sorting a 40,000-line MRO catalogue into four tiers by intuition is impossible. Every part gets a score — the sum of four weighted factors that any steel maintenance engineer can defend to Finance. Oxmaint runs this matrix inside the software, keeping the score against every SKU and re-scoring automatically as consumption history and asset criticality change.
| Scoring Factor | Low (1) | Medium (3) | High (5) |
|---|---|---|---|
| Production Impact | Cosmetic / non-critical | Delayed repair | Immediate stoppage |
| Failure Probability | Once in 10+ years | Once a year | Multiple times a year |
| Lead Time to Procure | Under 7 days | 1–3 months | 6+ months |
| Vendor Availability | Multiple sources, stock | Single approved source | Custom OEM only |
| Safety Consequence | None | Reportable incident | Life-safety / regulatory |
Score sum >= 20: Tier 1 Vital · 15–19: Tier 2 Essential · 10–14: Tier 3 Important · below 10: Tier 4 Standard. The threshold cuts are configurable in Oxmaint per plant policy.
Real Steel Plant Examples
What Parts Actually Sit in Each Tier
The framework is not abstract. Every steel plant will recognize the parts in each row of this table — the mill roll that took 14 months to procure, the caster nozzles used every heat, the fastener bins nobody counts. This is the ranking applied to real steel plant MRO, mapped to the stocking policy Oxmaint sets in the CMMS automatically.
T1 · Vital
EAF transformer, mill rolls, custom refractory shapes, tuyere copper coolers
Stocked at 100% availability. 12–24 month lead times. Insurance-grade holding regardless of turnover.
T2 · Essential
Large bearings, gearbox assemblies, drive motors, hydraulic power packs, stave cooling elements
Safety stock plus consumption-based reorder. Multi-source qualification recommended.
T3 · Important
Caster nozzles, standard bearings, valve rebuild kits, control-system I/O modules, sensors
Standard EOQ with min-max reorder. Monthly review, single-source acceptable.
T4 · Standard
Fasteners, general lubricants, filters, PPE, standard cable, welding consumables
Vendor-managed inventory or point-of-use bins. No storeroom counting.
The 90/10 Rule
30% of the SKUs Protect 90% of the Downtime Exposure
Once the criticality ranking runs, one thing becomes obvious inside the software: the vast majority of storeroom risk sits in Tier 1 and Tier 2 SKUs. That is where the safety stock, the multi-source qualification, and the daily cycle counts belong. Everything below Tier 3 is a candidate for vendor-managed inventory. Oxmaint puts the discipline in the right place — automatically.
The Reorder Point Formula
How Every Tier Sets Its Reorder Point Differently
The reorder point (ROP) formula is universal. The safety-stock multiplier is not. Different criticality tiers demand different service-level assumptions — and pushing the wrong tier into a 99.9% policy is exactly what breaks a storeroom budget. Below is the formula and the tier-specific service levels Oxmaint sets by default.
The universal formula
The (Daily Usage × Lead Time) piece is the same for everyone. The Safety Stock component is what separates a Tier 1 policy from a Tier 4 policy.
-
T1
Vital · 99.9% Service Level
Safety stock sized for near-zero stockout probability. Insurance holding cost accepted. Multiple units for high-consequence assets.
-
T2
Essential · 98% Service Level
Safety buffer covers demand variability and lead-time variability. Automatic reorder triggers well ahead of stockout.
-
T3
Important · 95% Service Level
Standard EOQ economics. Reorder at min level. Acceptable to occasionally wait on delivery — production continues without the part.
-
T4
Standard · 90% Service Level or VMI
Vendor-managed replenishment. No formal storeroom safety stock. Bins replenished on-site by supplier under contract.
Where the Money Leaks
Six Places a Steel Plant Storeroom Loses Cash
The 20–30% annual holding cost is not spread evenly — it concentrates in a handful of specific waste categories. Every plant that runs a formal storeroom audit finds the same six leaks, and every one of them is a CMMS problem before it is a warehouse problem.
-
28%
Dead Stock & Obsolescence
Parts for decommissioned equipment nobody flagged. Eight-year-old bearings still in stock for a gearbox that was replaced in 2019.
-
22%
Duplicate SKUs
Same physical part, three different part numbers, three separate stock bins. Consolidation typically shrinks the catalogue by 15–20%.
-
18%
Emergency Freight Premium
Air-freight surcharges on parts that should have been on the shelf. Every 1% of emergency ratio drops adds real budget back.
-
14%
Over-Stocked Consumables
Two years of filters. Six months of fasteners. Overstock on cheap SKUs happens quietly and drains the budget by carrying cost alone.
-
10%
Inaccurate Bin Counts
Physical stock does not match the CMMS number. Reorders fire on ghost inventory. Cycle-count discipline closes the gap fast.
-
8%
No BOM Linkage
Parts not linked to the assets they serve. When the asset is retired, the parts stay in stock forever. BOM-linked SKUs auto-flag for review.
Built for Steel Plants
How Oxmaint Software Runs the Criticality Framework
-
Auto Scoring
Every SKU Scored on the Five-Factor Matrix
Oxmaint runs the classification matrix on every part in the catalogue, assigns a tier, and re-scores automatically as consumption history and asset criticality change over time.
-
BOM Linkage
Every Part Linked to the Assets It Serves
Bill of Materials linkage inside the software — every SKU tied to a machine, every machine tied to a work centre. Decommission an asset, its parts flag for review automatically.
-
Tier-Based ROP
Reorder Points Set to Tier Service Levels
Oxmaint sets safety stock to 99.9%, 98%, 95%, or VMI targets automatically by tier. No manual spreadsheet math, no accidental 99.9% on a consumable.
-
Duplicate Detection
Catalogue Consolidation Built In
Description matching and manufacturer part-number cross-reference flag likely duplicates during setup. Typical steel plant catalogue shrinks 15–20% in the first pass.
-
Dead Stock Alerts
Zero-Consumption Reports Every Month
Any part with zero movement across a configurable window automatically appears on the monthly obsolescence review. Purge decisions carry an audit trail.
-
Emergency Ratio
Emergency Purchase Ratio Tracked Live
Every rush order flags a stocking-policy gap. Oxmaint reports the emergency ratio per tier — target below 3% — and pinpoints exactly which SKUs need policy revisions.
Measured Outcomes
What Steel Plants Gain When Oxmaint Runs the Storeroom
-
20–30%
Storeroom Cost Reduction
Criticality-driven stocking reduces total inventory value 20–30% inside 12–18 months while raising service levels above 98%.
-
Below 3%
Emergency Purchase Ratio
Best-in-class steel plants keep emergency freight and rush orders under 3% of total procurement — Oxmaint holds the line.
-
15–20%
Catalogue Shrinkage
Duplicate SKU consolidation typically removes 15–20% of catalogue lines in the first optimization pass, without touching physical stock.
-
98%+
Vital Spares Service Level
Tier 1 vital spares maintained above 98% availability — the insurance policy always intact when the asset actually needs it.
Frequently Asked
Steel Plant Spare Parts Questions
Where should we start if we cannot classify every SKU immediately?
Start with the top 500 SKUs by inventory value and the top 100 SKUs by stockout frequency. That subset covers the majority of both financial exposure and operational risk. Oxmaint imports the initial classification and expands coverage over the following months. Sign up for Oxmaint to start the initial classification pass on your top SKUs.
What is a healthy inventory value as a percentage of asset value?
Best-in-class industrial facilities carry MRO inventory at 1.5–2.5% of Replacement Asset Value (RAV). Steel plants often sit at 3–5% before optimization. Getting the ratio into the target band typically frees 20–35% of tied-up capital.
Does the software handle vendor-managed inventory arrangements?
Yes. Tier 4 SKUs are routed to VMI or point-of-use bins inside Oxmaint. Vendor consumption reporting, replenishment logs, and periodic reconciliation all live in the CMMS. The maintenance team never counts a fastener again. Book a demo to see how Oxmaint runs VMI alongside criticality-ranked stocking.
How long does it take to see the 20–30% cost reduction?
Duplicate SKU consolidation and dead stock purge show up in the first 90 days. Reorder-point resetting drives the second wave over months 3–9. The full 20–30% inventory value reduction typically lands inside 12–18 months while service levels rise. Sign up for Oxmaint to start the first-90-day consolidation pass.
Classify · Stock · Save
The Same Storeroom Can Cost 30% Less and Deliver Higher Availability
Every dollar of inventory a steel plant carries has to earn its place through the criticality ranking. The Tier 1 insurance spares stay at 99.9%. Everything below Tier 3 goes to VMI or gets purged. Oxmaint runs the framework as the daily operating discipline of the storeroom — not a consulting engagement that ends after three months.


.png)
