On an integrated steel line, every stopped hour quietly burns between $100,000 and $500,000 in lost contribution margin — yet most plants still budget maintenance on last year's spend instead of on the downtime they actually prevent. The number that unlocks CFO approval for predictive maintenance isn't a vendor slide; it is a defensible, component-level model of what each stoppage truly costs. OxMaint gives reliability leaders the downtime-cause tracking, cost breakdown, and CMMS analytics needed to convert raw event logs into a board-ready reliability investment case. Start Free Trial and quantify your real loss in under 14 days.
What is one stopped hour actually costing your steel plant?
Unplanned downtime on an integrated steel line drains $100K–$500K per hour — yet most plants capture less than 40% of the true loss. Build a defensible, component-level cost model and turn reliability into a revenue conversation.
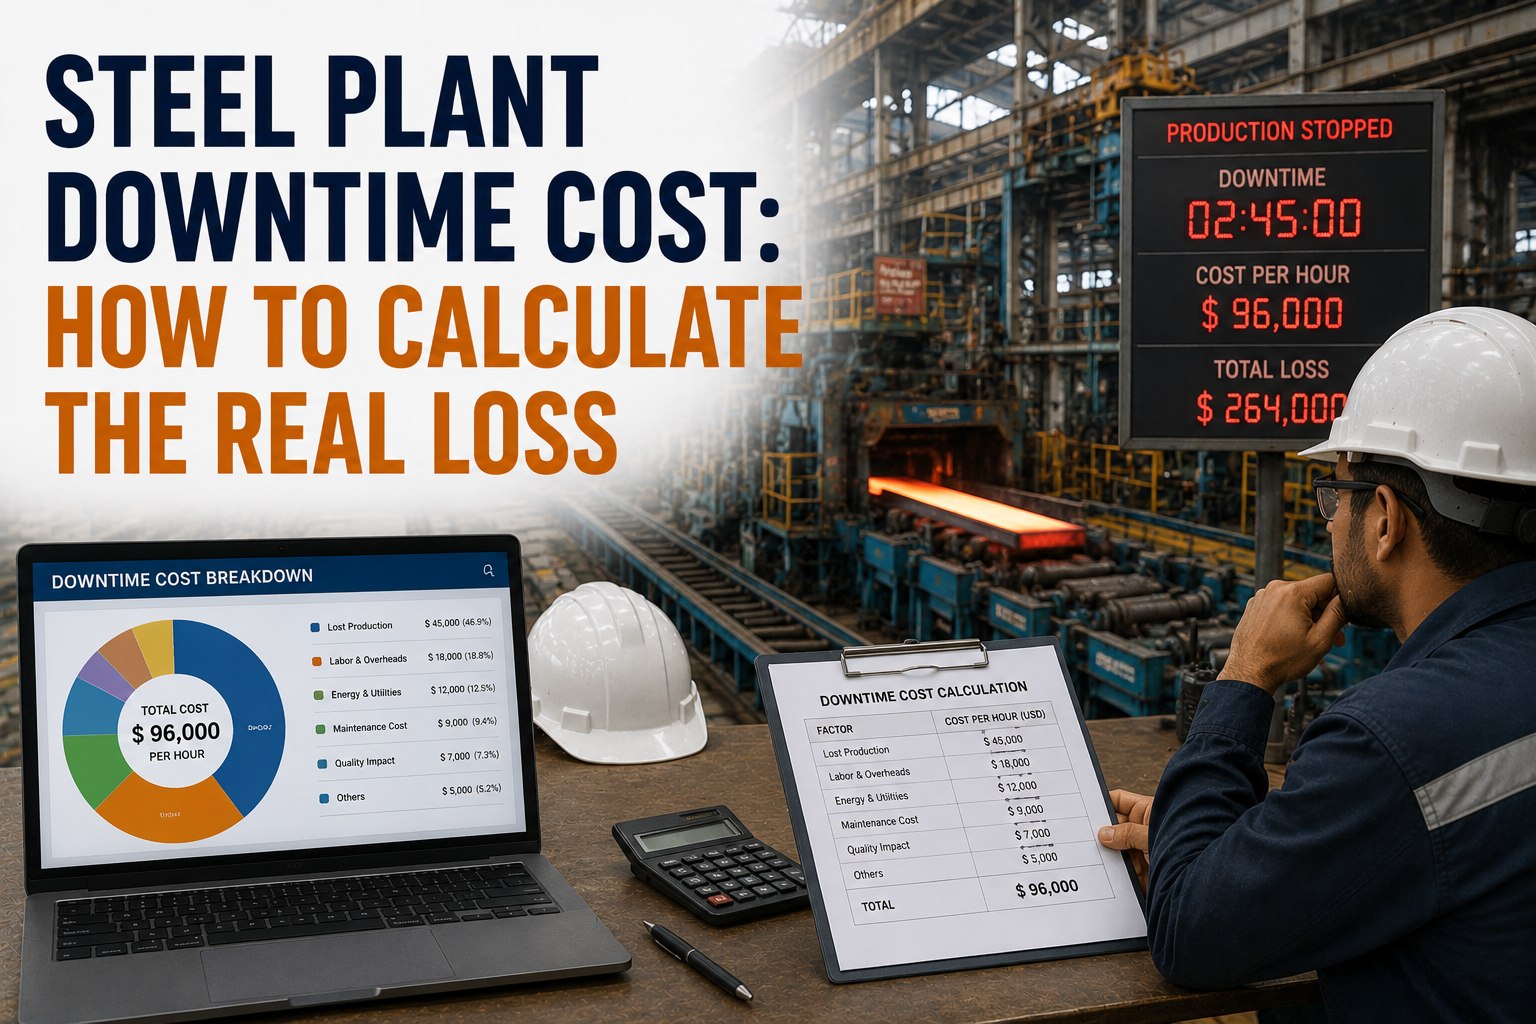
Six cost streams hiding inside every stoppage
A defensible downtime model separates visible costs (lost tonnes) from invisible ones (scrap, energy, contract penalties). These six streams — drawn from ISO 55000 life-cycle costing and TPM loss accounting — are what a CFO needs to see.
Lost Production Contribution
Hot tons that never get rolled × contribution margin per ton. On a 2.5MTPA hot strip mill at $45/ton margin, a single 6-hour delay costs roughly $820K in unrecovered profit.
Scrap & Reheat Fuel
Cobble events, slab reheats, and transition scrap from unstable restarts add 0.4–1.2% material loss and burn 8–15% extra coke-oven gas per tonne during ramp-down and ramp-up cycles.
Energy & Utilities Drift
Idle turbo-blowers, water-pump loops, and EAF electrodes keep drawing 4–9% of rated load with zero output. A 10-hour BF stoppage can add $60K–$120K in unrecovered power and gas.
Labor & Crew Idle Time
Operators, casters, and roll-shop crews remain on payroll during stops. At an average loaded rate of $38/hr across a 220-person shift, idle labor alone runs $8,360 per stopped hour.
Penalties & SLA Breach
Automotive and infrastructure OEM contracts carry 1–3% line-item penalties for missed delivery windows. One 14-hour caster failure can trigger $200K–$600K in contractual exposure.
Secondary Asset Damage
Forced restarts stress refractories, bearings, and crane motors — shortening MTBF by 12–20% and pushing the next planned overhaul 2–4 weeks earlier. Rare on a P&L; massive on a life-cycle ledger.
A CFO-approvable downtime cost equation
Use this single equation to convert every stoppage event in your CMMS into a rupee or dollar figure. OxMaint pre-populates each variable from work-order, sensor, and ERP data — no spreadsheets, no end-of-month reconciliation.
Caster failure at a 2.5 MTPA integrated plant
A continuous caster seizes a strand guide bearing and stops production for 9 hours. Throughput 320 t/hr × $45/ton margin = $14,400/hr lost contribution. Add $38K transition scrap, $72K energy drift, $75K idle labor, $0 penalty (absorbed by inventory), and $90K accelerated refractory wear.
Benchmark: cost of downtime by asset class
Not every stoppage is equal. A 4-hour delay at the blast furnace costs roughly 40× the same delay at a finishing line. Use this table to prioritise where predictive monitoring delivers the fastest payback.
| Asset Class | Avg. Duration / Event | Lost Contribution / Hr | Full Cost / Event | Annual Events (typical) | Annual Exposure |
|---|---|---|---|---|---|
| Blast Furnace | 18 hrs | $48,000 | $1.1M | 4 | $4.4M |
| Basic Oxygen Furnace | 6 hrs | $36,000 | $290K | 9 | $2.6M |
| Continuous Caster | 9 hrs | $14,400 | $404K | 14 | $5.6M |
| Hot Strip Mill | 5 hrs | $22,000 | $168K | 22 | $3.7M |
| Cold Rolling Mill | 3 hrs | $9,500 | $52K | 31 | $1.6M |
| Finishing Line | 2 hrs | $4,200 | $19K | 44 | $836K |
Build the case in four phases
OxMaint converts raw CMMS events into a CFO-approvable investment case in under 90 days. Each phase outputs a deliverable that procurement, finance, and operations can sign off independently.
Capture & classify every stoppage
Import 12–24 months of work-order and SCADA data. OxMaint auto-tags each event by asset, failure mode, and shift — surfacing the 8% of assets responsible for 60%+ of downtime cost.
Attach cost to every minute
Map each asset to its throughput, margin, energy draw, and labor rate. The platform calculates TDC for every historical event and benchmarks it against industry quartiles.
Model the predictive scenario
Run a digital twin of your top 20 critical assets with vibration, thermal, and oil analytics. OxMaint estimates avoidable hours, MTBF uplift, and spares inventory reduction.
Deliver the investment case
Generate a one-page NPV, IRR, and payback chart with sensitivity bands. Most OxMaint steel clients see 9–14 month payback and 6–11× first-year ROI on the reliability program.
Reliability leaders who put a number on the loss
Three OxMaint customers share what changed once downtime stopped being a vague pain and became a quantified, board-reviewed KPI.
"Our CFO wouldn't approve a $1.8M predictive maintenance program until we showed the $4.4M annual blast-furnace exposure in OxMaint. Approved in one meeting."
"We discovered 31% of our downtime cost was scrap and energy, not lost tonnes. That reframed our entire maintenance strategy within a quarter."
"The asset-class benchmark table alone justified the platform. We moved spares spend from finishing lines to the caster — and cut annual downtime 19%."
Stop guessing. Start quantifying every stopped hour.
Spin up OxMaint on your top 10 critical assets and produce your first defensible downtime cost report in 14 days.
Downtime cost modelling, answered
Why is our recorded downtime cost always lower than the real loss?
Most plants record only direct production loss (tons × margin) and omit scrap, energy drift, idle labor, and secondary damage. These hidden streams typically add 40–70% on top of the visible number. OxMaint's six-stream model captures all of them automatically from work-order, sensor, and ERP data.
How quickly can we produce a defensible downtime cost report?
Steel plants on OxMaint typically deliver a CFO-ready report in 10–14 days. The platform ingests 12–24 months of historical CMMS and SCADA data, auto-classifies events, and applies the TDC formula across every asset. You can Book a Demo to see a live walkthrough on steel-plant data.
What is a realistic payback period for predictive maintenance in steel?
OxMaint steel clients report 9–14 month payback and 6–11× first-year ROI. The fastest returns come from monitoring blast furnaces, BOFs, and continuous casters — where a single avoided event often pays for the entire annual platform subscription.
Do we need new sensors to start calculating downtime cost?
No. The cost model runs on data most plants already collect — work-order duration, asset master records, production throughput, and energy metering. OxMaint integrates with SAP PM, Maximo, Oracle EAM, and leading SCADA historians. Vibration and thermal sensors are added later for predictive scenarios.
How does OxMaint handle cascading and concurrent failures?
The platform's cascading-impact engine traces dependent assets — so a furnace stop that idles the caster and mill is costed as one event with downstream attribution, not three separate incidents. This prevents double-counting and reveals the true root-cause cost that single-asset analysis misses.
Turn every stoppage into a number your CFO will sign.
Join the steel plants that replaced gut-feel maintenance budgets with defensible, component-level downtime economics.
Free 14-day trial · No credit card