Every operations manager knows downtime hurts. What most don't know is exactly how much — until they sit down and calculate the real number. Not just lost production. Labor still on the clock. Scrap and rework. Overtime to catch up. Customer penalties. Equipment restart costs. Emergency technician callouts. When you add it all up, the average manufacturer loses $532,000 per hour of unplanned downtime in 2024 — up 50% from 2019 figures. That number is not a scare tactic. It is what you get when you stop estimating and start calculating. This page gives you the industry benchmarks, the cost breakdown framework, and the data to make the case for preventive maintenance investment with real numbers your CFO will take seriously. Want to see how Oxmaint tracks downtime costs automatically and prevents the failures driving them? start a free trial or book a demo to see live downtime dashboards built around your operation.
Downtime Analytics · Manufacturing · 2026 Data
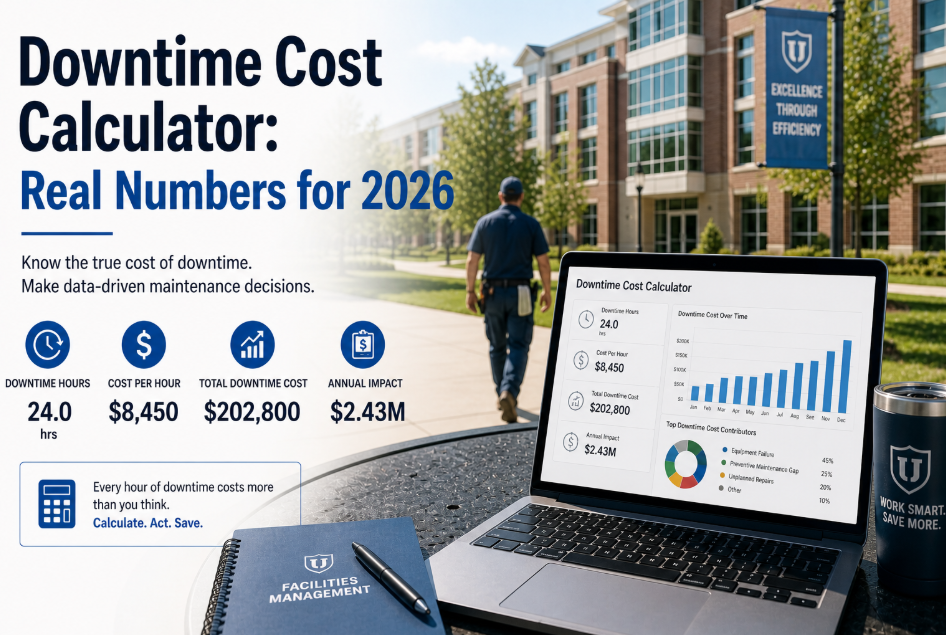
Downtime Cost Calculator: Real Numbers for 2026
Each downtime hour costs 50% more than 2019. Calculate your true exposure — then eliminate it.
$532K
average cost per hour of unplanned downtime in manufacturing (2024)
+50%
increase in downtime cost per hour since 2019 across all manufacturing sectors
800hrs
average annual unplanned downtime per facility running reactive maintenance
4.8x
cost multiplier — emergency repair vs. scheduled preventive maintenance
Oxmaint tracks every downtime event automatically — from the moment a work order opens to the moment equipment returns to service — and calculates real cost impact per asset, per site.
Start a free trial and connect your first asset in under 24 hours, or
book a demo to see downtime cost dashboards live.
What Actually Makes Up Your Downtime Cost
Most teams calculate downtime cost as lost production output only. That captures roughly 40% of the true number. The remaining 60% comes from six cost categories most facilities don't track.
~40%
Lost Production Revenue
Revenue not earned because the line stopped. Calculated as hourly output rate x margin per unit x hours down. The most visible cost — and still only the starting point.
Example: 500 units/hr x $80 margin x 4 hours = $160,000 lost
~18%
Idle Labor Cost
Production workers on the clock while the line is down. Payroll doesn't pause when the conveyor stops. In a 50-person facility at $32/hr, each downtime hour burns $1,600 in idle labor alone.
Example: 50 workers x $32/hr x 4 hours = $6,400 idle labor
~14%
Overtime Recovery Cost
After the line restarts, production must catch up. Overtime at 1.5x base rate plus employee fatigue effects on quality. Most facilities require 1.5-2 hours of overtime for every hour lost to unplanned downtime.
Example: 4hrs lost x 1.6 recovery ratio x 50 workers x $48 OT rate = $15,360
~12%
Emergency Repair Premium
Emergency technician callouts, expedited parts shipping, after-hours vendor fees. Emergency repair costs 4.8x more than the same repair planned in advance. A $400 PM part costs $1,900 on emergency order.
Example: $1,200 planned repair cost x 4.8 = $5,760 emergency equivalent
~9%
Scrap and Rework
Material in process at the time of failure that cannot be salvaged. Restart quality issues that produce defective output before the line stabilizes. Often underreported because it is categorized as quality cost, not downtime cost.
Example: 200 units in-process x $18 material cost = $3,600 scrap per incident
~7%
Customer and Contract Penalties
Late delivery penalties, customer SLA violations, expedited shipping costs to fulfill orders that could not ship on time. In automotive and food manufacturing, late delivery penalties can exceed the production revenue lost.
Example: Single automotive JIT delivery miss = $8,000-$50,000 penalty
Downtime Cost by Industry — 2026 Benchmarks
Downtime cost varies dramatically by industry because it is driven by margin per unit, line speed, and contract penalty exposure. These are verified 2024-2025 benchmarks from industry research.
| Industry |
Avg Cost / Hour |
Top Driver |
Annual Exposure (800 hrs) |
PM Savings Potential |
| Automotive Manufacturing |
$1,300,000+ |
JIT supply chain penalties + line shutdown cascades |
$1.04B+ |
Up to 70% reduction |
| Semiconductor / Electronics |
$1,100,000+ |
Clean-room restart costs + yield loss on batch |
$880M+ |
Up to 65% reduction |
| Oil and Gas / Petrochemical |
$900,000+ |
Safety shutdown protocols + regulatory reporting |
$720M+ |
Up to 60% reduction |
| Pharmaceuticals / GMP |
$600,000+ |
Batch loss + FDA documentation + revalidation cost |
$480M+ |
Up to 55% reduction |
| Food and Beverage |
$400,000+ |
Perishable spoilage + cold chain breach + retail penalties |
$320M+ |
Up to 50% reduction |
| Discrete Manufacturing |
$300,000+ |
Lost output + overtime recovery + customer delays |
$240M+ |
Up to 45% reduction |
| Consumer Goods / FMCG |
$180,000+ |
Promotional window losses + retailer fines |
$144M+ |
Up to 40% reduction |
| Logistics / Warehousing |
$80,000+ |
Delivery SLA penalties + throughput loss |
$64M+ |
Up to 35% reduction |
Annual exposure calculated at 800 hours unplanned downtime — industry average for facilities running reactive maintenance without CMMS. PM savings potential based on facilities transitioning to preventive maintenance with automated scheduling.
The Downtime Cost Calculation Framework
Step 1
Calculate Your Hourly Production Value
Units produced per hour x margin per unit = hourly production value. For a line producing 400 units per hour at $65 margin each, hourly production value = $26,000. This is your baseline revenue loss per hour down.
Hourly Production Value = (Units/hr) x (Margin per unit)
Step 2
Add Idle Labor Cost
Count every worker whose productivity is blocked when the line stops. Multiply headcount by their hourly rate. Don't forget supervision, quality staff, and warehouse personnel waiting on output from the stopped line.
Idle Labor Cost = (Affected headcount) x (Avg hourly rate)
Step 3
Factor the Emergency Repair Premium
Identify your average repair cost for the most common failure on this asset. Multiply by 4.8 to get the emergency equivalent. Subtract the planned repair cost to isolate the emergency premium you are paying per unplanned failure.
Emergency Premium = (Planned repair cost x 4.8) - Planned repair cost
Step 4
Estimate Scrap and Rework
Material in-process at failure x unit material cost. Add restart quality losses — typically 3-8% of production in the first 30 minutes after restart on most manufacturing lines as equipment re-reaches stable operating conditions.
Scrap Cost = (In-process units x material cost) + (Restart reject rate x output x material)
Step 5
Include Overtime Recovery
Most facilities require 1.5-2.0 hours of overtime for every downtime hour to recover lost production. Calculate overtime premium (1.5x base rate) x affected workers x recovery hours. This cost is frequently excluded from downtime calculations — incorrectly.
Recovery Cost = (Downtime hrs x 1.7 ratio) x (Headcount x OT rate)
Step 6
Sum Your True Hourly Downtime Cost
Add all five components. Compare this number against your current maintenance budget. In most facilities, a single 8-hour unplanned downtime event costs more than the entire monthly preventive maintenance budget — making the PM investment case straightforward.
True Downtime Cost = Production Loss + Idle Labor + Emergency Premium + Scrap + Recovery
Reactive vs. Preventive — The Cost Comparison That Closes Budget Discussions
| Cost Category |
Reactive Maintenance |
Preventive Maintenance |
Annual Saving |
| Unplanned downtime hours/year |
800 hours avg. |
200 hours avg. |
600 hours saved |
| Repair cost per event |
4.8x planned rate |
Baseline planned rate |
78% lower per repair |
| Emergency parts premium |
Paid every failure |
Eliminated on 75% of repairs |
~$8,400/asset/year |
| Overtime recovery hours |
1,360 hrs/year average |
340 hrs/year average |
$87,000 labor saved |
| Asset replacement frequency |
60-70% of designed lifespan |
85-95% of designed lifespan |
3-5 extra years per asset |
| Customer penalty exposure |
High — failures unpredictable |
Low — windows planned around delivery |
Penalty risk near zero |
| Budget predictability |
plus or minus 60% variance monthly |
plus or minus 8% variance yearly |
Reliable CapEx forecasting |
| Maintenance cost as % of Asset Value |
8-12% (industry data) |
2-5% with CMMS-driven PM |
Up to 60% lower spend |
Why Downtime Cost Is 50% Higher Than 2019
Labor Cost Inflation
Skilled maintenance technician wages rose 28% between 2019 and 2024 in North America. Emergency callout premiums increased proportionally. A repair that cost $800 in technician labor in 2019 costs $1,024 in 2024 for the same hours.
Supply Chain Parts Premiums
Industrial parts prices increased 35-45% since 2020. Expedited shipping costs for emergency parts rose 60%. A critical motor that shipped in 3 days in 2019 now arrives in 8-14 days without premium freight — creating longer downtime per event.
Tighter Customer SLAs
Retailer and automotive OEM delivery windows tightened from plus or minus 2 days to same-day in many supply chains. A downtime event that had zero penalty exposure in 2019 now triggers automatic SLA penalties. Contract terms have not gotten more forgiving.
Aging Equipment Fleet
Average industrial equipment age in North American plants increased from 9.2 years to 11.8 years between 2015 and 2024 as CapEx investment deferred during economic uncertainty. Older equipment fails more often and parts are harder to source quickly.
Higher Production Throughput
Lean manufacturing and JIT delivery requirements mean lines run at 92-98% of capacity versus 80-85% in 2015. Higher utilization means less buffer when failures occur — a single line stop cascades faster across the production system.
Regulatory and Compliance Cost
OSHA, FDA, and environmental incident reporting requirements for certain failures add documentation, investigation, and corrective action costs that didn't exist or were less stringent in 2019. Compliance cost per incident increased 40% since 2021.
What Facilities Save When They Eliminate Reactive Maintenance
$2.4M
average annual downtime cost saving
reported by mid-size manufacturers (200-500 employees) switching from reactive to preventive maintenance with CMMS
31%
reduction in unplanned failures
achieved by facilities using MTBF-triggered PM scheduling instead of fixed calendar intervals within 12 months of implementation
9 months
average CMMS payback period
time from CMMS implementation to full ROI recovery, based on downtime reduction savings alone — excluding labor and parts savings
$87K
overtime labor saved per year
typical overtime recovery cost elimination when unplanned downtime drops from 800 to 200 hours annually through preventive maintenance
How Oxmaint Tracks and Reduces Downtime Cost
Downtime Tracking
Automatic Downtime Timestamping
Every work order in Oxmaint captures failure start time and equipment return-to-service time automatically. No manual downtime entry. No estimation. Exact duration per event, per asset, per site — feeding real cost calculations, not guesses.
Cost Calculation
Hourly Cost Rate Per Asset
Configure a downtime cost rate for each critical asset — your actual revenue loss per hour. Oxmaint multiplies duration x rate automatically and shows total downtime cost per event, per month, and per year. No spreadsheet required.
PM Scheduling
Prevent Failures Before They Cost You
Schedule preventive maintenance from MTBF data. Trigger PMs based on runtime hours, production cycles, or sensor data via IoT integration. Stop the failure from happening instead of calculating its cost after the fact.
Reporting
Monthly Downtime Cost Reports
One-click downtime cost reports sorted by asset, by line, and by site. Show your CFO the exact monthly downtime exposure and the trend line heading down after PM implementation. Data that wins maintenance budget approval.
Parts Inventory
Critical Spares That Reduce MTTR
Oxmaint tracks spare parts inventory and links critical spares to specific assets. When a failure occurs, technicians see parts availability instantly. Staged parts reduce repair time by 40% — which directly cuts downtime cost per event.
CapEx Forecasting
5-10 Year Downtime Exposure Forecast
Identify which assets are trending toward more frequent failures. Oxmaint's CapEx forecasting models show when replacement becomes cheaper than continued reactive repair — with real numbers, not gut feel.
Frequently Asked Questions
How do I calculate my facility's true downtime cost per hour?
Start with lost production revenue: units per hour x margin per unit. Then add idle labor cost (all workers blocked x hourly rate), emergency repair premium (4.8x planned repair cost minus planned cost), scrap from in-process material, overtime recovery (1.5-2x downtime hours at OT rate), and any applicable customer penalties. Most facilities find their true hourly downtime cost is 2.5-3.5x their initial production-only estimate. For a $300,000/hour production loss, total downtime cost typically lands at $450,000-$650,000 per hour when all categories are included.
Why has downtime cost increased 50% since 2019?
Six compounding factors: 28% skilled labor wage inflation, 35-45% industrial parts price increases, 60% expedited freight premium increases, tighter customer SLA penalty terms, aging equipment fleets now averaging 11.8 years in North America, and higher line utilization rates (92-98% vs. 80-85% in 2015) that eliminate buffer when failures occur. Each factor compounds the others — higher labor costs plus longer parts lead times plus no production buffer equals a fundamentally more expensive failure event than five years ago.
What is a realistic ROI timeline for a CMMS investment focused on downtime reduction?
Most mid-size manufacturing facilities see full CMMS cost recovery in 9-14 months when implementing preventive maintenance programs. The calculation: if current unplanned downtime costs $2.4M annually and the CMMS reduces it by 40% (conservative estimate), that is $960,000 in annual savings. Against a CMMS cost of $60,000-$120,000/year, payback occurs in under 6 weeks on savings alone — before accounting for parts cost reduction, labor efficiency, and extended asset life.
Which assets should I prioritize for downtime cost tracking first?
Prioritize by criticality — assets where failure stops the entire production line before assets with redundancy or bypass options. In most facilities, 20% of assets cause 80% of downtime cost. Start with your highest-throughput bottleneck equipment, then cold chain and refrigeration (failure causes spoilage beyond production loss), then assets with longest MTTR due to parts sourcing lead time. Build your downtime cost register for these assets first — you will have enough data within 90 days to make a compelling PM investment case to leadership.
Oxmaint CMMS · Downtime Cost Tracking
Stop Estimating Downtime Cost. Track It Automatically. Eliminate It Systematically.
Oxmaint calculates your real downtime cost from every work order — timestamped automatically, multiplied by your asset's configured hourly cost rate, and reported by site, line, and asset. See exactly which failures are costing you most. Schedule PMs that prevent them before they happen. Build the CFO report that wins your maintenance budget — with real numbers, not estimates.