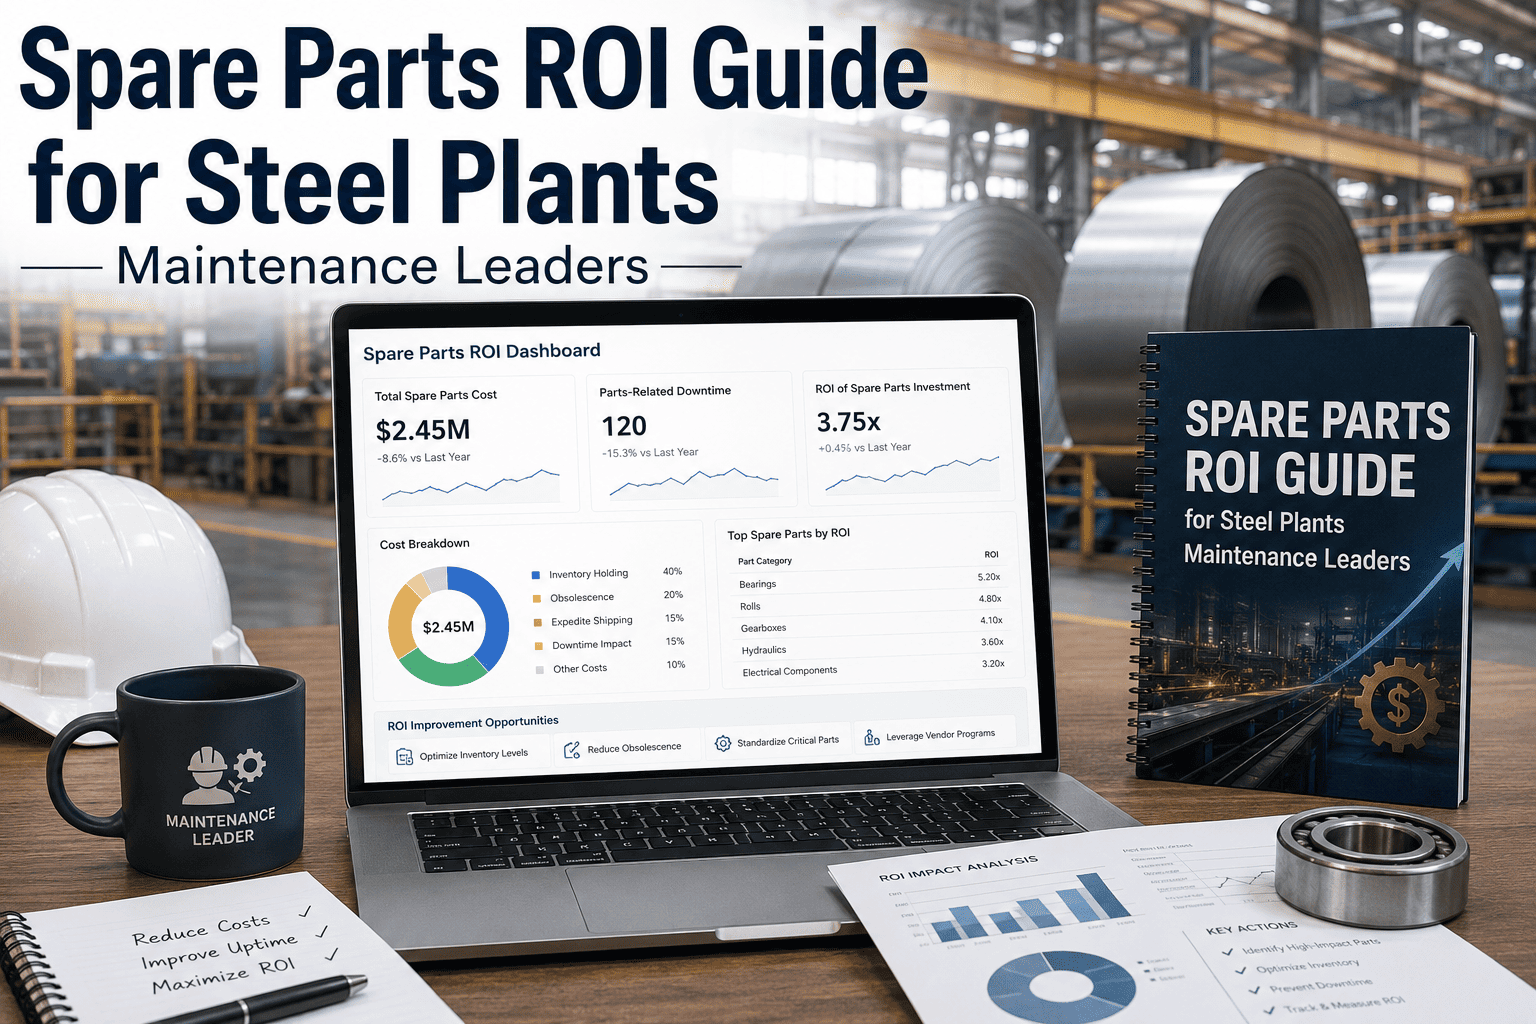
An integrated steel plant carries between $20M and $100M in MRO spare parts inventory. CPCON's 2026 industry analysis indicates 20–40% of that inventory is excess or obsolete, Plant Engineering's 2025 survey shows 23% of unplanned downtime is directly caused by unavailable spare parts, and emergency procurement commands a 3–5× premium over planned purchases. The financial picture is unforgiving in both directions — overstocking traps capital that could be deployed elsewhere, while a single missing $400 bearing on a roll stand gearbox can produce $200K-per-hour in lost production. Oxmaint's inventory and spare parts module is the system maintenance leaders use to translate the inventory dilemma into a disciplined, measurable, defensible ROI program — one that frees working capital while making critical spares more available than they have ever been.
The Spare Parts ROI Equation for Steel Plant Maintenance Leaders
Inventory ROI in steel is not a single number. It is the result of four competing forces — and the discipline that turns those forces into a measurable, defensible return on capital.
The ABC Classification — Where the Inventory Discipline Begins
Not every spare on the storeroom shelf is the same kind of risk. A bearing on a primary roll stand and a fastener for a guard cover live in completely different financial universes — and a single inventory policy applied to both wastes money in one direction or the other. ABC classification for steel plant spare parts is the foundational discipline: classify every SKU by criticality and value, then apply a control policy proportional to its tier.
Criticality Heatmap — Steel Plant Equipment vs Spare Type
ABC classification orders SKUs by value. Criticality classification orders them by what happens to production if the part is missing when needed. The two together — value × criticality — drive the actual inventory policy applied. This heatmap shows how OxMaint maps spare criticality across the major steel plant production areas.
Where the Inventory Dollar Actually Goes — Cost Allocation
Most steel plant maintenance directors cannot answer the question "where is the inventory money actually sitting" with precision. The breakdown below reflects industry-average allocation across a representative $30M steel plant MRO inventory — and it is where every ROI conversation needs to start. CMMS-driven inventory management for steel mills exists to move money from the wrong categories into the right ones.
Stock Level Discipline — Min, Reorder Point, Max
A spare that sits below its minimum is a production exposure. A spare that sits above its maximum is dead capital. Critical spares stockout prevention lives in the discipline between those two values — the reorder point, dynamically calculated from consumption data, lead time, and demand variability.
A $30M MRO Inventory Becomes a $24M Inventory With Better Availability — Not Worse.
OxMaint's Inventory & Spare Parts module right-sizes stock levels per SKU using consumption history, lead time variance, and asset criticality — the discipline that consistently frees 15–25% of working capital while improving critical parts availability.
The Five Inventory Disciplines That Drive Real Steel Plant ROI
An inventory ROI program is not a technology purchase — it is five recurring disciplines made systematic by a CMMS. Each one removes a specific category of cost. The dollar impact figures below reflect typical mid-size steel plant deployments. Maintenance storeroom optimization for steel mills compounds gains across all five.
Dead Stock Identification & Liquidation
Parts that have not moved in 36+ months are flagged for review. Some are still valid Tier A insurance spares for installed equipment — they stay. The rest are linked to decommissioned assets, write-offs, or one-time projects — and represent immediate liquidation candidates.
Min/Max Right-Sizing
Default min/max levels — set when the SKU was first added years ago — almost always reflect outdated assumptions. Consumption-driven recalculation, weighted by lead-time variability, typically reduces total stock by 15–25% without reducing fill rates.
Stockout Prevention on Critical Spares
An integrated steel plant typically experiences 6–10 spare-parts-driven outages per year, each costing $50K–$300K in downtime and emergency procurement premium. Eliminating these is the single largest line item in an inventory ROI calculation.
Parts Kitting & Job-Pack Staging
Kitted parts arrive at the job site as a complete set — bearing, seal, gasket, fastener pack, lubricant — staged before the technician is dispatched. CPCON research links kitting to 60–80% reduction in incomplete repairs and 40–50% reduction in storeroom picking time.
Vendor-Managed Inventory for Tier C
Fasteners, lubricants, filters, welding consumables, and PPE consume working capital and procurement labour for zero strategic value. VMI shifts ownership to the supplier until consumption, eliminating the carrying cost line item for 60–70% of SKUs by count.
The Full Steel Plant Inventory ROI Calculation
The math below reflects a typical integrated steel plant deploying OxMaint's inventory module — 2.5M tonnes/year capacity, $30M MRO inventory, 4 major production areas, 120 maintenance staff.
The Six Inventory KPIs Every Steel Plant Maintenance Director Tracks
Inventory ROI is only real when it shows up in the numbers. These six KPIs are the metrics OxMaint surfaces on the maintenance director's dashboard — and the ones the CFO will ask for when the program goes to capital review.
Inventory Turnover Ratio
Annual consumption value divided by average inventory value. Most steel plants operate at 1–2×. Best-in-class operations reach 3–5×. The single most defensible metric in any inventory ROI conversation with the CFO.
Fill Rate
Percentage of parts requests fulfilled from stock without back-order. Reflects the discipline of min/max calibration. Below 92% means safety stock is wrong — usually too low on Tier A, too high on Tier C.
Dead Stock Ratio
Percentage of inventory value with zero movement in 36+ months. Industry average is 20–40%. Below 5% indicates active dead-stock review discipline. The single highest-leverage one-time ROI target on any steel plant inventory program.
Critical Stockouts
Number of production-impacting stockouts on Tier A or B spares per year. Industry average is 6–10 per integrated plant. Below 2 indicates a mature, working program with correctly-set safety stocks.
Emergency Procurement %
Percentage of total spare parts spend on emergency or rush orders carrying 3–5× cost premium. Above 20% indicates a reactive culture with broken reorder points. Below 8% indicates planning discipline is working.
Asset-to-Spare Linkage
Percentage of inventory value linked to a specific asset in the CMMS hierarchy. Below 60% means dead stock is hiding — and right-sizing is impossible. Linkage is the precondition for every other inventory KPI moving.
Expert Review — A Steel Plant Maintenance Director's Perspective
I have managed maintenance inventory at three integrated steel plants — total combined MRO carrying value north of $200M. The pattern is identical at every plant: the spare parts conversation is conducted in feelings, not numbers, until somebody runs a proper dead-stock analysis for the first time. The reaction is always the same — a controller looking at $4M to $7M sitting on the shelf attached to equipment that was decommissioned five years ago, and asking why nobody flagged this before. The answer is that without a CMMS linking every SKU to a live asset, there is no continuous way to see it. Once you can see it, the discipline becomes almost mechanical: liquidate the dead, right-size the alive, kit the planned work, VMI the commodity. Two of my three plants ran this playbook with OxMaint as the system underneath. Both reached the ROI break-even point within a single fiscal quarter. The third plant — without the integrated CMMS — is still doing physical audits every three years and writing the same memos about parts hoarding. The technology is not the differentiator. The discipline the technology forces is.
Frequently Asked Questions
How long does it take to see meaningful ROI from an OxMaint inventory rollout at a steel plant?
Most integrated steel plants reach break-even within 2–4 months. The fastest ROI lever is the one-time dead stock liquidation — typically $1.5M–$3M in capital freed in the first quarter post-deployment. The recurring savings build over the following 6–12 months as min/max levels are recalibrated, kitting becomes systematic, and VMI agreements come into effect for Tier C items. By month 12, the typical plant has captured $1.8M–$2.4M in annual recurring savings against an implementation cost in the $80K–$150K range. Book a demo to walk through the ROI projection for your specific plant.
How do we handle critical insurance spares that should never be liquidated even if they have not moved in years?
OxMaint classifies dead stock by two dimensions, not one: movement age AND asset linkage. A spare that has not moved in 5 years but is linked to a live, operating asset with no equivalent is correctly identified as a Tier A insurance spare and protected from liquidation. A spare with no movement and no live asset linkage is the actual dead stock target. This distinction is critical — most ad-hoc dead stock analyses miss it and either liquidate critical spares (catastrophic) or liquidate nothing (no ROI). Start free in OxMaint to see the dual-axis dead stock report.
Can OxMaint integrate with our existing ERP for procurement, purchase orders, and financial reconciliation?
Yes. OxMaint integrates bidirectionally with major ERP systems via standard API patterns — materials master sync, purchase orders, goods receipts, and consumption transactions all flow without manual reconciliation between systems. This eliminates the common steel plant pattern where maintenance and finance maintain two different versions of the inventory record that drift apart over time. ERP remains the system of record for financial postings; OxMaint becomes the system of record for asset linkage, criticality classification, and consumption analytics. Book a demo to walk through the integration pattern for your ERP.
What is the right reorder point calculation method for high-criticality, low-velocity Tier A spares?
Traditional reorder point formulas (consumption × lead time + safety stock) break down for Tier A items because consumption is too low to produce statistically reliable averages. The correct method is risk-based: expected downtime cost = (probability of failure per year) × (downtime duration without spare) × (cost per day of downtime). Net stocking benefit = expected downtime cost avoided minus annual carrying cost of the spare. If the net is positive, the spare stocks at minimum 1 unit — regardless of historical movement. OxMaint runs this calculation per Tier A SKU automatically. Start free in OxMaint to see the Tier A risk-based stocking report.
How do we present the spare parts ROI case to a CFO who is skeptical of maintenance "soft savings"?
CFOs accept three categories of savings as hard: (1) one-time capital freed from inventory liquidation (cash on the balance sheet), (2) reduced annual carrying cost on smaller inventory (verifiable line-item reduction), and (3) eliminated emergency procurement premium (verifiable price-variance against contract pricing). Skip the productivity and wrench-time arguments in the initial business case — those land later. Focus the opening conversation on the three categories that flow directly to the balance sheet and income statement. Parts kitting and staging benefits compound on top of these but are not the lead argument. Book a demo to receive a CFO-ready ROI template.
The Spare Parts ROI Is Already in Your Storeroom. OxMaint Is the System That Lets You Extract It.
Inventory liquidation, min/max right-sizing, stockout prevention, kitting, and VMI — five disciplines, one platform, audit-ready ROI documentation on every step. Live in weeks. Break-even in quarters.