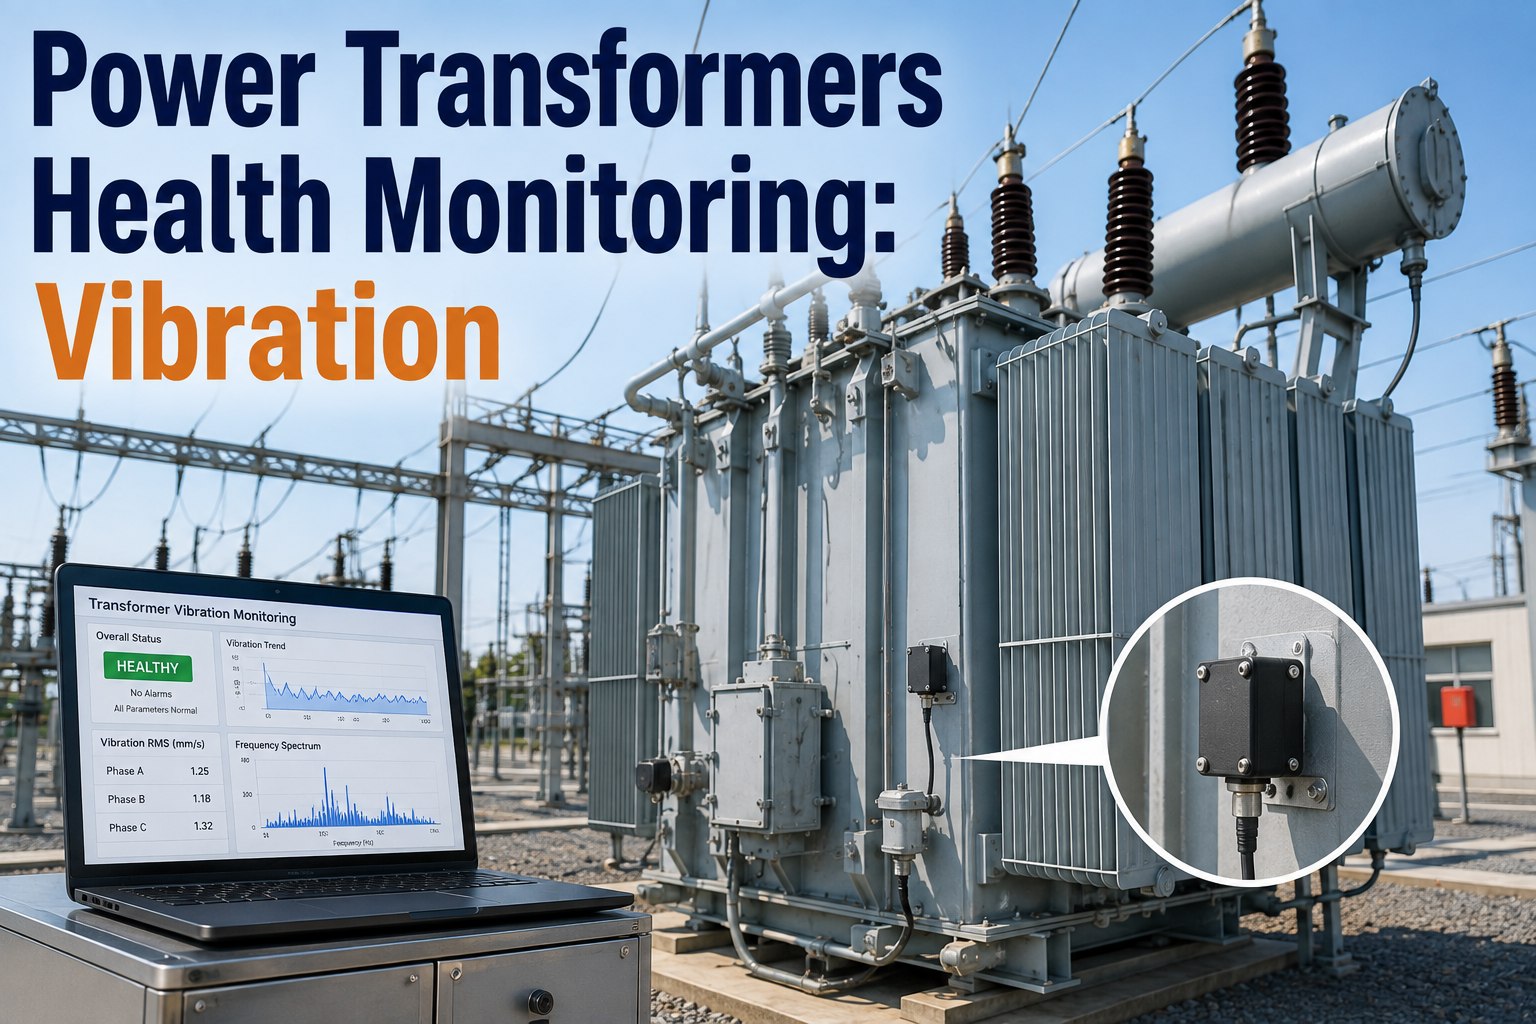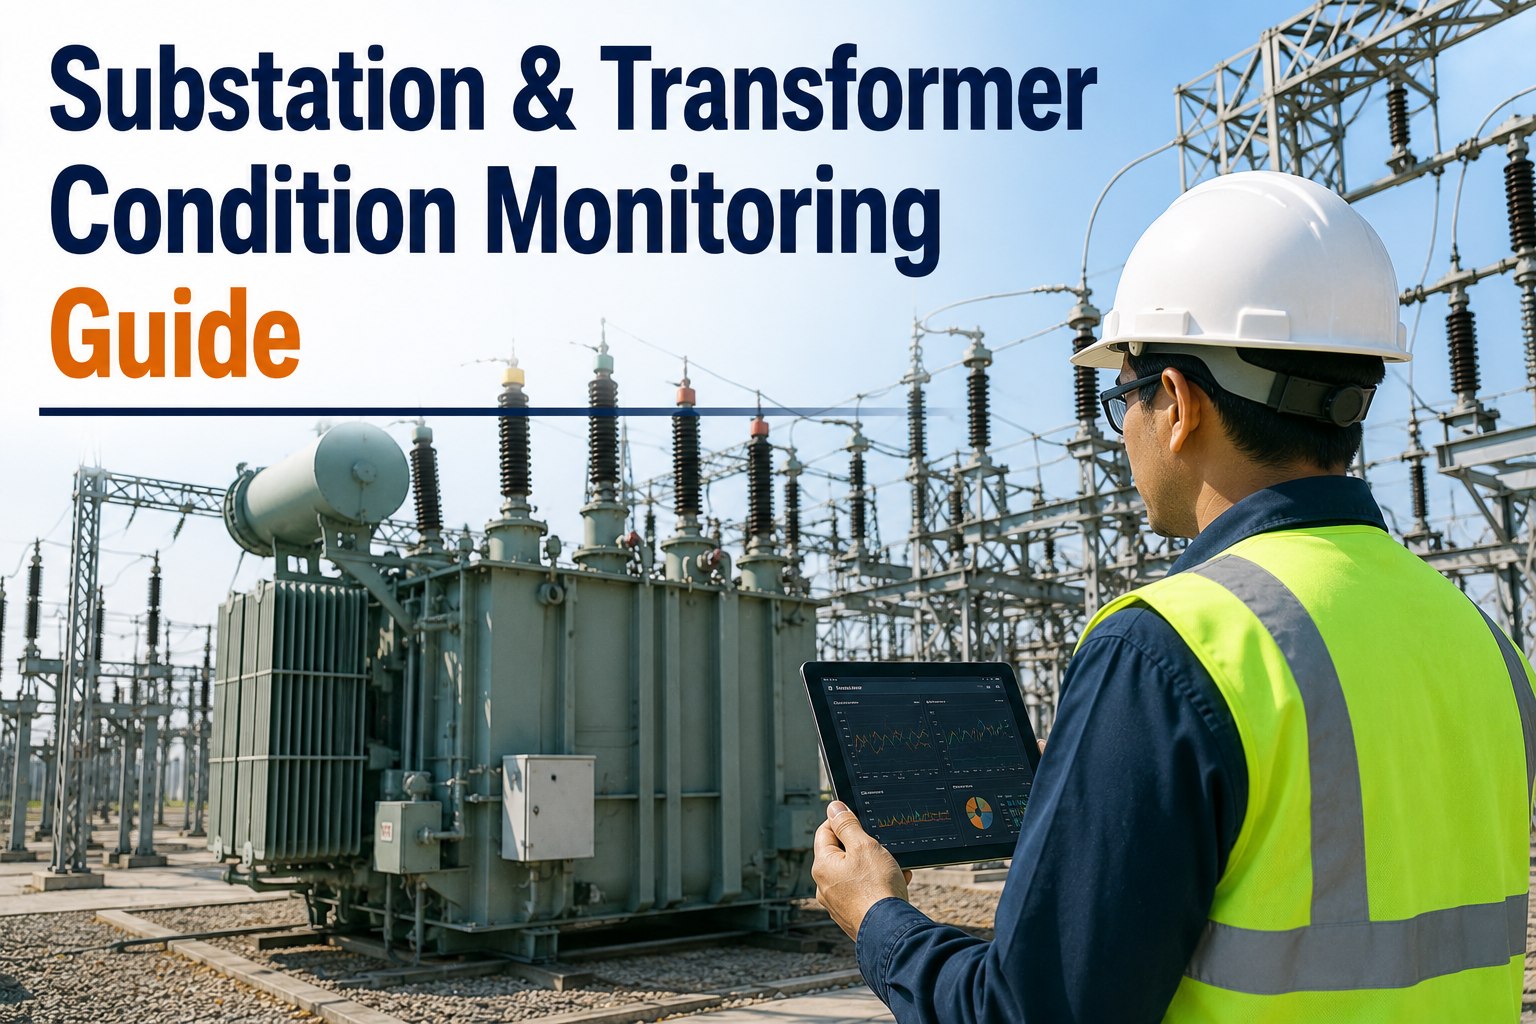
Power transformers are the most expensive single assets on a substation site, with a large 200 MVA unit typically costing $2–4 million and a failure event, including outage penalties, routinely topping $5–10 million. Condition monitoring shifts the maintenance strategy from fixed calendar intervals to evidence-based decisions using dissolved gas analysis (DGA), partial discharge (PD) sensing, and continuous thermal scanning. This guide walks utility and industrial teams through the monitoring layers that matter, the IEEE/IEC thresholds that trigger action, and how OxMaint turns DGA trend data, PD alarms, and thermal scan results into scheduled work orders. Start your Start Free Trial to wire condition data directly into your CMMS workflow.
What if your transformers flagged the fault 90 days before they failed?
A single undetected winding hot-spot can turn a $40 oil sample into a $4M replacement. Modern substation monitoring converts DGA, partial discharge, and thermal data into early warnings and work orders long before the SCADA alarm ever trips.
Why utilities are leaving condition-based maintenance half-finished
Industry benchmarking puts forced outage rates on poorly monitored transformer fleets at roughly 0.18 events per unit per year, versus 0.05 for fleets running integrated DGA and PD programs.
A 180-transformer fleet, before and after monitoring integration
A regional distribution operator running 180 medium and large power transformers moved from quarterly manual DGA sampling to online DGA plus PD sensors feeding OxMaint. The shift rewired how work was planned across the fleet.
- Quarterly manual DGA sampling with 6–8 week lab turnaround
- $42K/year in third-party lab fees and technician travel
- Average 2 unplanned failures per year at $3.2M each
- Spreadsheets tracking gas trends, alarms buried in email
- Online DGA + PD sensors with 15-minute trend resolution
- $28K/year in lab fees (confirmatory samples only)
- Zero unplanned failures in 18 months, three early interventions
- Auto-generated work orders in OxMaint on IEEE threshold breach
Net result: roughly $6.4M in avoided failure costs and $14K in lab savings annually, against a $310K sensor and integration investment, payback in under seven months.
The three sensing layers that catch faults early
Each layer targets a different failure physics, and each feeds a different workflow in the CMMS. Together they cover more than 90% of detectable transformer and substation failure modes.
Dissolved Gas Analysis (DGA)
Tracks key gases, hydrogen, acetylene, ethylene, methane, ethane, and carbon oxides, dissolved in insulating oil. Trending per IEEE C57.104 and IEC 60599 reveals thermal and electrical faults days before they escalate.
Partial Discharge (PD) Monitoring
Detects insulation degradation via UHF, acoustic, or HFCT sensors. PD activity often appears weeks before a dielectric breakdown, giving crews time to re-energize tap changers or dehumidify bushings under controlled conditions.
Thermal & Load Monitoring
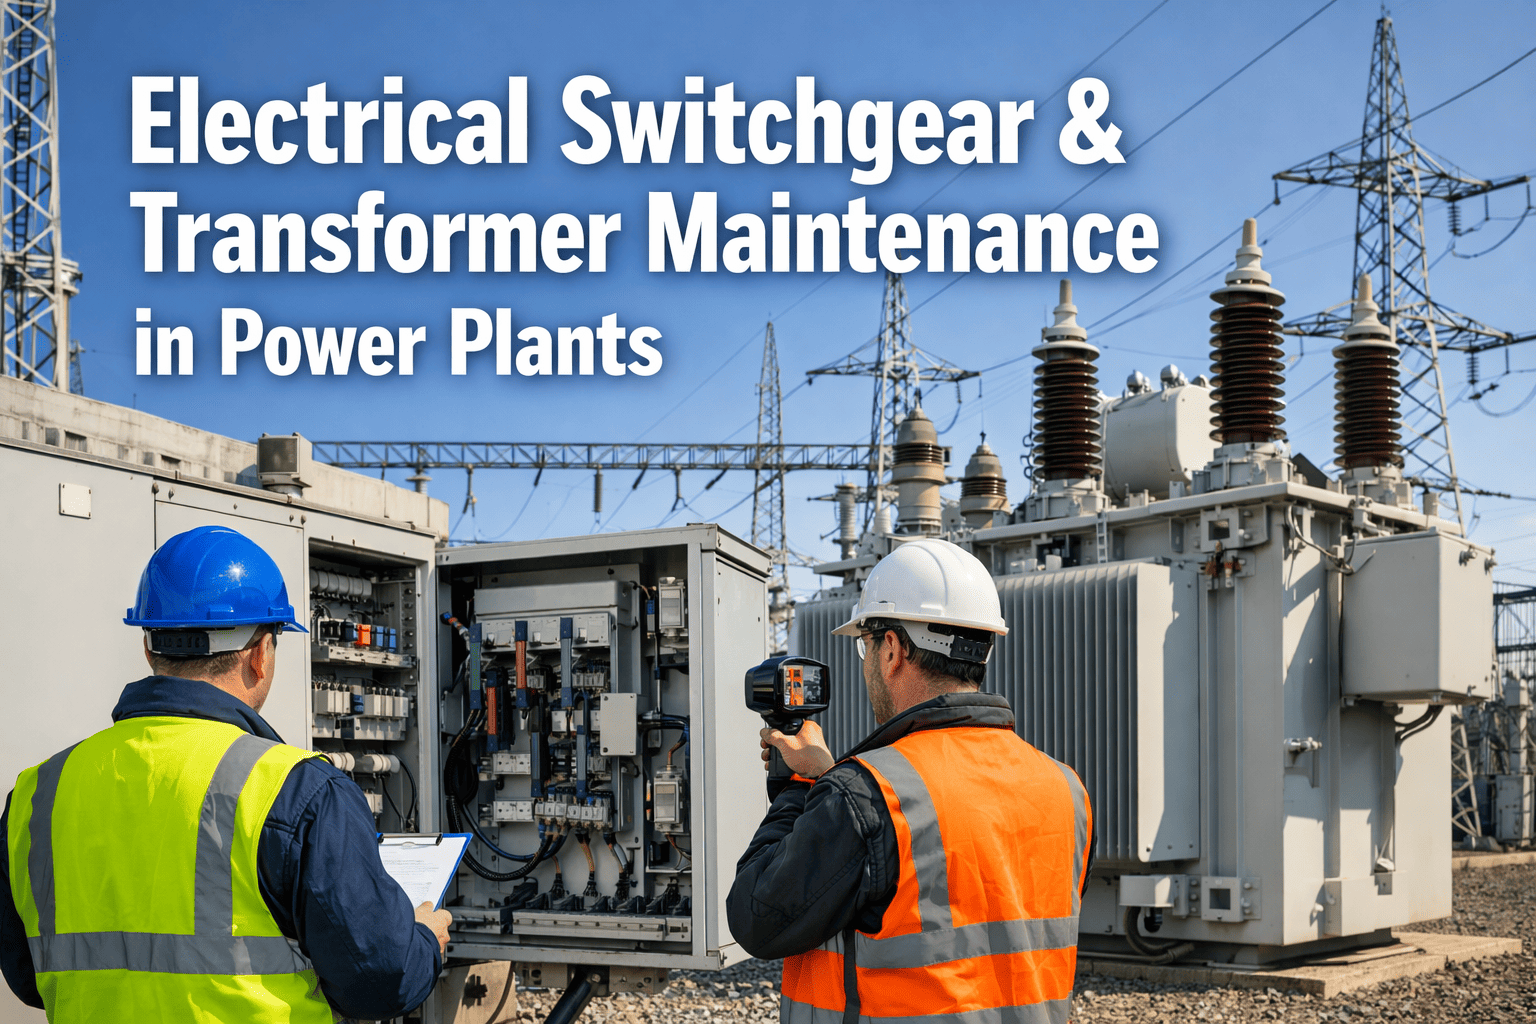
Combines IR scanning, fiber-optic winding hot-spot sensors, and top-oil temperature telemetry with load tap data. Per IEC 60076-7, thermal modeling predicts loss-of-life acceleration and flags cooling-system failures before oil degradation compounds.
Gas concentration bands that should trigger a work order
Use these as a starting baseline and tune to fleet-specific history. The values below align with IEEE C57.104-2019 Condition 1–4 bands for mineral-oil-filled power transformers.
| Gas | Normal (ppm) | Investigate (ppm) | Action (ppm) | Likely Fault Mode |
|---|---|---|---|---|
| Hydrogen (H2) | 0–100 | 100–700 | >700 | Corona / partial discharge |
| Acetylene (C2H2) | 0–5 | 5–50 | >50 | Internal arcing |
| Ethylene (C2H4) | 0–50 | 50–100 | >100 | High-temperature thermal (>700°C) |
| Methane (CH4) | 0–120 | 120–400 | >400 | Low-temperature thermal |
| Carbon Monoxide (CO) | 0–350 | 350–1400 | >1400 | Cellulose / paper degradation |
| Carbon Dioxide (CO2) | 0–2500 | 2500–10000 | >10000 | Severe paper aging |
Rising rate-of-change is often more diagnostic than absolute ppm. A doubling of H2 within 30 days warrants a confirmatory sample and an OxMaint inspection work order, even if the absolute value is still inside the normal band.
How OxMaint converts condition data into scheduled action
The hard part of condition monitoring is not collecting data, it is routing the right signal to the right technician with the right parts, before the next shift change buries it.
Sensor ingestion & DGA integration
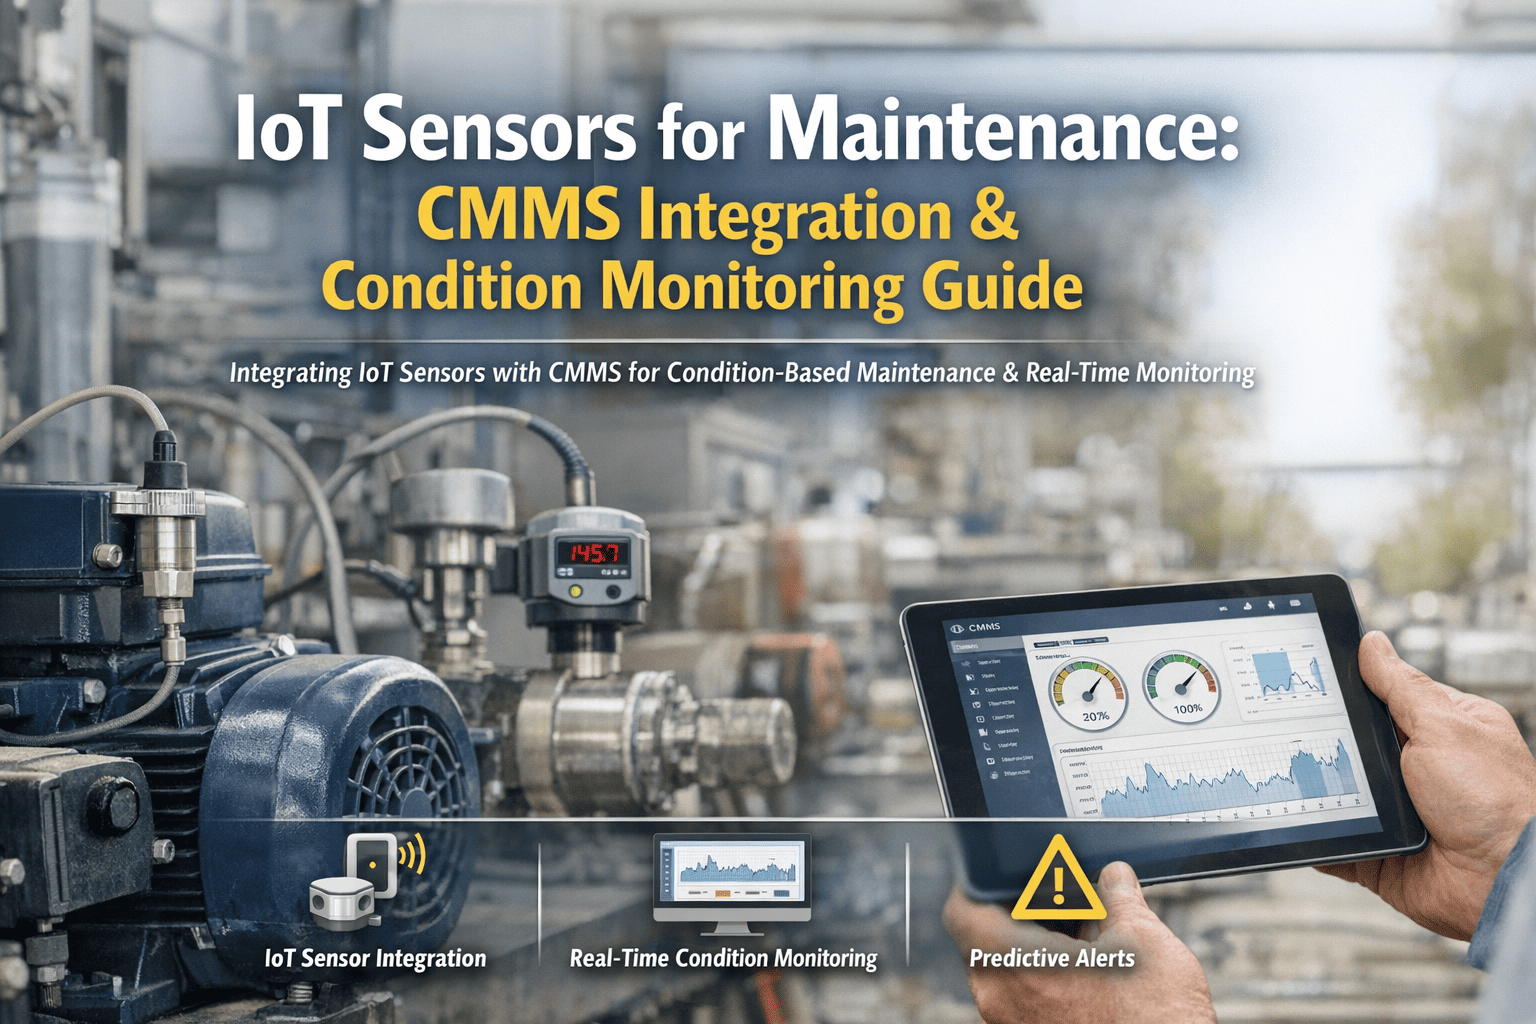
Online DGA monitors, PD sensors, and thermal scanners push readings into OxMaint via MQTT, OPC-UA, or scheduled CSV import. Each asset binds to its sensor ID, so every reading is timestamped against the correct transformer serial.
Threshold & trend rule engine
Rules encode IEEE C57.104 bands, Roger/Doernenburg ratios, and fleet-specific rate-of-change limits. When a gas crosses into Condition 3 or PD activity sustains above 10,000 pC, the engine fires a ranked alert instead of a generic alarm.
Auto-generated inspection work order
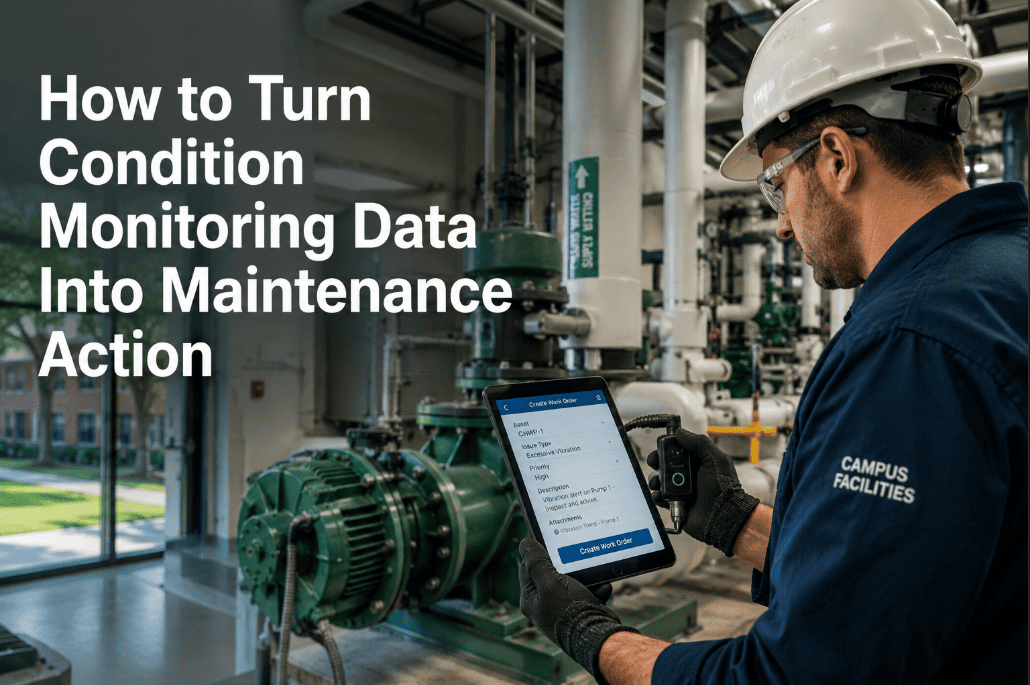
OxMaint creates a work order pre-filled with asset ID, fault signature, attached trend chart, recommended checklist, and required spare parts. Priority, crew, and SLA are assigned based on the rule that triggered.
Field execution & closed-loop verification
Technicians complete the inspection on mobile, log oil resample results, and close the work order. The reading is written back to the asset history, automatically resetting the trend baseline and silencing the alarm.
Fleet-level reliability reporting
Aggregated dashboards track mean time to detect, mean time to repair, and asset health index per ISO 55000, giving reliability engineers a single view of which substations are drifting and which interventions actually moved the needle.
Stop sampling into spreadsheets. Start closing the loop on every alarm.
OxMaint ingests DGA, PD, and thermal data, applies your thresholds, and writes the work order before the next technician even clocks in.
Transformer and substation monitoring, answered
How often should dissolved gas analysis be performed on a power transformer?
For critical transmission transformers, IEEE C57.104 recommends annual lab DGA at minimum, with quarterly sampling on units showing rising trends. Online DGA monitors that sample every 15 minutes are now standard practice on transformers above 50 MVA, since they catch rate-of-change shifts that quarterly lab draws routinely miss. You can wire both cadences into OxMaint and Start Free Trial to automate the threshold-to-work-order flow.
What is the difference between DGA and partial discharge monitoring?
DGA analyzes gases dissolved in the oil to infer what kind of thermal or electrical fault is happening inside the tank, giving a chemical fingerprint over days or weeks. PD monitoring measures the actual electrical discharge activity in real time, often catching insulation defects before they generate enough gas to register on a DGA sample. The two are complementary, DGA tells you what happened, PD tells you what is happening right now.
Can OxMaint integrate with our existing online DGA and PD sensors?
Yes. OxMaint accepts sensor data via MQTT, OPC-UA, REST API, or scheduled CSV upload from common online monitors including those from Vaisala, GE Kelman, Morgan Schaffer, and Doble. Each sensor binds to a transformer asset record so readings, alarms, and work orders stay linked across the asset lifecycle. Most integrations are live within two to four weeks.
What thermal limits should trigger an inspection work order?
Per IEC 60076-7, top-oil temperature above 95°C or winding hot-spot above 140°C under rated load warrants immediate investigation. A sustained 10°C rise above nameplate, a hotspot differential exceeding 15°C between phases on IR scan, or a cooling-system component failing to respond within 30 minutes of a fan tap change should all generate work orders. OxMaint can encode each of these as a separate rule.
How long does it take to deploy condition-based monitoring across a substation fleet?
A pilot on 10 to 20 transformers, with existing sensors feeding OxMaint, typically goes live in four to six weeks. Rolling out across a 150-transformer fleet usually takes three to four months, with sensor procurement on new units being the longest lead item. Book a Demo to map a phased rollout to your fleet.
Turn condition data into reliability, starting this quarter
Join the utilities and industrial operators using OxMaint to convert DGA, PD, and thermal signals into scheduled work orders before failures ever reach the SCADA alarm panel.
Free 14-day trial · No credit card