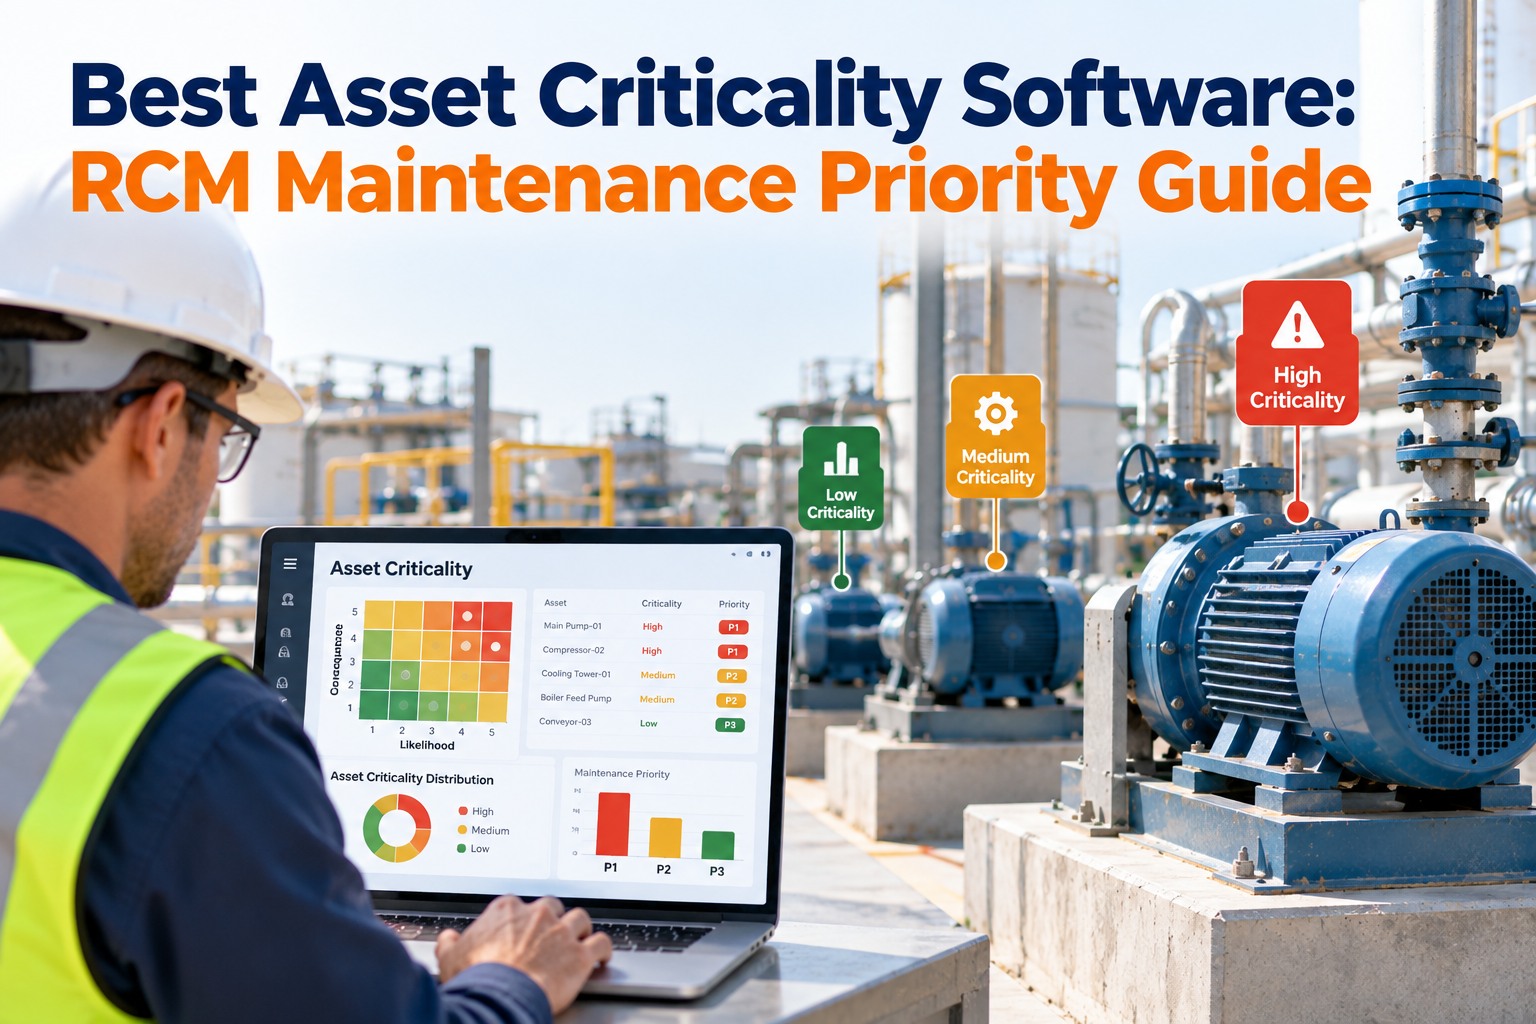
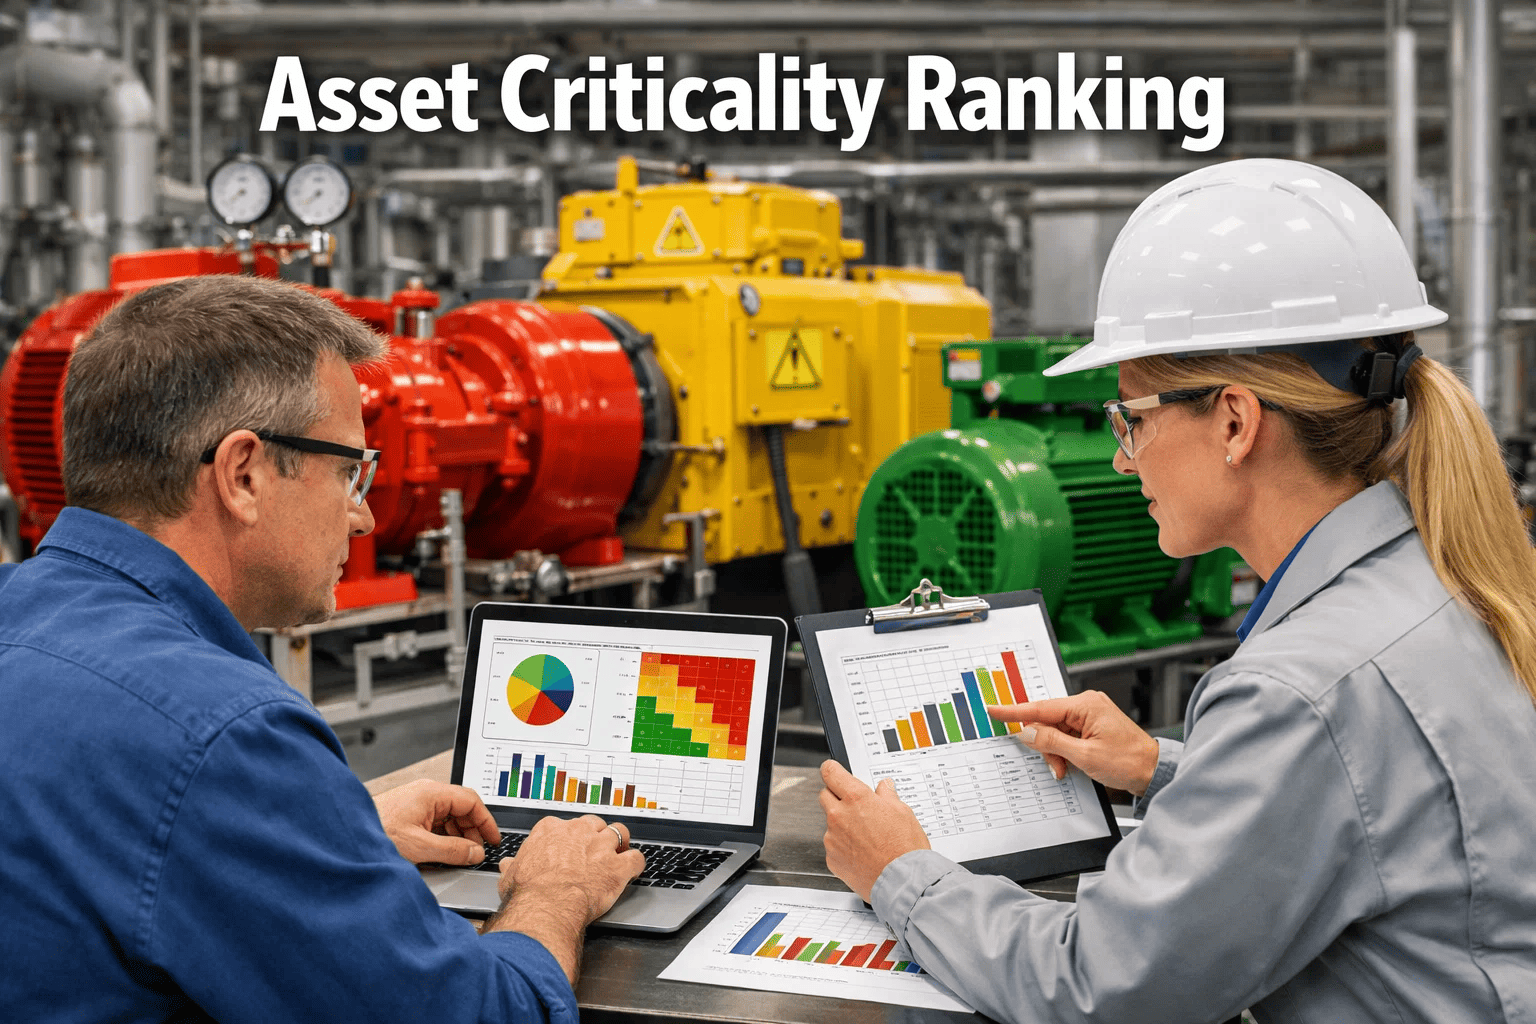
Ask ten plants how they decide which asset gets the next PM, the condition monitor or the spare on the shelf, and nine will describe the same broken system: whatever broke most recently gets the attention. It's the squeaky-wheel method, and it's expensive — because the loudest failure is almost never the most consequential one, and a maintenance budget spent on noise leaves the truly critical asset one bearing away from a plant-wide shutdown. Asset criticality ranking replaces that gut-feel triage with a formula. You score every asset across five variables — safety, environmental, production, cost, and redundancy — weight them, factor in how likely each is to fail, and out comes a single number that ranks 5,000 assets from most to least critical. It's the difference between "I think the boiler feed pump matters" and "the boiler feed pump scores 4.6 and sits in Tier 1, here's why" — a ranking finance and safety will both sign. This guide walks the formula, and how OxMaint's maintenance management software scores and maintains it. Start free or book a demo.
Asset Criticality Ranking: The Formula That Makes Priority Objective
Five variables — safety, environmental, production, cost, redundancy — weighted and multiplied by failure likelihood, turn thousands of assets into a defensible ranked list. Not a gut feel. A number you can defend.
The Formula, One Line at a Time
Criticality is consequence multiplied by likelihood. Consequence is the weighted sum of the five variables — how bad is it if this asset fails — and likelihood is how often it actually does. That second term is what separates two identical pumps: same consequence, but the one that fails monthly outranks the one that fails once a decade. Sign up free and OxMaint computes and re-ranks this across your whole register.
weighted sum of 5 variables × Likelihood
how often it fails (PoF) = Criticality Score
the rank
The Five Variables — What Each One Measures
Each variable is scored 1–5, where 5 is severe, using failure history and engineer input rather than assumptions. Note the weights: safety and production carry the most, because a fatality or a plant shutdown is non-negotiable. Redundancy is the one that lowers the score — a hot standby makes an asset less critical, which is the whole point of the exercise. Book a demo to see weights configured for your operation.
Lock the Weights Before You Score the First Asset.
The single biggest way a criticality study loses its credibility is changing the weights partway through — it silently invalidates every score already done. Set the weights with senior leadership, document the rationale, get sign-off, and lock them for the analysis cycle. And score in a cross-functional team — operations, maintenance, safety, engineering — so the numbers reflect reality, not one person's view. OxMaint keeps a full audit trail of every score and every weight, with date, user and reason.
Worked Example: Two Pumps, Same Failure Rate, Different Rank
This is the formula's whole argument in one table. A boiler feed pump and a redundant transfer pump can fail at the same rate — but one shuts the plant and one has a standby, so the ranking sends the spares budget and the monitoring to the right one. Sign up free and score your first assets against the register.
Same failure frequency, very different criticality. The boiler feed pump earns predictive monitoring, a stocked spare and a tight PM interval; the redundant transfer pump can safely run closer to failure. That divergence — from identical raw reliability — is exactly the decision the squeaky-wheel method gets wrong.
The Safety Override: When One Score Trumps the Math
The weighted sum is the default, but it has one hard exception: a single catastrophic score overrides the aggregate. An asset that scores a 5 in safety, environmental, or production is Tier 1 no matter how low the other variables drag the composite — because you can't average away a fatality risk with a cheap repair cost. Book a demo to see override rules enforced automatically.
From Score to Strategy: The Four Tiers
A score is only useful if it changes what you do. The composite ranks assets into four tiers, and each tier prescribes a different maintenance strategy, spares policy, and monitoring level — which is how the ranking actually reallocates the budget. Sign up free to auto-tier your register.
Squeaky-Wheel vs. OxMaint Criticality Ranking
The gap between an intuition-driven program and a defensible one is whether every priority traces to a documented number. Here's what changes when criticality is a formula in a CMMS, not a hunch in a meeting. Start free and rank one asset class this week.
What OxMaint Gives the Reliability & Asset Team
OxMaint runs criticality as a living module — score, weight, tier, and re-rank as the operation changes — so the ranked list actually drives PM frequency, spares, and monitoring instead of sitting in a spreadsheet. Here's the mapping. Book a demo to see it on your register.
Use this formula plus OxMaint to turn thousands of assets into a defensible ranked list — priority by number, not by noise — and channel every PM hour, spare part, and monitoring dollar to the assets that actually carry the risk. Try OxMaint free or book a demo to see it on your plant.
Our maintenance budget followed whoever complained loudest — and every audit, finance asked why a given asset got a rebuild and couldn't get a straight answer. We scored our whole register in OxMaint on the five variables, locked the weights with leadership first, and did it as a cross-functional team so no single department skewed it. The eye-opener was two nearly identical pumps landing in completely different tiers because one had a standby and one didn't — we'd been over-maintaining the redundant one for years. Now every priority traces to a number with an audit trail. When finance asks why an asset is Tier 1, we show them the score. The squeaky wheel stopped setting our budget.
Frequently Asked Questions
Make Priority a Number, Not a Hunch.
OxMaint scores every asset on the five variables, locks the weights with an audit trail, enforces safety overrides, and auto-tiers the whole register — so 5,000 assets become one defensible ranked list that drives PM, spares and monitoring. Start free — no credit card, unlimited users, forever. Or book a demo.