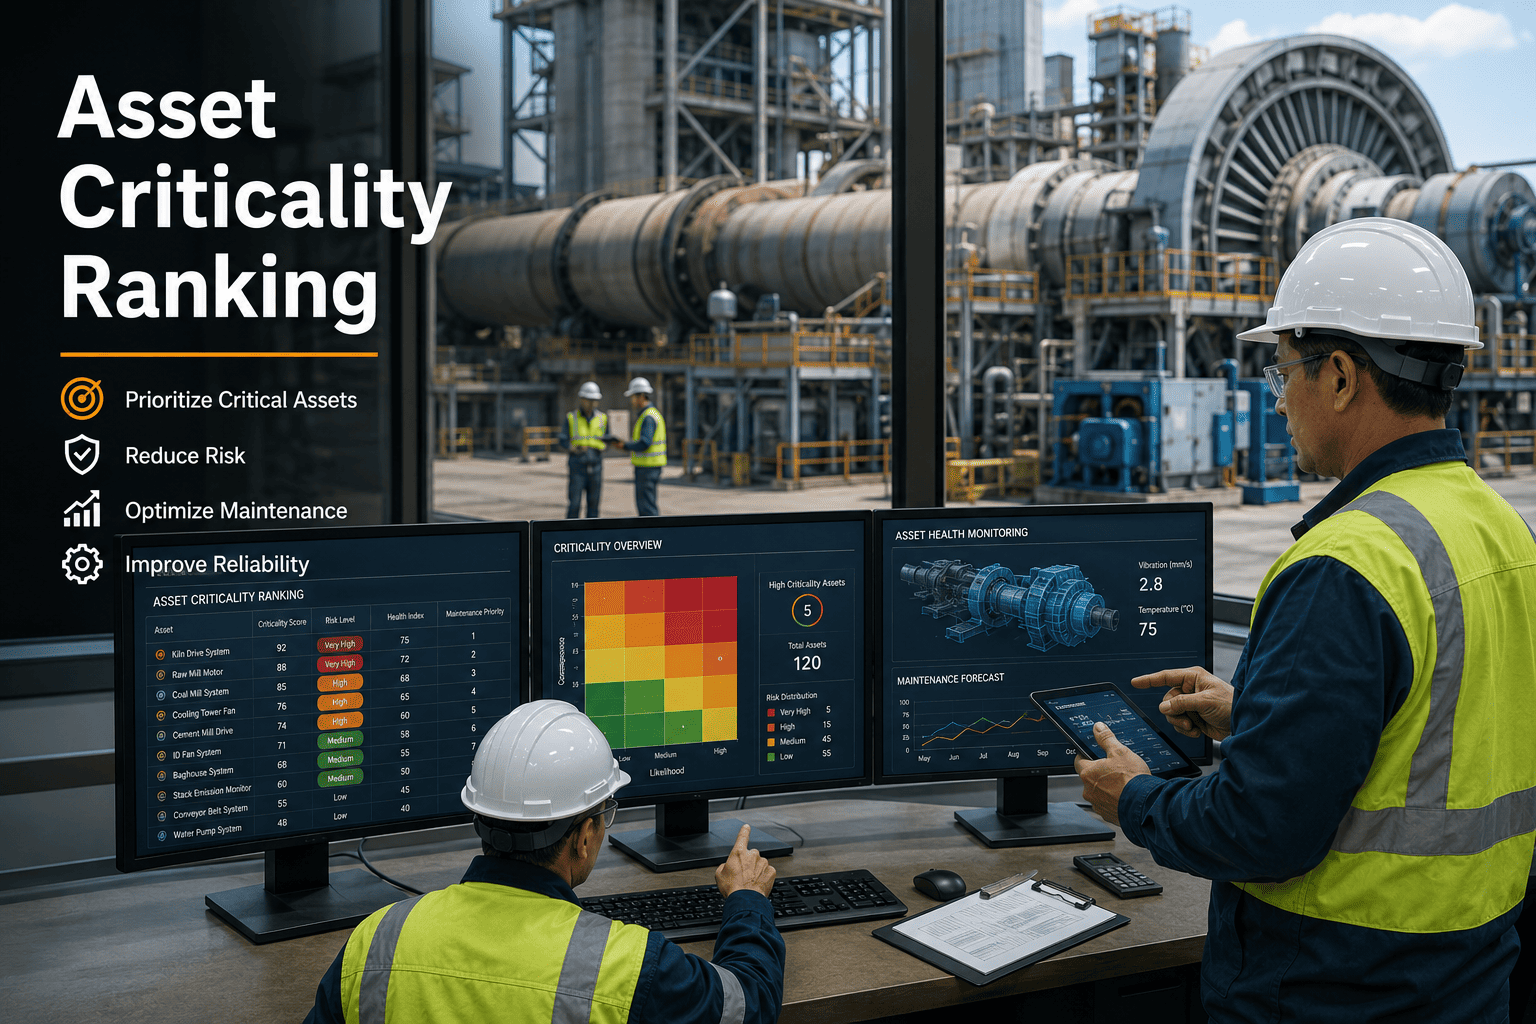
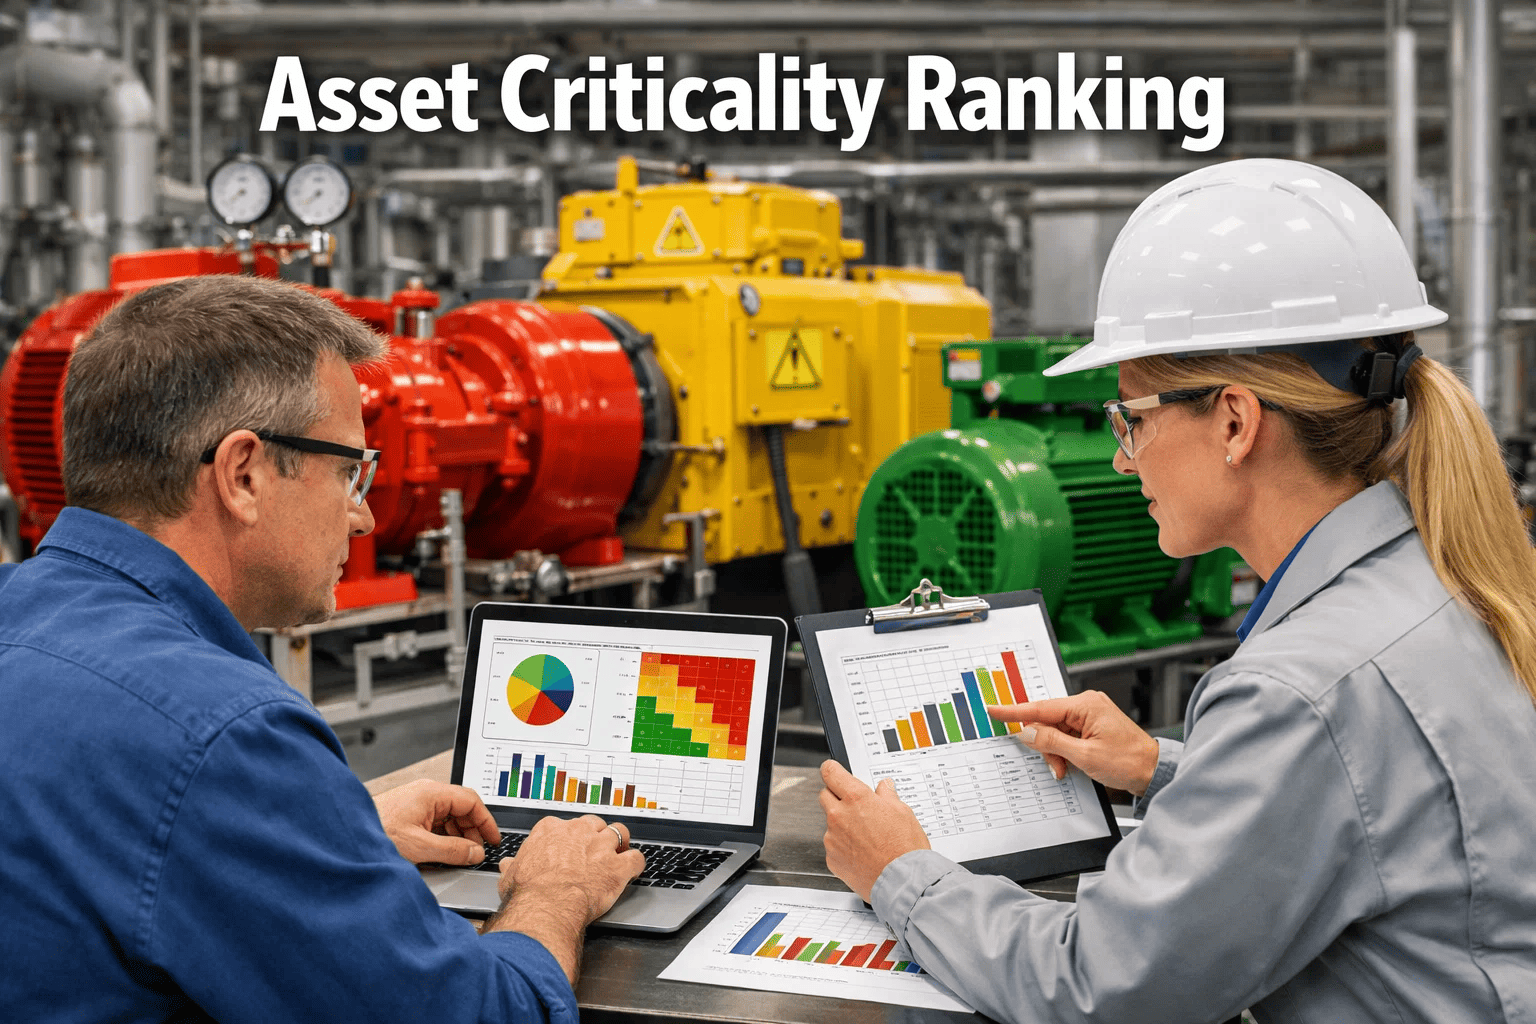
An asset risk ranking matrix for data centers is a scoring framework that ranks every asset — UPS systems, chillers, CRAC units, generators, PDUs, switchgear — by the consequence of its failure across safety, production, and cost dimensions. The output is a tiered criticality score (typically Tier 1 through Tier 4) that tells your reliability team exactly which assets deserve predictive monitoring, which get preventive maintenance, and which can safely run to failure. Without this ranking, data center maintenance teams spread limited technician hours and spare-parts budget evenly across hundreds of assets — which means a $400 humidity sensor gets the same attention as a $180K chiller whose failure could take down an entire row of racks. This guide gives you a complete, ready-to-use data centers criticality matrix template with the exact scoring criteria, weighting formulas, and tier thresholds reliability teams use in production. Download it, plug it into Start Free Trial, and turn your asset register into a risk-prioritized maintenance plan in under a week.
Which of Your 400+ Assets Would Cost You $9K Per Minute If It Failed Right Now?
Most data center teams can't answer that question in under 30 seconds. An asset criticality matrix changes that — it scores every asset by safety, uptime, and cost impact so your PM schedule, spare-parts budget, and monitoring stack all point at the equipment that actually matters. The template below has been used to rank assets in facilities from 2MW edge sites to 40MW hyperscale plants.
The Real Cost of Treating Every Asset the Same in Data Center Maintenance
A mid-size colocation facility typically manages 300–800 maintainable assets across electrical, mechanical, and environmental systems. When every one of those assets gets the same PM frequency, the same inspection depth, and the same spare-parts priority, two things happen: critical equipment gets under-maintained, and non-critical equipment burns budget it doesn't need.
The math is straightforward. A facility spending $320K per year on maintenance labor that re-allocates 30% of its PM hours from Tier 4 assets (low risk) to Tier 1 assets (high risk) frees up roughly $96K in technician capacity — without hiring anyone. That capacity goes into predictive monitoring, deeper inspections on critical switchgear, and faster response on the assets whose failure would actually take the facility down. Asset criticality in data centers isn't an academic exercise; it's the difference between a maintenance budget that prevents outages and one that just checks boxes.
How the Data Centers Criticality Matrix Scores Every Asset
The matrix scores each asset on three consequence dimensions — safety impact, production (uptime) impact, and cost impact — using a 1-to-5 scale for each. The weighted total produces a criticality score from 3 to 75, which maps to a tier. Here is the exact structure used in the template.
| Dimension | Weight | Score 1 (Low) | Score 3 (Medium) | Score 5 (Critical) |
|---|---|---|---|---|
| Safety Impact | 40% | No personnel risk | Minor injury possible; contained area | Arc flash, fire, or life-safety risk to personnel |
| Production / Uptime Impact | 35% | No effect on IT load | Partial capacity loss; redundancy holds | Full facility or hall outage; SLA breach |
| Cost Impact | 25% | Repair under $5K; no consequential damage | Repair $5K–$50K; some collateral damage | Repair over $50K; cascading equipment damage |
The 40/35/25 weighting reflects data center reality: safety always leads because an arc-flash incident or a fire in a UPS room has consequences no SLA credit can fix. Uptime comes second because that's the product you're selling. Cost is third because a $200K chiller replacement, while painful, is recoverable — an outage that triggers customer SLA penalties and churn is not. Some facilities adjust weights (a hospital data center might push safety to 50%), but the template defaults work for most colocation and enterprise facilities.
Data Centers Asset Tier Ranking: What Each Tier Means for Maintenance Strategy
Once scored, every asset falls into one of four tiers. The tier determines the maintenance strategy — and this is where the template pays for itself, because it stops teams from over-maintaining cheap assets and under-maintaining critical ones.
- Main switchgear & UPS systems
- Primary chillers & cooling towers
- Backup generators & ATS
- Fire suppression systems
Continuous condition monitoring, monthly PM, dedicated spares on-site, failure mode analysis (FMEA) documented. Any unplanned downtime on a Tier 1 asset is a reportable event.
- CRAC/CRAH units (N+1 redundant)
- PDUs & remote power panels
- STS (static transfer switches)
- BMS/BAS controllers
Quarterly PM with vibration or thermal checks, spare parts in regional stock, documented failure history reviewed semi-annually.
- Humidifiers & dehumidifiers
- Water leak detection sensors
- Lighting & general power circuits
- Raised floor & containment panels
Semi-annual or annual PM, standard spares, run-to-failure acceptable if redundancy exists at the system level.
- Office-area HVAC
- Non-critical exhaust fans
- Landscaping & exterior lighting
- Break-room appliances
No scheduled PM. Replace on failure. Document in the asset register for capital planning but do not consume maintenance labor.
How a 12MW Colocation Facility Ranked 420 Assets in 4 Days
A real scenario: a 12MW colocation provider in Ashburn, VA ran this template across 420 maintainable assets. The reliability engineer and two senior technicians spent four half-day sessions scoring assets by system — electrical first, then mechanical, then environmental.
The result: they reallocated 340 technician hours per year from low-value PM tasks to Tier 1 condition monitoring, cut their spare-parts carrying cost by $28K (by stocking only Tier 1 and Tier 2 spares on-site), and reduced unplanned downtime events by 41% in the first 12 months. The entire assessment cost roughly 32 labor hours — about $1,600 in loaded labor cost — and paid for itself within the first quarter.
See How OxMaint Turns Your Criticality Matrix Into a Living Maintenance Plan
Book a 30-minute demo and we'll show you how to import your asset register, apply criticality tiers, and auto-generate tier-based PM schedules — all inside OxMaint.
From Spreadsheet to System: How OxMaint Operationalizes Your Data Centers Risk Scoring Matrix
A criticality matrix in a spreadsheet is a snapshot. Inside OxMaint, it becomes the engine that drives every work order, PM schedule, and spare-parts decision your team makes.
Asset Register with Criticality Tags
Import your full asset list, tag each asset with its tier (1–4), and OxMaint automatically sorts your maintenance backlog by criticality. No more guessing which work order to do first — the system surfaces Tier 1 tasks at the top of every technician's queue.
Tier-Based PM Scheduling
Set PM frequencies by tier — monthly for Tier 1, quarterly for Tier 2, annually for Tier 3 — and OxMaint auto-generates work orders on schedule. Teams typically cut total PM hours 25–35% by eliminating unnecessary tasks on Tier 4 assets.
Spare-Parts Inventory by Criticality
Link spare parts to asset tiers so you stock deep on Tier 1 components (UPS capacitors, chiller compressors) and thin on Tier 4. Facilities using tier-linked inventory typically reduce carrying cost 20–30% while improving first-time fix rate on critical assets.
Maintenance Analytics & Audit Trail
Every completed work order feeds back into the asset's history, so your criticality scores stay current. When an auditor or insurance assessor asks how you prioritize maintenance, you show them a live dashboard — not a stale spreadsheet from 18 months ago.
5 Criticality Assessment Mistakes That Undermine Data Centers Reliability
Scoring assets in isolation instead of by system
A single CRAC unit might score low because N+1 redundancy absorbs its failure. But if all six CRACs share a common water supply header, that header is a Tier 1 single point of failure. Always score at both the component and system level.
Setting it and forgetting it
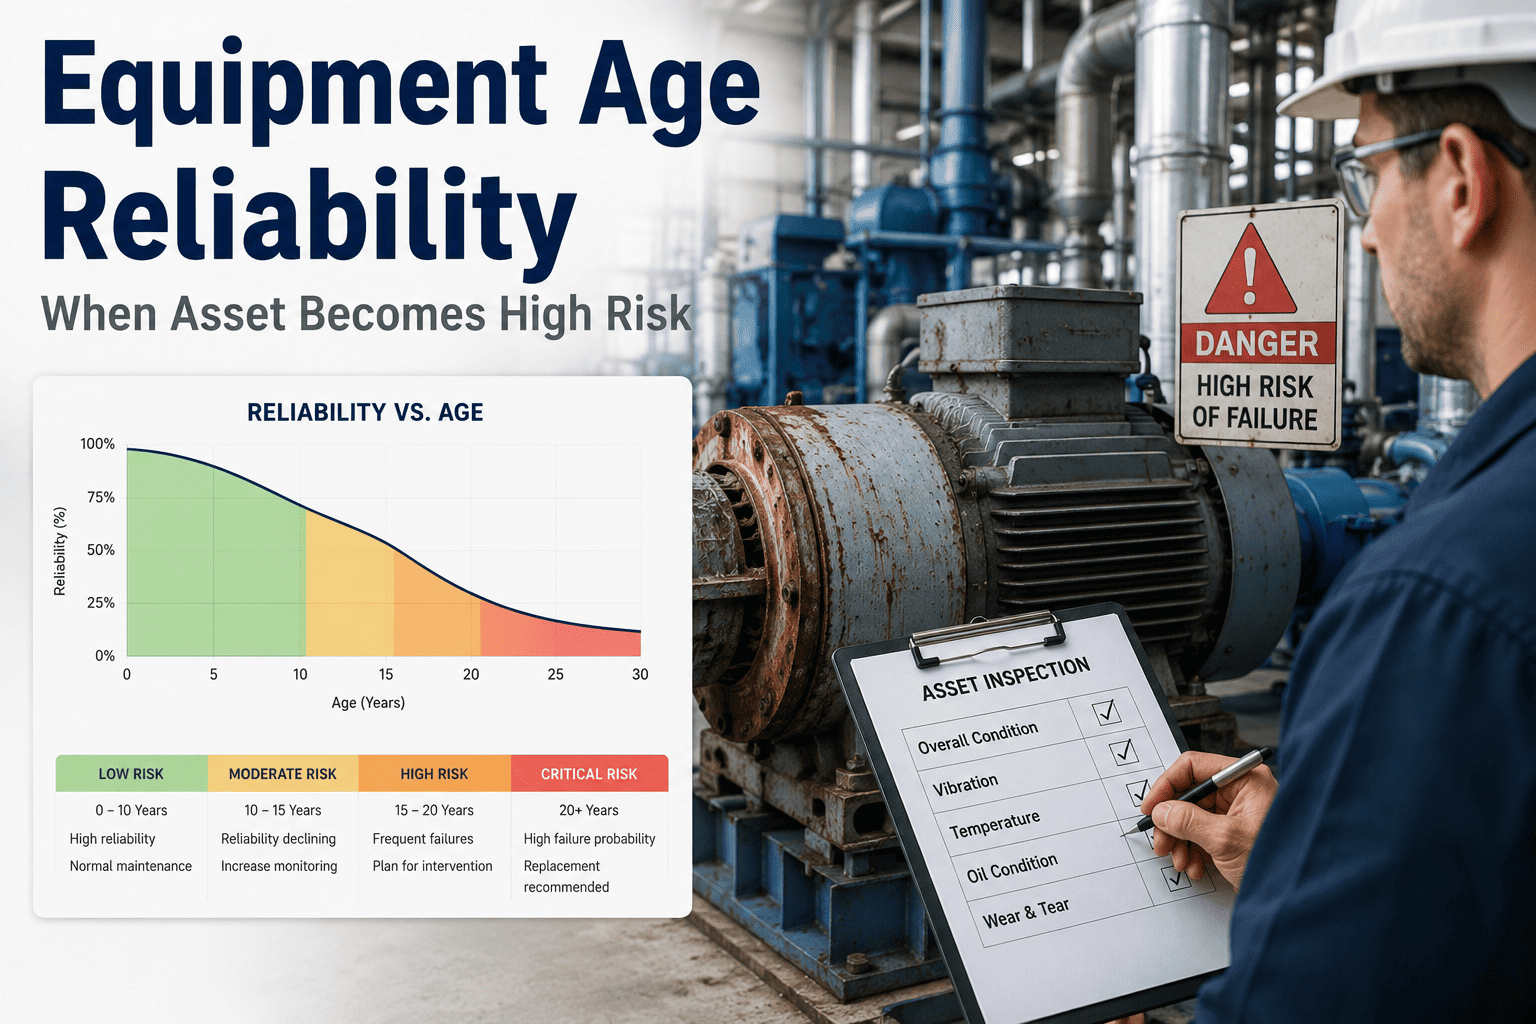
A criticality matrix completed during commissioning is stale within 12–18 months. Equipment ages, loads change, redundancy configurations evolve. Re-score annually, or trigger a re-assessment after any major capital project or outage event.
Letting one person score everything
A single engineer's bias skews scores. The template works best with a 3-person panel: a reliability engineer, a senior technician, and a facilities manager. Each scores independently, then the group reconciles differences. This catches blind spots and builds buy-in.
Ignoring consequence of failure detection time
Two assets with identical failure consequences can have very different risk profiles if one fails silently (a slow refrigerant leak) and the other fails loudly (a generator that won't start during a monthly test). Add a detectability modifier to your scoring if your facility has assets that can degrade without triggering alarms.
Never connecting the matrix to actual work orders
The most common failure mode: the matrix lives in a binder or a shared drive, and the maintenance team never sees it. If your criticality tiers don't drive your PM schedule, your spare-parts stocking, and your capital plan, the assessment was a waste of time. This is exactly the problem OxMaint solves — Book a Demo to see how it works.
Frequently Asked Questions About Data Centers Criticality Assessment
What is an asset criticality matrix for data centers?
An asset criticality matrix is a scoring tool that ranks every maintainable asset in a data center by the consequence of its failure across safety, uptime, and cost dimensions. Each asset receives a weighted score that maps to a tier (1–4), which determines its maintenance strategy — from continuous predictive monitoring for Tier 1 assets to run-to-failure for Tier 4. It's the foundation of risk-based prioritization in data center maintenance.
How often should a data center update its asset criticality ranking?
At minimum, re-score annually. You should also trigger a re-assessment after any major capital project (new UPS installation, cooling system upgrade), after a significant unplanned outage, or when IT load density changes by more than 15–20%. Facilities that treat the matrix as a living document — updated inside a CMMS like OxMaint — maintain more accurate risk profiles than those using static spreadsheets.
What is the difference between RCM and a criticality matrix in data centers?
A criticality matrix ranks assets by consequence of failure — it tells you which assets matter most. Reliability-Centered Maintenance (RCM) goes deeper: it analyzes failure modes for each critical asset and selects the optimal maintenance task (predictive, preventive, or run-to-failure) for each failure mode. The criticality matrix is the first step; RCM is the detailed analysis you apply to Tier 1 and Tier 2 assets. Most data centers start with the matrix and apply full RCM only to their top 15–20% of assets.
How many assets in a typical data center should be Tier 1?
In most facilities, 10–20% of assets score as Tier 1. If more than 25% of your assets are Tier 1, your scoring criteria are likely too loose — which defeats the purpose of prioritization. If fewer than 5% are Tier 1, you may be under-scoring safety or uptime consequences. The template's default thresholds (60–75 for Tier 1) produce a 12–18% Tier 1 population in most colocation and enterprise facilities.
Can I use this criticality template with my existing CMMS?
Yes — the template is platform-agnostic. You score assets in the spreadsheet, then import the tier assignments into any CMMS as a custom field or tag. OxMaint makes this especially easy: bulk-import your asset list, apply tier tags, and the platform auto-generates tier-based PM schedules and priority-sorted work order queues. Start Free Trial and import your first 100 assets in under 15 minutes.
Stop Guessing Which Assets Matter Most
Download the template, score your assets, and plug the results into OxMaint — your team gets a risk-prioritized maintenance plan from day one.