Managing fleet maintenance costs is the difference between a profitable operation and one hemorrhaging money through emergency repairs. Industry data shows maintenance costs ranging from $0.20 to $1.10 per mile depending on vehicle age and maintenance strategy — a gap representing $18,000 to $45,000 annually per vehicle at typical commercial mileage. The fleets achieving the lowest cost per mile share one trait: complete visibility into where every maintenance dollar flows, tracked in real time through CMMS platforms. Without granular cost tracking at the vehicle and work order level, reactive spending patterns persist invisibly until budget overruns force emergency cost-cutting measures that worsen the underlying problem. Start a free trial to track cost per mile, labor efficiency, and parts spend by vehicle — or book a demo to see real-time cost dashboards configured for your fleet type.
Fleet Operations / Cost Management
Fleet Maintenance Costs: Complete Budget Planning & Cost Reduction Guide
Break down labor, parts, downtime, and hidden costs — learn how CMMS platforms reduce cost per vehicle by 25-35% through preventive maintenance optimization, real-time cost tracking, and data-driven replacement decisions.
$0.202
per mile average
Industry average maintenance cost per mile in 2026 — representing 8.9% of total fleet operating expenses across commercial vehicles
3-9×
reactive cost premium
Reactive breakdowns cost 3 to 9 times more than planned preventive maintenance per repair event — not including downtime and schedule disruption
$16,192
annual cost per truck
Average annual repair and maintenance cost for heavy-duty commercial trucks in the United States — up 3.7% year-over-year through Q4 2025
33.5%
spend on aging assets
Vehicles over 10 years old account for only 12% of miles driven but consume 33.5% of total maintenance spend — cost per mile rises to $1.10 vs $0.20 for newer vehicles
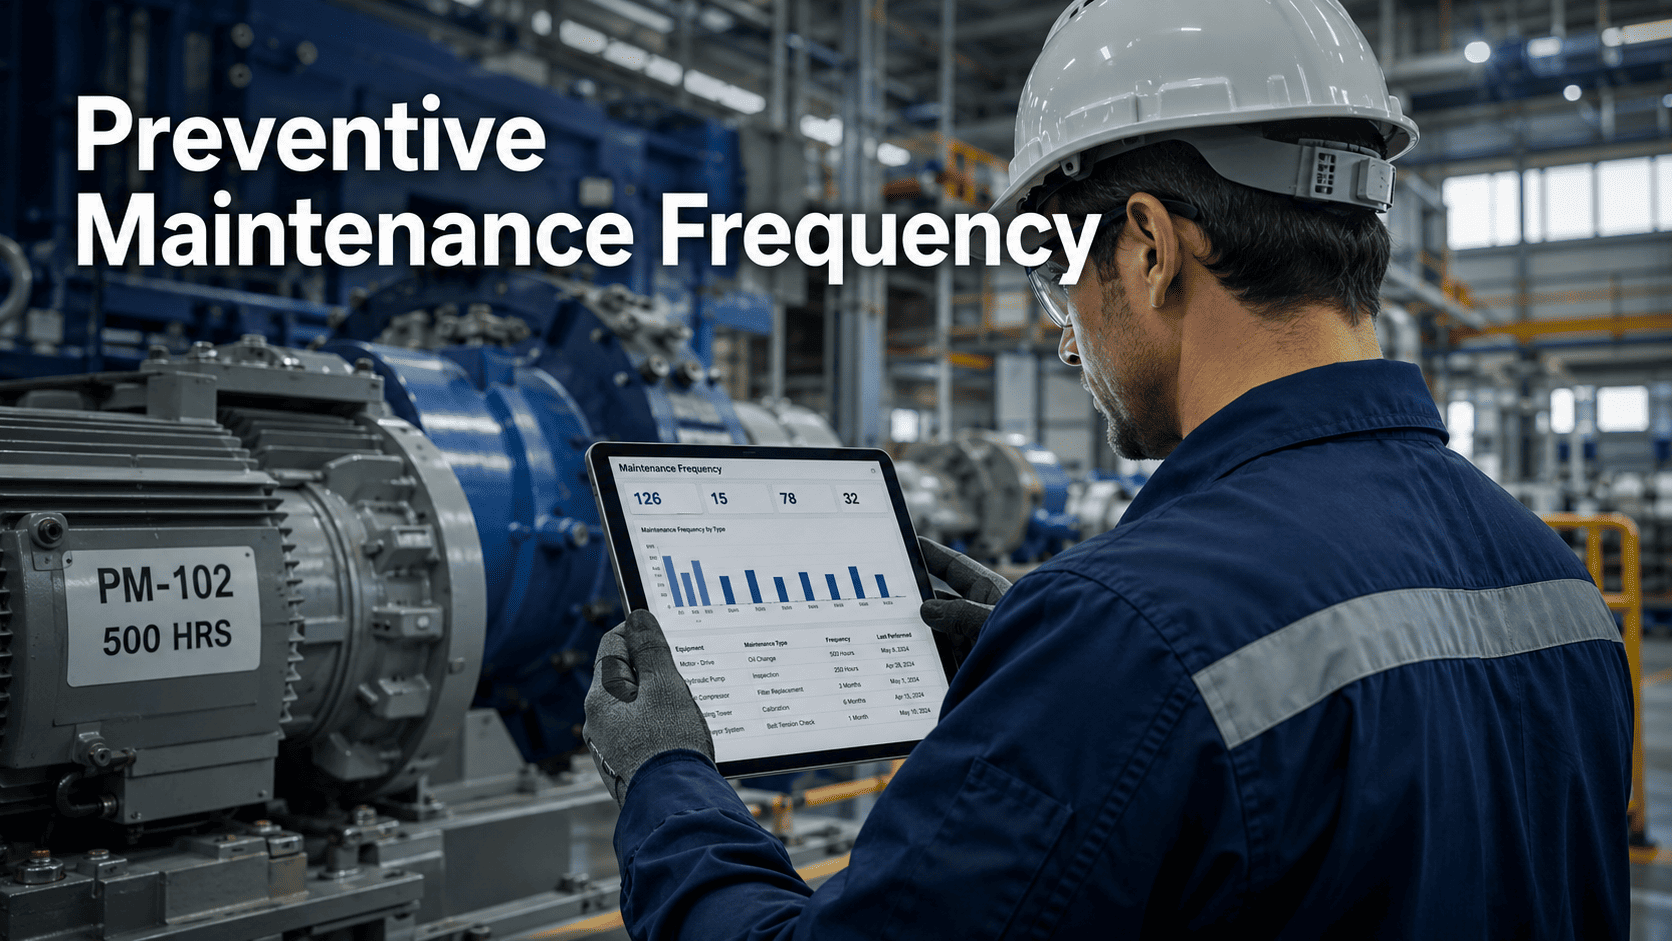
Track Every Maintenance Dollar with Real-Time Cost Analytics
OxMaint automatically captures labor hours, parts costs, and vendor invoices at work order close — calculating cost per mile, cost per vehicle, and reactive vs planned spending in real time without manual data entry. See exactly where your maintenance budget flows and which vehicles are draining profitability. Stop guessing where money goes and start a free trial or book a demo to explore fleet cost dashboards built for your operation.
Understanding Fleet Maintenance Cost Structure
Fleet maintenance costs distribute across six major categories — each with different optimization levers and different impact on total cost of ownership. The fleets that control costs most effectively track all six categories separately at the vehicle level, identifying which categories are trending up and which vehicles are consuming disproportionate resources. Generic fleet-wide averages hide the problem vehicles bleeding money and delay replacement decisions until the damage compounds across fiscal quarters.
The breakdown below shows typical cost distribution for commercial fleets operating Class 7-8 vehicles in North America. The percentages shift for lighter vehicles and specialized equipment, but the category structure remains consistent. Understanding which category dominates your spend reveals where cost reduction efforts deliver maximum ROI. Fleets spending 60% on reactive repairs achieve immediate savings by shifting spend toward preventive maintenance — but you cannot shift what you cannot measure. See how OxMaint's cost tracking works or schedule a demo for cost breakdown analysis.
Technician wages, benefits, overtime pay, training, and supervision overhead. Labor is the largest single cost category for most fleets — yet average technician wrench time sits at only 58-65% without proper work order systems.
Optimization Lever
Increase wrench time from 58% to 80% through CMMS work order management — reducing waiting time for parts, searching for information, and unclear task descriptions
A 15% improvement in technician utilization translates to 6-7% reduction in total maintenance costs — often $1,500 to $3,000 per vehicle annually
Replacement components, consumables like filters and fluids, tires, brake systems, and emergency expedited parts. Parts costs rose 3.7% year-over-year through Q4 2025 with tariff-driven increases on steel and aluminum components adding further pressure.
Optimization Lever
Eliminate emergency parts orders that carry 3-5× standard pricing through better PM compliance and inventory forecasting
Bulk purchasing reduces per-unit cost 15-25% on commodity items — negotiate fixed pricing agreements for 6-12 month terms to hedge against tariff increases
Third-party vendor services, dealership repairs, specialty work beyond in-house capability, and warranty-covered repairs. Tracking which repairs go external vs in-house reveals opportunities to bring high-volume work in-house or renegotiate vendor pricing.
Optimization Lever
Track vendor pricing per repair type — fleets with CMMS vendor cost tracking negotiate 12-18% better rates by showing volume data
Capture warranty-covered work properly — many fleets miss 40-50% of valid warranty claims due to inadequate documentation at repair time
8%
Shop Supplies & Overhead
Facility costs, tools and equipment, cleaning supplies, safety equipment, waste disposal, and shop utilities. Often treated as fixed overhead but varies significantly with maintenance volume and technician efficiency.
Optimization Lever
Reduce shop time per work order through better task planning — every hour saved reduces overhead allocation per repair
Track overhead cost per completed work order to identify baseline and measure improvement as PM compliance reduces total work order volume
Tire purchases, mounting, balancing, brake pad replacements, rotor resurfacing, and brake system repairs. Commercial truck tires cost $1,500 to $3,000 per set with wear rates varying significantly based on driving habits and load weight.
Optimization Lever
Extend tire life 20-30% through proper inflation monitoring and rotation scheduling — tracked automatically in CMMS PM schedules
Driver behavior monitoring reduces harsh braking that accelerates brake wear — fleets with telematics integration see 15-25% longer brake intervals
CMMS subscription costs, telematics platforms, diagnostic tools, and fleet management software. Typically $14 to $45 per vehicle per month depending on feature set — but generates 10-15× ROI through cost reductions in all other categories.
Optimization Lever
CMMS platforms reduce total maintenance costs by 25-35% through PM optimization, parts management, and labor efficiency gains — payback in 4-8 months
The 1% spent on software controls the other 99% — fleets without CMMS lack visibility to optimize any category effectively
Cost Per Mile: The Single Most Important Fleet Metric
Cost per mile normalizes maintenance spending across vehicles with different usage patterns — allowing true apples-to-apples comparison. A vehicle costing $50,000 annually in maintenance sounds expensive, but at 100,000 miles that's $0.50 per mile. Another vehicle at $30,000 annual maintenance running only 40,000 miles costs $0.75 per mile — actually more expensive per unit of work performed.
The table below shows 2026 industry benchmarks by vehicle type and age. Best-in-class fleets operate 20-30% below these averages through structured CMMS-driven preventive maintenance. The gap between average and best-in-class represents the optimization opportunity available in your fleet right now. Track your own cost per mile in OxMaint's real-time dashboards or book a demo for cost benchmarking analysis.
5.5×
Vehicles over 10 years old cost 5.5 times more per mile than vehicles under 5 years — driven by major component failures between 150,000 and 200,000 miles. Without per-vehicle cost tracking, fleets often spend $15,000 to $20,000 repairing a vehicle worth $8,000. The replacement decision requires cost trend data, not arbitrary age cutoffs.
Hidden Costs That Don't Appear on Maintenance Invoices
Direct repair costs represent only 60-70% of true fleet maintenance expense. The remaining 30-40% consists of indirect costs that rarely appear on standard budget reports — yet directly impact profitability and operational capacity. Fleets that track only invoice totals systematically underestimate total cost of ownership and make replacement decisions based on incomplete financial pictures.
Revenue Loss
Downtime & Missed Deliveries
$448-760 per day per vehicle
Lost productivity while vehicles sit in the shop waiting for parts or repair completion. Reactive fleets experience 3-5× more unplanned downtime than preventive maintenance operations. A single breakdown cascades into schedule disruptions, customer penalties, and expedited shipping for replacement parts.
Premium Pricing
Emergency Parts Orders
3-5× standard cost
Expedited shipping and emergency vendor calls when parts are needed urgently versus planned procurement through proper inventory management. A $200 part ordered overnight becomes $600-1,000 with shipping and rush fees. Poor PM compliance generates chronic emergency ordering patterns.
Warranty Miss
Uncaptured Warranty Claims
40-50% left unclaimed
Repairs performed in-house that should be warranty-covered, missed claim deadlines due to poor documentation, and inadequate records that cause valid claims to be rejected. Fleets without CMMS warranty tracking leave thousands per vehicle on the table annually.
Labor Waste
Overtime & Rush Labor
1.5-2× regular rate
Weekend and after-hours repairs to get broken vehicles back in service — typically at time-and-a-half or double-time rates. Preventive maintenance happens during normal business hours at standard rates. Every reactive breakdown risks overtime labor charges.
Asset Value
Depreciation Acceleration
20-30% lower resale
Vehicles with clean, documented maintenance histories command significantly higher resale values. CMMS-tracked maintenance records prove the vehicle was properly maintained — buyers pay premium for that certainty. Poor documentation destroys residual value.
Administrative
Manual Cost Tracking
8-12 hours per month
Spreadsheet maintenance, invoice entry, cost allocation, and report generation when fleet maintenance cost data is not automatically captured. CMMS platforms eliminate this administrative burden entirely — costs flow directly from work order closure to financial dashboards.
Reactive vs Preventive: The Cost Comparison That Justifies CMMS Investment
The single most powerful cost reduction lever in fleet maintenance is the shift from reactive to preventive spending. Every percentage point moved from reactive repairs to planned preventive maintenance generates measurable cost savings — because reactive work costs 3 to 9 times more per event before accounting for downtime and secondary damage.
The comparison table below shows actual cost differences between reactive breakdown repairs and equivalent preventive maintenance tasks. The data proves why fleets with 85%+ PM compliance spend dramatically less per vehicle than fleets operating reactively. You cannot execute this strategy without visibility into which work orders are reactive vs planned — track PM compliance automatically or book a demo to see reactive vs planned cost breakdowns.
Reactive Breakdown Repair
Engine Failure
$15,000-35,000
Major overhaul or replacement after catastrophic failure — includes towing, diagnostics, teardown, parts at emergency pricing, extended labor, and 5-7 days downtime
Transmission Replacement
$8,000-18,000
Full replacement after failure during operation — emergency vendor call, rush shipping, rental vehicle during repair, and customer impact from missed deliveries
Brake System Failure
$3,500-6,000
Catastrophic brake failure requiring rotor replacement, caliper rebuild, and complete system flush — plus DOT violation risk and safety incident exposure
Cooling System Breakdown
$2,800-5,200
Roadside overheating leads to head gasket damage, radiator replacement, and potential engine damage — towing, diagnostics, and expedited parts add to base repair cost
Average Cost: $7,325 per event
Preventive Maintenance
Scheduled Oil Analysis
$800-1,500
Regular oil changes, filter replacements, and fluid analysis detect engine wear early — addressing minor issues before catastrophic failure occurs
Transmission Service
$450-900
Fluid flush, filter replacement, and inspection at manufacturer intervals — extends transmission life by 40-60% and prevents sudden failure
Brake Inspection & Service
$350-650
Pad replacement before rotor damage, caliper lubrication, fluid testing — scheduled during low-demand periods at standard labor rates
Cooling System PM
$280-520
Coolant flush, hose inspection, pressure testing — catches small leaks and worn components before they cause overheating or engine damage
Average Cost: $470 per event
15.6×
Reactive repairs cost 15.6 times more than equivalent preventive maintenance in the examples above — and that's before accounting for downtime, lost revenue, customer impact, and safety risk. Every 10% shift from reactive to preventive reduces total fleet maintenance costs by 8-12%. The goal is not zero reactive work — some failures are unpredictable — but driving reactive spend below 20% of total maintenance budget.
How CMMS Reduces Fleet Maintenance Costs by 25-35%
The cost reduction from CMMS implementation comes from six specific mechanisms — not from the software itself, but from the process changes the software enables and enforces. Fleets that implement CMMS without changing their underlying maintenance practices see minimal benefit. Fleets that use CMMS to drive PM compliance, track costs by vehicle, and measure technician efficiency achieve 25-35% total cost reduction within 12 months.
Primary
Automated PM Scheduling Prevents Costly Failures
CMMS platforms generate preventive maintenance work orders automatically based on mileage, engine hours, or calendar intervals — ensuring no PM ever gets missed due to scheduling oversight. Vehicles are flagged for service before they exceed intervals, technicians receive work orders with complete task lists, and management sees PM compliance rates in real time.
Impact: 40-50% reduction in reactive breakdown repairs
Fleets improving PM compliance from 72% to 85% generate $1,800-2,400 per vehicle in Year 1 savings through avoided emergency repairs. The cost of a missed oil change is not the $120 service — it's the $8,000 engine repair that follows.
Labor
Work Order Management Increases Wrench Time 20%+
Average technician wrench time without CMMS sits at 58-65% — the rest is spent waiting for parts, searching for repair history, clarifying vague work orders, and hunting down vehicle information. CMMS work orders include complete repair history, parts pre-staged from inventory, clear task descriptions, and diagnostic codes.
Impact: 20-30% increase in technician productivity
Pushing wrench time from 60% to 78% means completing the same work with fewer labor hours — or completing more work with the same staff. A 15% technician utilization improvement saves $1,500-3,000 per vehicle annually on labor costs.
Parts
Inventory Management Eliminates Emergency Orders
CMMS platforms track parts usage by PM schedule and historical consumption patterns — automatically triggering reorder notifications when quantities fall below preset thresholds. Fleets stock the right parts based on actual usage data rather than guesswork, eliminating both stockouts and overstock.
Impact: 15-25% reduction in parts costs
Emergency parts orders at 3-5× standard pricing disappear when parts are in stock for scheduled PM work. Better demand forecasting enables bulk purchasing at 15-25% discounts on commodity items like filters, fluids, and wear components.
Data
Cost Per Mile Tracking Drives Replacement Decisions
CMMS automatically calculates cost per mile at the vehicle level — capturing every labor hour, every part, and every vendor invoice against total miles driven. When cost per mile exceeds replacement threshold (typically 40-45% of current vehicle value annually), the data triggers replacement analysis rather than continuing to pour money into aging assets.
Impact: $8,000-15,000 saved per vehicle held too long
Fleets without cost tracking often spend $15,000-20,000 repairing vehicles worth $8,000. Per-vehicle cost trend data identifies the exact month when replacement becomes more economical than continued repair — preventing the slow bleed of bad assets.
Warranty
Warranty Tracking Recovers 40-50% More Claims
CMMS platforms link every component to its purchase date, warranty expiration, and claim history — flagging warranty-eligible failures at repair time rather than discovering coverage after the work is completed. Complete repair documentation supports warranty claims that would be rejected with paper logs.
Impact: $2,000-4,000 recovered per vehicle annually
Fleets without automated warranty tracking miss 40-50% of valid claims due to missed deadlines, incomplete documentation, or simply not knowing a component was under warranty. CMMS warranty modules eliminate this lost recovery entirely.
Vendor
Vendor Cost Analytics Enable Better Negotiation
CMMS captures every outsourced repair with vendor name, service type, and total cost — building a complete vendor performance database. Fleets can compare pricing across vendors for identical repair types, identify high-cost outliers, and negotiate volume-based pricing with data showing annual spend by vendor.
Impact: 12-18% reduction in vendor pricing
Showing a tire vendor that you spent $180,000 with them last year enables better pricing negotiation than calling for a quote on individual purchases. Volume data is negotiating leverage — but only if you track it.
Fleet Maintenance Budget Planning: How to Build Accurate Forecasts
Most fleet maintenance budgets are built on last year's spend plus an inflation adjustment — a method that perpetuates inefficiency and provides no visibility into where cost increases originate. The correct approach builds budgets bottom-up from vehicle-level cost data, PM schedules, and planned major component replacements rather than fleet-wide historical averages.
The framework below shows the five-step process for data-driven fleet maintenance budgeting. Fleets using this approach achieve 8-12% better budget accuracy and identify cost reduction opportunities during the planning process rather than discovering overruns in monthly reviews. Build your own budget with OxMaint's budget planning tools or schedule a demo for guided budget development.
1
Calculate Historical Cost Per Mile by Vehicle
Pull 12-24 months of maintenance cost data from CMMS at the vehicle level. Calculate cost per mile for each vehicle by dividing total maintenance spend by total miles driven. Identify vehicles with escalating cost trends that may require replacement within the budget period.
2
Project Annual Mileage by Vehicle
Forecast miles for the upcoming year based on route assignments, utilization rates, and any planned operational changes. New contracts, service expansions, or fleet reductions directly impact maintenance budget requirements through mileage changes.
3
Schedule All Preventive Maintenance
List every PM task due within the budget period based on mileage projections and calendar intervals. Include oil changes, inspections, brake service, tire rotations, and all manufacturer-recommended maintenance. Cost each PM task using historical average costs per service type.
4
Plan Major Component Replacements
Identify vehicles approaching major component replacement intervals — engines over 400,000 miles, transmissions over 300,000 miles, aging battery packs on EVs. Budget for planned replacements rather than treating them as unexpected reactive costs when they fail.
5
Add Reactive Contingency
Reserve 15-25% of total planned maintenance budget for unplanned reactive repairs. Fleets with 85%+ PM compliance budget at the low end of this range. Reactive fleets budget higher — but the goal is to reduce reactive contingency year-over-year through PM improvement.
Annual Fleet Maintenance Budget =
(Planned PM Costs + Major Component Replacements) × (1 + Reactive Contingency %)
This bottom-up approach produces budgets 8-12% more accurate than top-down historical averaging — and surfaces replacement timing decisions during planning rather than mid-year budget amendments.
What OxMaint Delivers for Fleet Cost Management
CPM
Real-Time Cost Per Mile Dashboards
Every work order automatically feeds cost per mile calculations at vehicle, asset class, and fleet levels — no manual data entry or spreadsheet maintenance required. See which vehicles are exceeding cost thresholds in real time rather than discovering problems in quarterly reviews. Filter by date range, compare periods, and export cost trends for budget planning.
Track your fleet's cost per mile or
book a demo for cost dashboard walkthrough.
PM
Automated PM Scheduling
Configure preventive maintenance schedules by mileage, engine hours, or calendar intervals with automatic work order generation before due dates. Vehicles flagged for service appear on technician dashboards with complete task lists, required parts pre-staged from inventory, and historical repair notes. PM compliance tracked as KPI with trend analysis showing reactive vs planned spending shift over time.
INV
Parts Inventory & Cost Tracking
Track parts consumption by vehicle and service type — automatically triggering reorder notifications based on historical usage patterns and upcoming PM schedules. Eliminate emergency orders through better forecasting. Bulk purchasing recommendations generated from usage data. Every part withdrawal linked to work order for complete cost attribution to specific vehicles.
WRN
Warranty Management & Recovery
Link every component to its purchase date and warranty period — automatically flagging warranty-eligible repairs at work order creation. Track warranty claims from submission through approval with vendor, claim amount, and recovery date. Generate warranty recovery reports showing total claims recovered vs potential claims missed. Capture the 40-50% of warranty value fleets typically leave unclaimed.
VND
Vendor Cost Analytics
Every outsourced repair captured with vendor, service type, labor hours, parts costs, and total invoice — building complete vendor performance database. Compare pricing across vendors for identical repair types. Identify high-cost outliers. Generate annual spend reports by vendor to support pricing negotiations. Track vendor response time, quality issues, and repeat failures for vendor selection decisions.
RPT
Budget Planning & Forecasting
Build annual maintenance budgets from vehicle-level cost data, projected mileage, and scheduled PM tasks rather than fleet-wide historical averages. Identify vehicles approaching major component replacement intervals. Plan replacement timing based on cost trend analysis. Export budget justification reports with vehicle-specific cost breakdowns and PM schedules supporting budget requests.
Stop Guessing Where Fleet Maintenance Dollars Go — Track Every Cost in Real Time
OxMaint captures labor, parts, vendor invoices, and downtime at work order close — calculating cost per mile, reactive vs planned spend, and vehicle-level profitability without manual data entry. Join fleets reducing maintenance costs 25-35% through PM optimization, better parts management, and data-driven replacement decisions. See exactly where your money flows and where savings hide —
start your free trial or
book a demo now.
Frequently Asked Questions
What is the average fleet maintenance cost per vehicle in 2026?
Heavy-duty trucks average $16,192 annually, school buses $5,500-7,500, and transit buses $22,000-38,000. Industry average is $0.202 per mile with best-in-class fleets achieving $0.12-0.18 per mile through CMMS-driven preventive maintenance.
Book a demo for cost benchmarking.
How much does reactive maintenance cost compared to preventive maintenance?
Reactive repairs cost 3-9× more than preventive maintenance — a reactive engine failure runs $15,000-35,000 vs $800-1,500 for scheduled oil analysis. Every 10% shift from reactive to preventive reduces total fleet costs by 8-12%. Fleets improving PM compliance from 72% to 85% save $1,800-2,400 per vehicle annually.
What percentage of fleet maintenance budget should go to preventive vs reactive work?
Best-in-class fleets allocate 75-85% to preventive maintenance and 15-25% to reactive repairs. Average fleets operate closer to 60% preventive and 40% reactive.
Track reactive vs planned spending in OxMaint to measure PM programme effectiveness.
When should I replace a fleet vehicle based on maintenance costs?
Replace when annual maintenance exceeds 40-45% of current vehicle value — typically at 6-8 years or 400,000-600,000 miles. Vehicles over 10 years cost $1.10 per mile vs $0.20 for newer vehicles (5.5× difference). Without per-vehicle cost tracking, fleets often spend $15,000-20,000 repairing vehicles worth $8,000.
Schedule a demo for replacement analysis tools.