Every maintenance budget request without data behind it dies in the boardroom. Finance teams do not reject CMMS proposals because the technology is unproven — they reject them because the person asking cannot quantify what reactive maintenance is currently costing the organization, cannot project what structured PM will save, and cannot show a payback period that fits the capital cycle. This guide gives you every number, framework, and ROI structure you need to build a CMMS business case that gets approved — and shows how Oxmaint makes those numbers real from day one.
How to Build a Business Case That Gets CMMS Approved
Finance needs numbers. Operations needs outcomes. This guide gives you both — plus the exact ROI structure executives respond to.
No heavy implementation · Live in days · Works across multi-site portfolios
It Is Not a Tech Request. It Is a Financial Argument.
A CMMS business case is a structured financial document that shows decision-makers — CFOs, VPs of Operations, board members — exactly what maintenance inefficiency is costing the organization today, what structured maintenance management would cost to implement, and what the net financial benefit looks like over a defined period. Done right, it is not a request for permission. It is a presentation of evidence that makes approval the obvious financial decision.
The common mistake is leading with features. No CFO approves budget for a work order management system because it has a mobile app. They approve it because the alternative — continuing to absorb emergency repair premiums, compliance penalties, and unplanned downtime — is demonstrably more expensive than the software investment. Your business case must make that comparison explicit, numerical, and impossible to dismiss.
Oxmaint gives your maintenance operation the data infrastructure to make this argument continuously — not just at budget time — so start a free trial to begin building your baseline maintenance cost data, or book a demo and we will walk through your specific ROI model with you in 30 minutes.
The 8 Building Blocks of a CMMS ROI Argument
Current total spend on maintenance labor, parts, contractors, and emergency repairs. This is your cost-of-doing-nothing benchmark.
What percentage of your maintenance work is unplanned today vs scheduled. Industry best practice is 80% planned. Most facilities start at 40–50%.
Revenue lost per hour of production or facility downtime. This single number often exceeds the annual CMMS subscription by multiples.
Time currently lost to manual work order routing, paper-based PM tracking, and reactive scheduling. Typically 15–25% of maintenance labor hours.
Reduction in emergency parts purchasing and stock-out events when preventive schedules drive predictable parts demand instead of crisis demand.
OSHA, building codes, environmental regs. Document the fine exposure from current inspection gaps — auditors find this argument compelling.
Properly maintained equipment lasts 20–40% longer. On a $500K HVAC system, that is $100–200K of CapEx deferred through PM. Model this explicitly.
Subscription cost, onboarding time, staff training hours. With Oxmaint, implementation is typically days, not months — which compresses the payback window significantly.
Why Business Cases Get Rejected — and How to Fix Each One
Requesting budget without knowing current maintenance spend signals poor financial awareness. Finance needs a before number to evaluate any after projection.
Listing software capabilities does not answer the CFO's question. Every dollar spent needs a documented savings or risk-avoidance equivalent behind it.
Without a specific payback period calculated from real numbers, finance defaults to treating the request as discretionary. Discretionary spend gets cut first.
Proposals that ignore training time, data migration, or workflow change management lose credibility when the implementation hits predictable friction points.
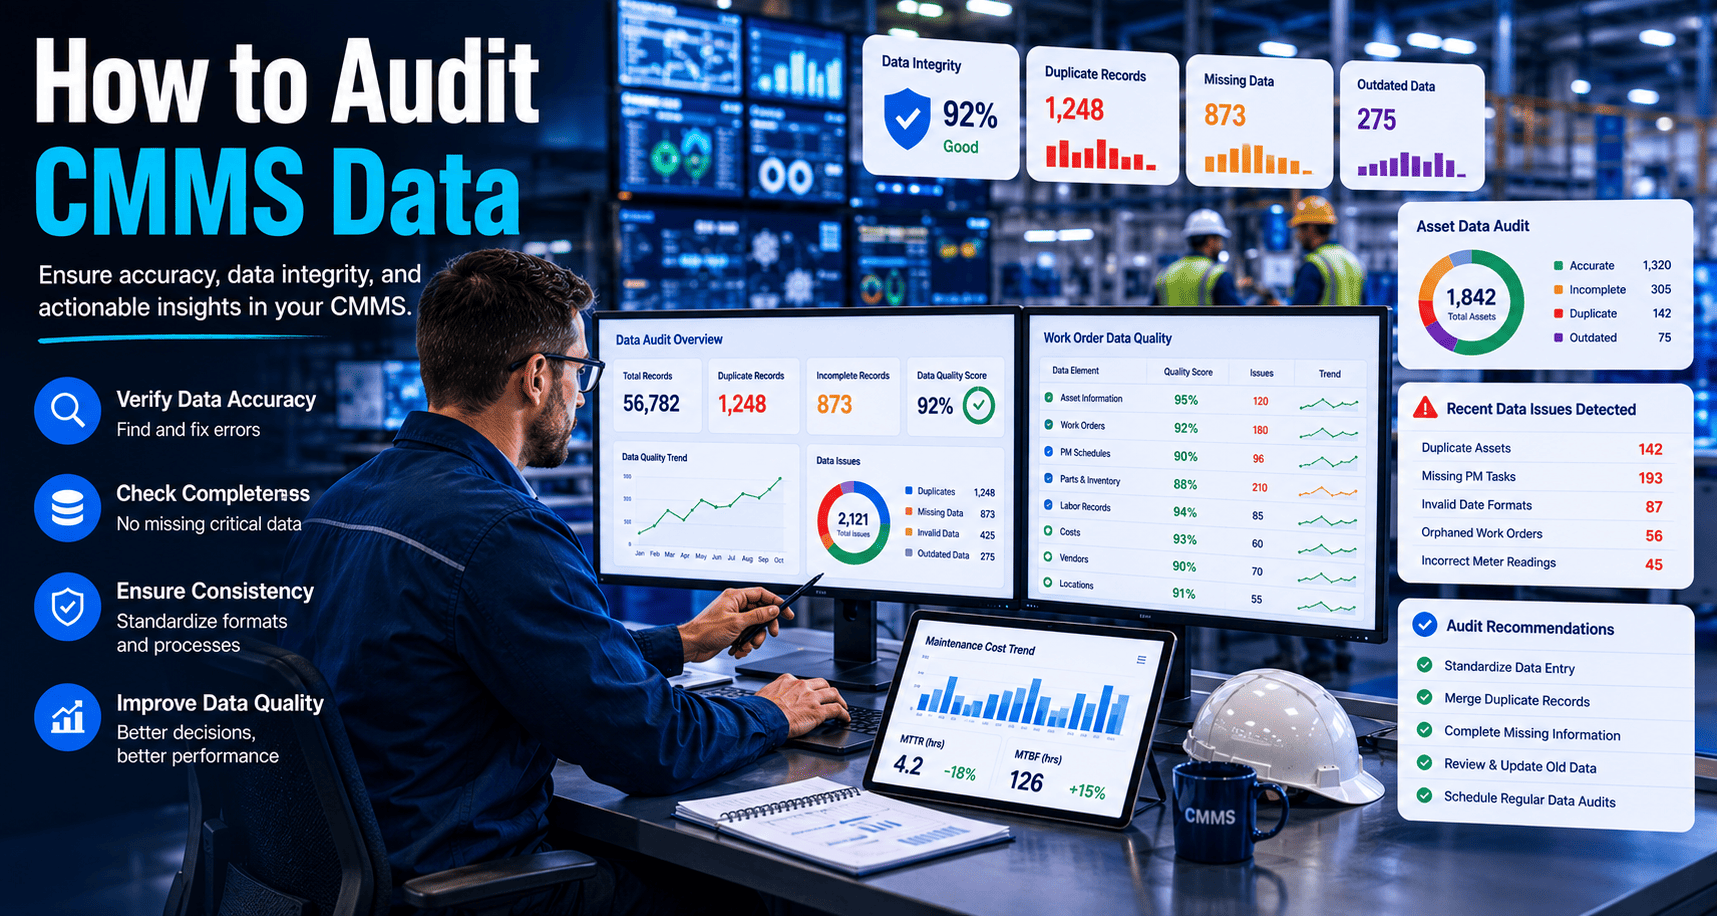
Built-In Data to Strengthen Your Business Case from Day One
Oxmaint tracks labor hours, parts cost, and contractor spend per asset and per site automatically. Your baseline cost number is always current and exportable for finance review.
Dashboard shows exactly what percentage of your work orders were reactive vs scheduled — the most powerful single metric in any CMMS business case presentation.
Rolling CapEx models built from asset condition scoring and replacement cycle data. This gives finance the long-term cost picture that makes infrastructure investment decisions defensible.
Oxmaint goes live in days, not months. No heavy IT project. This compresses the payback period and eliminates the implementation risk argument that kills many proposals.
The Financial Picture Changes Completely
| Cost Category | Before CMMS — Reactive Model | After CMMS — Oxmaint Planned Model |
|---|---|---|
| Emergency Repair Cost | 4.8× planned cost per incident, frequency unchecked | Emergency incidents reduced 35–50% via scheduled PM |
| Labor Utilization | 15–25% of hours lost to reactive dispatching and manual paperwork | Technician time recovered, routes optimized, digital logging |
| Downtime Events | Unplanned, untracked, no cost attribution per asset | Tracked per asset, cost attributed, MTTR measured and improving |
| Parts Inventory | Emergency procurement at spot pricing, frequent stock-outs | Planned demand drives stocking levels, emergency buys drop sharply |
| Asset Lifespan | Untracked degradation, premature replacement decisions | Condition scoring extends average asset life 20–40% |
| CapEx Forecasting | Annual budget guesswork, reactive capital requests | 5–10 year rolling model, investor-grade CapEx reporting |
| Compliance Exposure | Inspection gaps, no audit trail, penalty risk unquantified | GMP-compliant logs, inspection proof, audit-ready documentation |
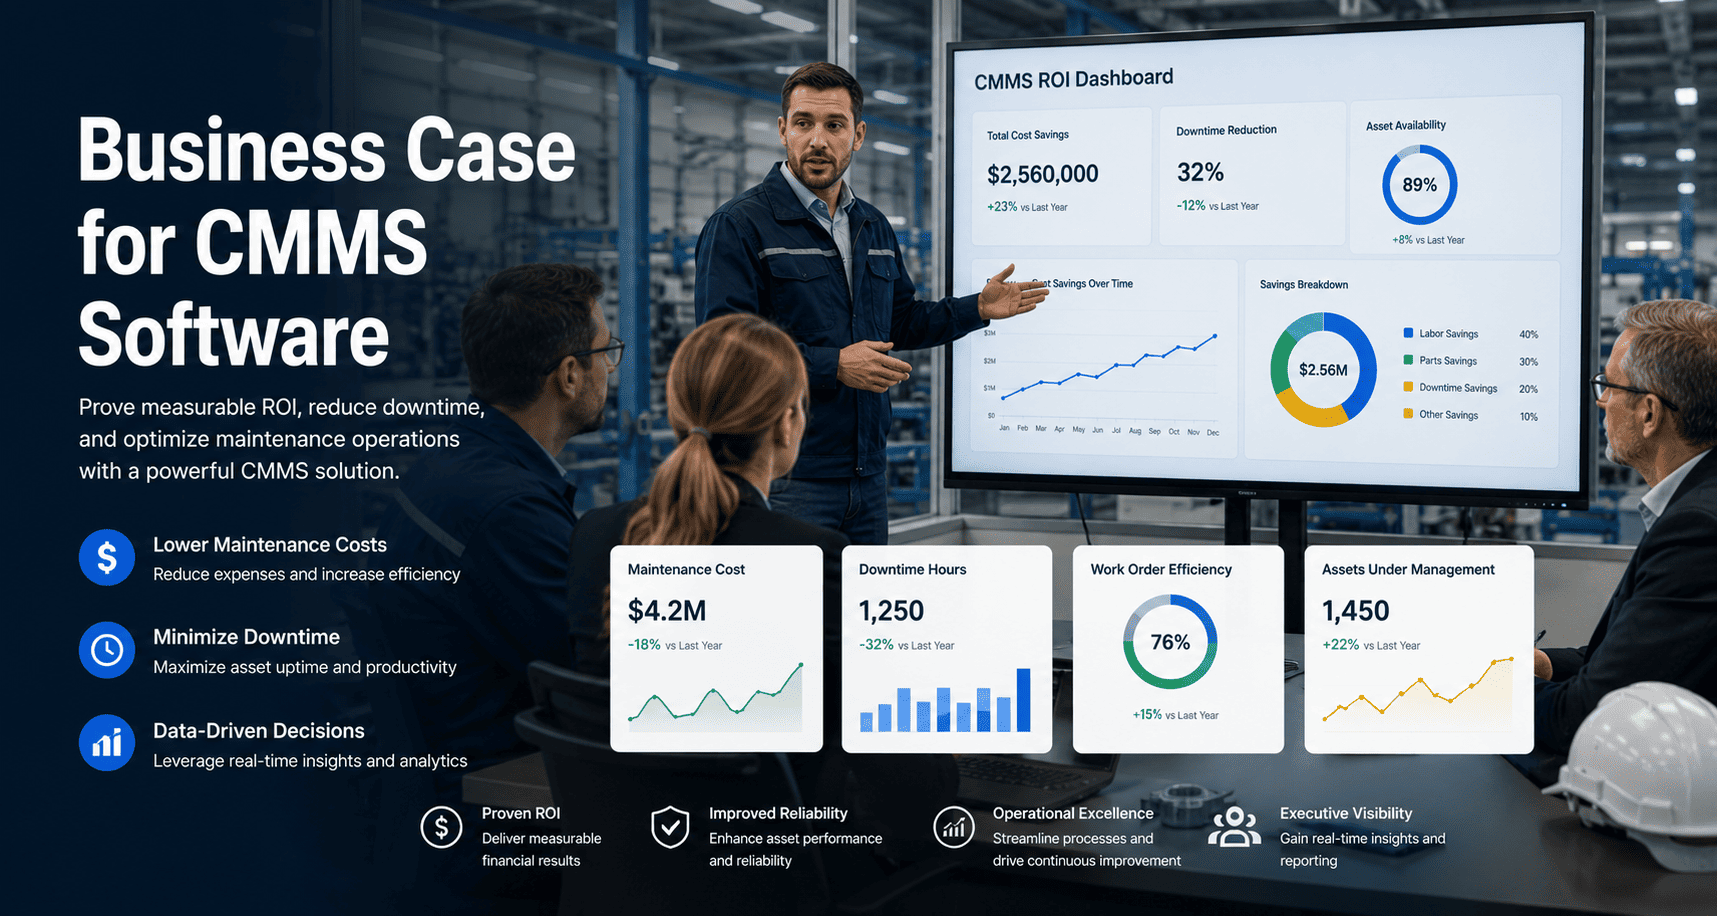
Numbers That Win Board Approval
Finance teams that see these numbers alongside a concrete implementation timeline approve at significantly higher rates — book a demo and we will help you build the exact ROI model for your facility size and asset mix, or start a free trial to begin capturing your baseline cost data today.
CMMS Business Case — What Leaders Ask
What data do I need before building a CMMS business case?
How long does it take for a CMMS to show measurable ROI?
How do I quantify compliance risk for the business case?
Can Oxmaint generate the reports needed to present to a CFO or board?
Stop Losing Budget Battles You Should Be Winning
See exactly how much reactive maintenance is costing your operation — and what a planned maintenance model saves.
- Real-time maintenance cost dashboards for every asset
- Reactive vs planned ratio reporting built in
- 5–10 year CapEx forecasting for executive presentations
Measurable results in the first 30 days. No heavy implementation required.
See Your Asset ROI in 30 Minutes
Start Free Trial Book a DemoUsed by operations teams managing 10,000+ assets