Most maintenance budgets are managed at the department level — total spend vs. budget, reviewed monthly. But that number hides the real story. One aging compressor silently consuming 38% of your annual maintenance budget. Three assets responsible for 60% of your emergency call-outs. A machine that costs more to maintain than it would to replace. Without cost tracked at the asset level, you are managing averages instead of managing problems. Start a free trial and see your maintenance spend broken down by every asset in your portfolio — or book a demo to see how facilities like yours use Oxmaint to identify their highest-cost assets in under 30 minutes.
Cost Optimization · Asset Management
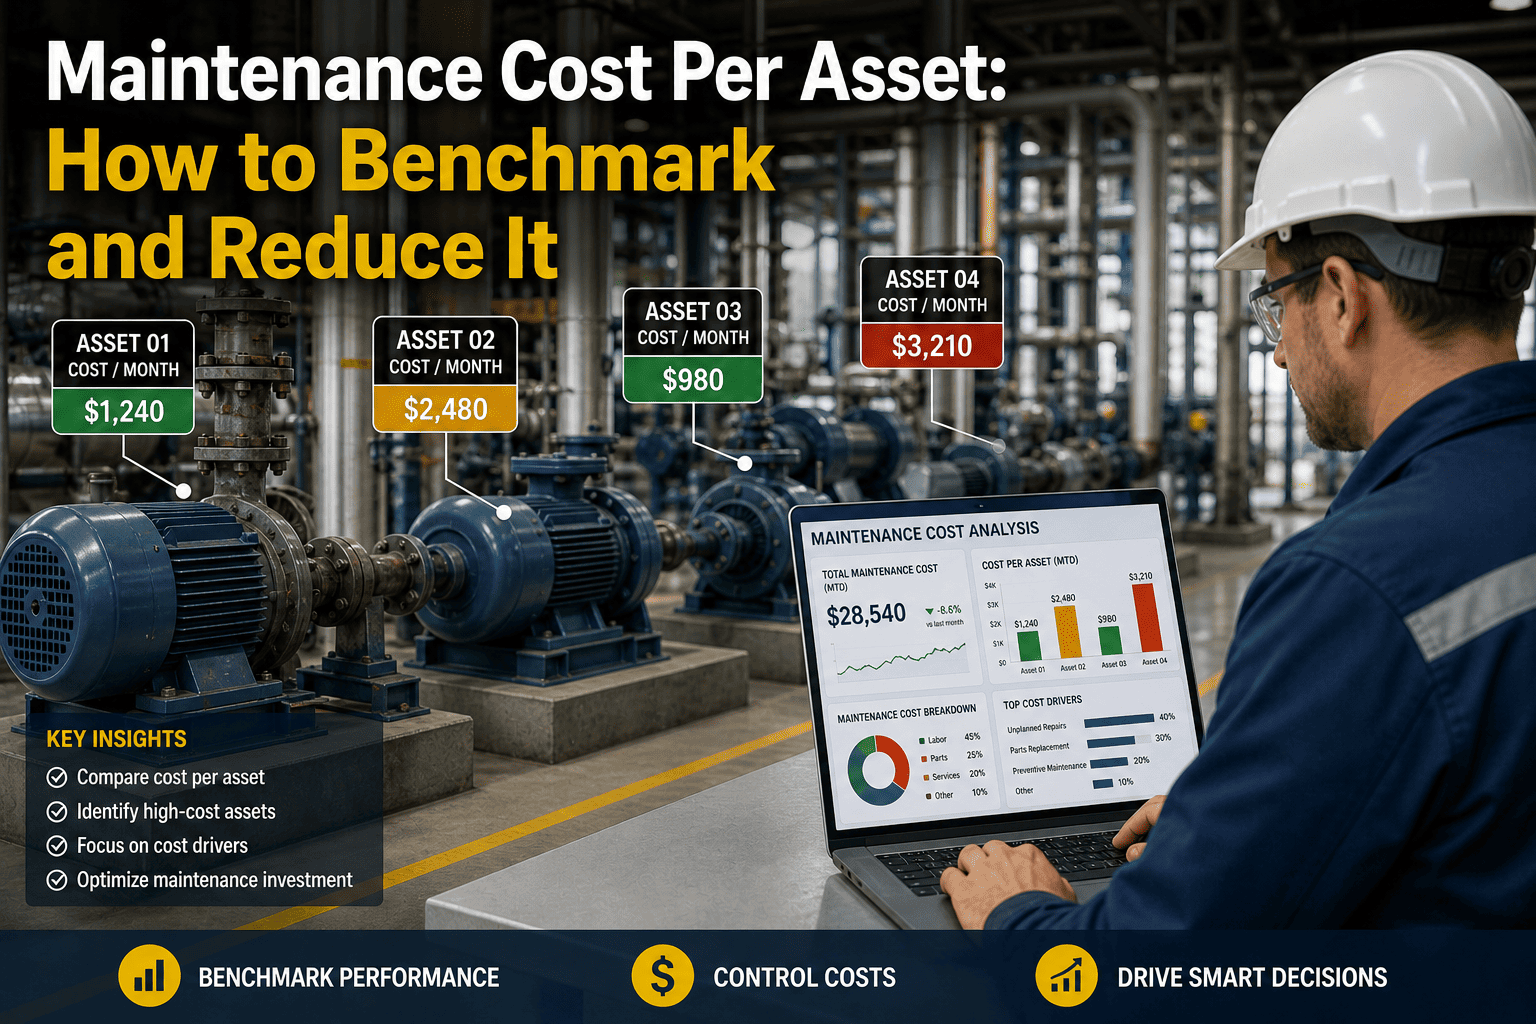
Maintenance Cost Per Asset
Benchmark, Analyze and Reduce Costs Across Your Entire Asset Portfolio
Air Handler AHU-4
$28,600
Chiller #2 flagged — 4.2x above asset class average
4.8x
Emergency vs Planned Cost
Emergency repairs cost 4.8x more than the same work planned in advance
20%
Assets Drive 80% of Costs
The Pareto rule applies — a small fraction of assets consumes most maintenance budget
$18K
Average Annual Hidden Overspend
Per untracked high-cost asset in mid-size commercial facilities
31%
Cost Reduction After Benchmarking
Average maintenance spend reduction after facilities implement asset-level cost tracking
The Basics
What Is Maintenance Cost Per Asset?
Maintenance cost per asset is the total spend — labour, parts, contractor fees, and downtime losses — attributed to a single asset over a defined period. It answers one question your budget report cannot: which specific piece of equipment is costing you the most, and why.
Tracking this at the asset level gives you a factual basis for every CapEx decision, PM frequency adjustment, and replacement conversation. Without it, you are managing a portfolio of unknowns.
Ready to see your asset-level cost breakdown? Start a free trial and connect your existing work order data — or book a demo to walk through a live example with your team.
Framework
4 Metrics That Give Asset Cost Its Full Context
$
Absolute Cost
Total spend on the asset in a period. Useful for budget tracking, not benchmarking. A $40K HVAC cost looks different for a 10,000 sq ft vs 80,000 sq ft building.
%
Cost as % of Asset Value
Industry benchmark: maintenance cost should stay between 2–5% of replacement asset value annually. Above 8% triggers a replacement evaluation. This ratio normalises cost across asset types.
↑
Cost Trend (12-Month)
A rising trend on a stable asset is the earliest signal of deterioration — often 4–6 months before the asset fails visibly. Flat or declining trends indicate effective PM programmes.
÷
Cost Per Operating Hour
Normalises cost against actual asset utilisation. An asset running 6,000 hours/year at $30K spend is far more efficient than one running 1,200 hours at the same cost.
Industry Benchmarks
Maintenance Cost Benchmarks by Asset Class
| Asset Class |
Healthy Range (% of RAV) |
Watch Level |
Replace Evaluation Trigger |
Key Cost Driver |
| Centrifugal Chillers |
2.5–4.5% |
5–7% |
Above 8% |
Compressor and refrigerant |
| Air Handling Units |
1.5–3.5% |
4–6% |
Above 7% |
Fan motors and belts |
| Industrial Boilers |
2–4% |
5–6.5% |
Above 8% |
Burner and heat exchanger |
| Conveyor Systems |
3–6% |
7–9% |
Above 12% |
Belts, bearings, drives |
| Electrical Transformers |
0.5–1.5% |
2–3% |
Above 4% |
Insulation and cooling |
| Centrifugal Pumps |
2–5% |
6–8% |
Above 10% |
Seals and impellers |
| Production CNC Machines |
3–5% |
6–8% |
Above 10% |
Spindles and tooling |
| Elevator and Lift Systems |
1.5–3% |
4–5% |
Above 6% |
Traction motor and controls |
Pain Points
Why Most Facilities Cannot Track This Today
01
Work Orders Not Linked to Assets
Labour and parts are logged against job numbers, not asset IDs. Reconciling spend to a specific asset requires hours of manual cross-referencing — if anyone bothers at all.
02
Spare Parts Cost Pooled at Department Level
MRO spend is tracked by cost centre, not by the asset that consumed the part. A $6,000 bearing replacement disappears into a general supplies line.
03
Contractor Invoices in Finance, Not Maintenance
Specialist contractor costs sit in accounts payable with no connection to the work order or asset record. Maintenance managers never see the full picture.
04
No Historical Trend for Decision-Making
When a replacement decision comes up, there is no cost history to justify it. Managers argue from intuition rather than 36 months of documented spend per asset.
Before vs After
Managing Costs Without vs With Asset-Level Tracking
Budget managed as a department total — no visibility into which assets are driving overruns
Replacement decisions based on age and gut feel, not documented cost vs value
High-cost assets identified only after they trigger a budget review meeting
PM frequency is the same for all assets regardless of their actual cost profile
CapEx proposals built on estimates — board approval takes multiple revisions
Contractor costs invisible until the invoice arrives — no connection to asset record
Every work order, part and contractor fee linked to a specific asset ID automatically
Replacement cases built on 24–36 months of actual documented maintenance spend
High-cost assets flagged in real time when spend exceeds benchmark thresholds
PM frequency adjusted per asset based on cost trend and failure history data
CapEx proposals generated directly from asset cost records — approved faster
Full cost visibility per asset including labour, parts, and contractor in one view
How Oxmaint Solves It
6 Ways Oxmaint Tracks and Reduces Maintenance Cost Per Asset
Asset Registry
Full Asset Cost History in One Record
Every work order, inspection, part issued, and contractor visit is logged against the asset's permanent record — building a complete cost history from day one of adoption.
Work Order Management
Labour Cost Captured at Close
Technicians log actual time spent when closing work orders on mobile. Oxmaint calculates labour cost automatically using configured rates — no manual reconciliation needed.
Parts Inventory
Parts Consumed Linked to Asset, Not Department
When a technician issues a part from inventory, it is linked to the work order and asset automatically. MRO spend is tracked per asset, not pooled into a department line.
Cost Benchmarking
Automatic Benchmark Alerts
Oxmaint compares each asset's annual spend against its replacement asset value and flags assets exceeding configurable thresholds — before the budget meeting, not after.
CapEx Forecasting
Replace vs Repair Powered by Real Data
5–10 year CapEx forecasting models pull directly from each asset's cost history, condition score, and age. Replacement proposals are built on documented evidence, not estimates.
Portfolio Reporting
Cross-Site Cost Benchmarking
Compare maintenance cost per asset class across multiple sites in one view. Identify whether a cost problem is site-specific or systemic — and allocate budget where it creates the most impact.
Want to see these features working on your own asset data? Start a free trial with your existing work orders — or book a demo and we will map your highest-cost assets live in the session.
31%
Average Cost Reduction
Within 12 months of implementing asset-level cost tracking and benchmark alerts
3.2x
Faster CapEx Approval
Proposals backed by documented asset cost history move through approval 3x faster
62%
Reduction in Budget Surprises
Facilities using Oxmaint cost alerts report significantly fewer unplanned budget overruns
18 days
Avg Time to First Insight
From Oxmaint adoption to first high-cost asset identified and actioned
Frequently Asked Questions
How does Oxmaint calculate maintenance cost per asset if my team does not log time precisely?
Oxmaint works from whatever data your team captures. If technicians log start and end times on work orders, labour cost is calculated automatically using your configured rates. If they log approximate hours, those are used. Even partial data gives you more asset-level visibility than department-total tracking. Most teams reach 90%+ data completeness within 60 days as the mobile-first interface makes logging faster than paper or email.
Start a free trial and see the cost dashboard populate from your first work orders closed.
What is the right benchmark for maintenance cost as a percentage of asset replacement value?
Industry guidance places healthy maintenance spend between 2–5% of replacement asset value annually for most commercial and industrial equipment. Above 6% warrants a formal review. Above 8–10% typically means the asset costs more to maintain than the savings from deferring replacement. These thresholds vary by asset class — a conveyor system in a high-throughput warehouse has a different profile than a transformer that runs for decades with minimal intervention. Oxmaint lets you configure thresholds per asset class and flags exceptions automatically.
Book a demo to see how benchmarks are configured for your specific asset types.
Can Oxmaint track contractor and third-party maintenance costs against specific assets?
Yes. Oxmaint supports contractor work orders that include external cost fields — service call fees, invoice amounts, and specialist labour rates. These are linked to the same asset record as internal work orders, giving you a unified cost view that includes all spend regardless of who performed the work. Contractor costs can also be entered retrospectively from invoices if they were not captured at the time of service. The result is a single asset cost record that your finance team and maintenance team both trust.
How does asset-level cost tracking support CapEx budget proposals?
When you need to justify a capital replacement, the most persuasive evidence is a documented cost trend showing that the asset is consuming an increasing share of your maintenance budget against declining performance. Oxmaint generates this automatically — a 24 or 36-month cost history per asset, with failure frequency, downtime hours, and current condition score alongside the spend trend. Facilities using Oxmaint CapEx reports consistently describe faster board approval because the data removes the guesswork that causes proposals to be sent back for more information.
Start a free trial and begin building the cost history you will need for your next CapEx cycle.
Oxmaint · Cost Optimization
Your Highest-Cost Assets Are Already in Your Data. Oxmaint Finds Them.
Connect your work orders to Oxmaint and see every asset ranked by maintenance spend, benchmarked against industry norms, and flagged when costs exceed thresholds — automatically, in real time.