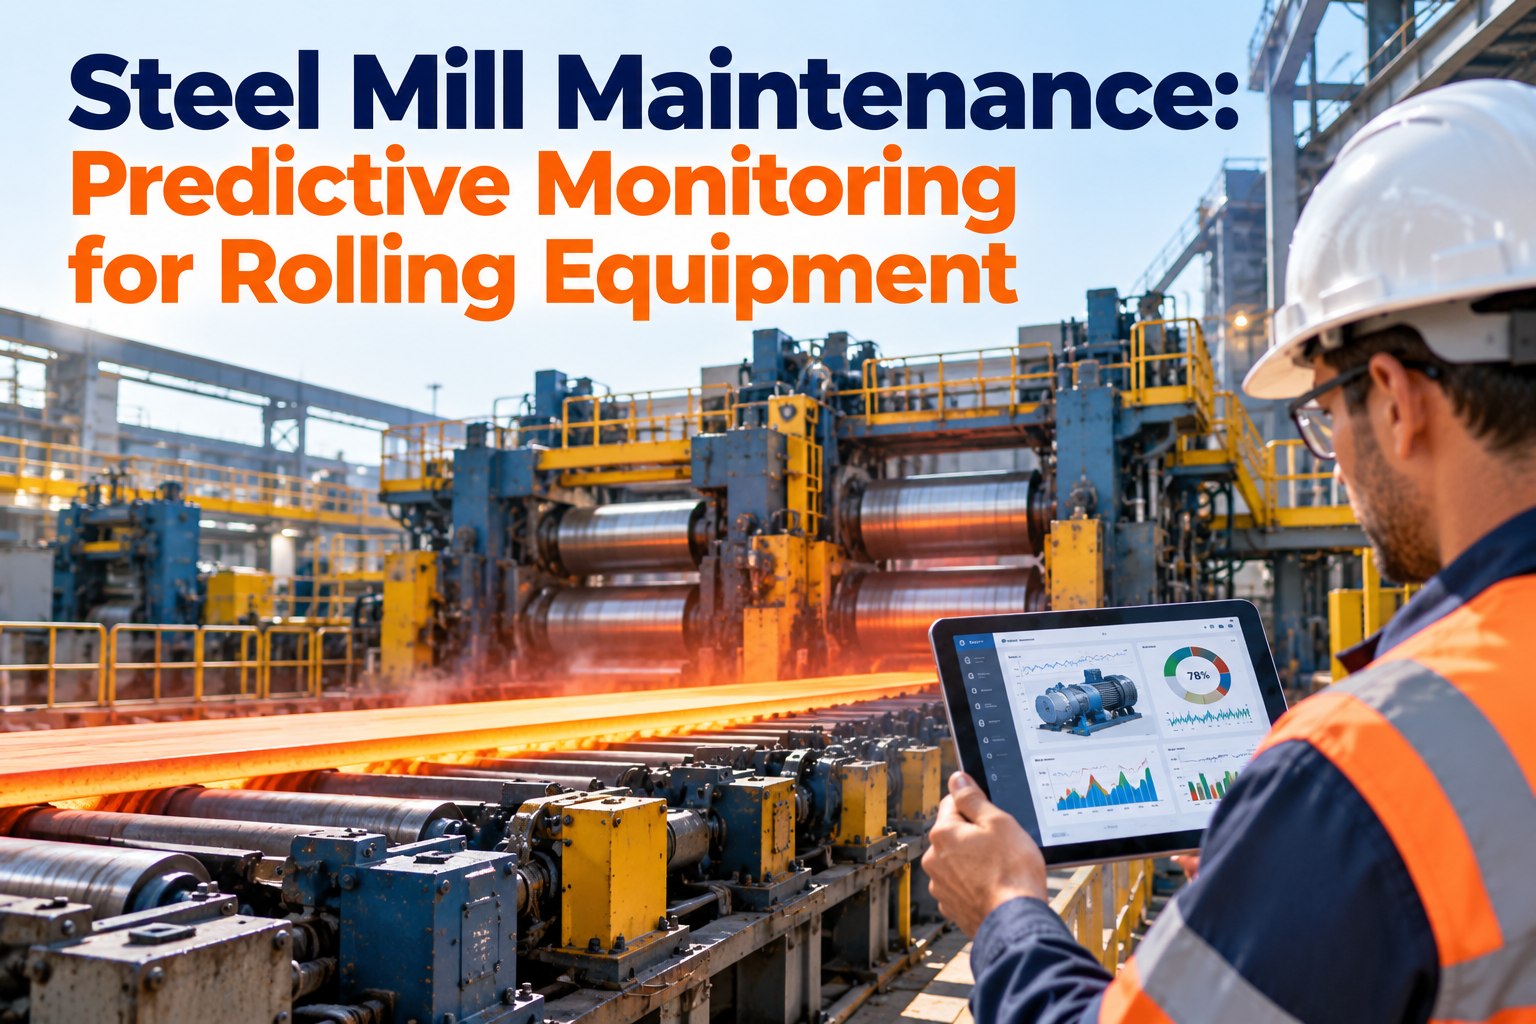
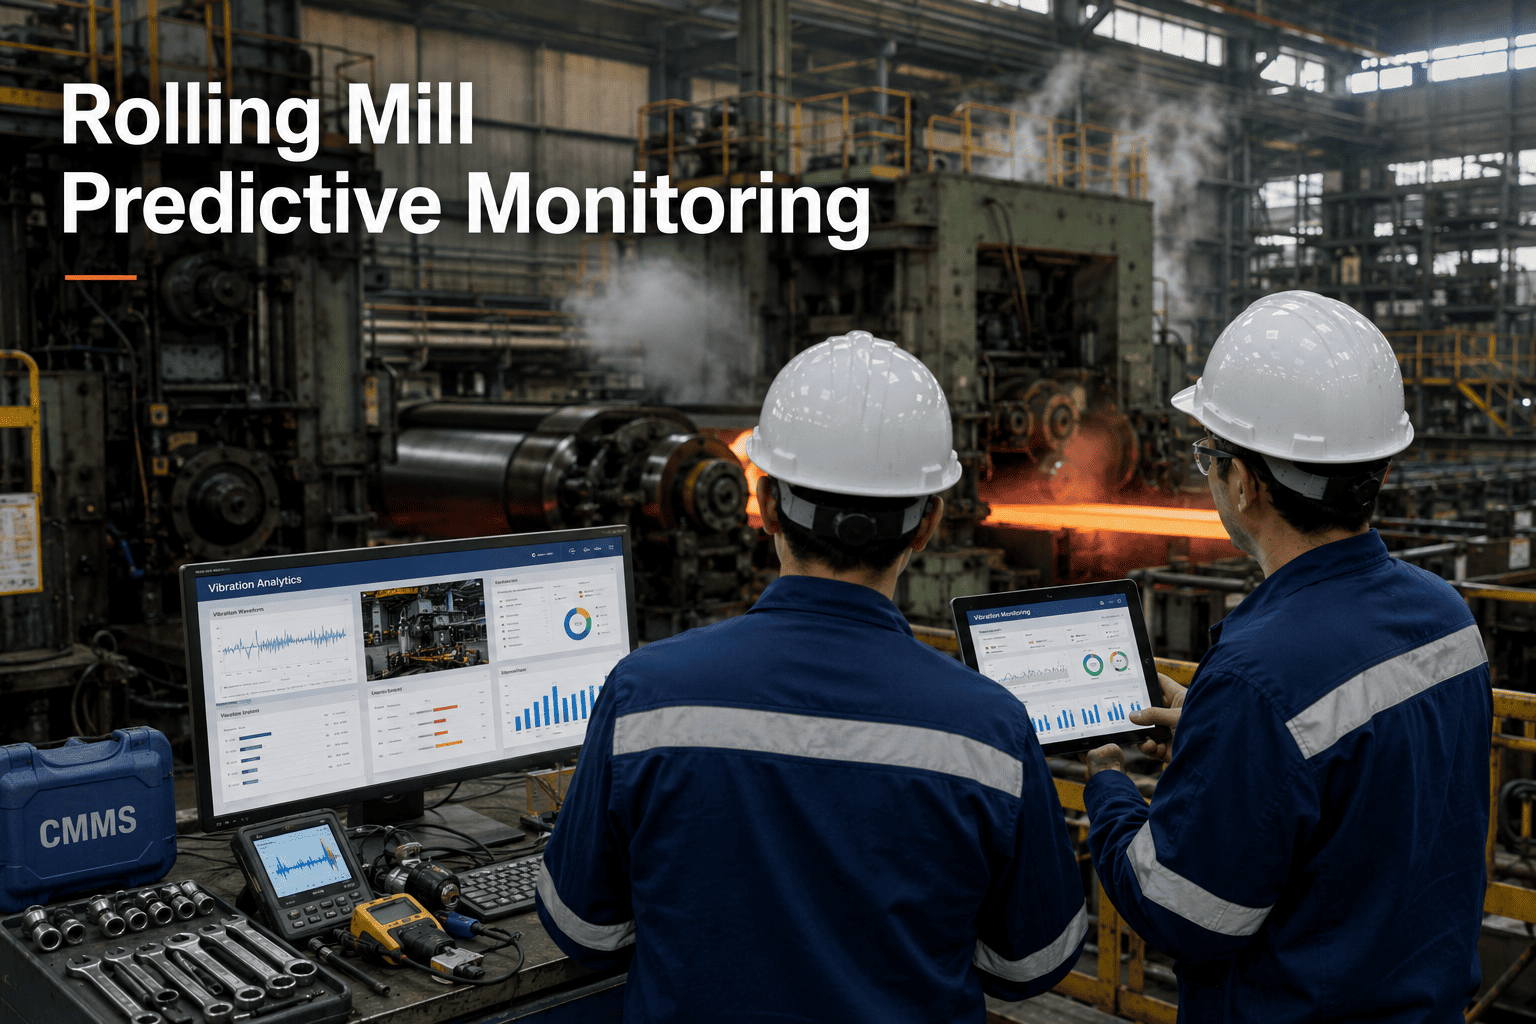
Rolling mill predictive maintenance is the difference between an 18-hour emergency strip that bleeds $8,000-$12,000 per hour in lost hot strip production and a scheduled 45-minute bearing swap during a planned roll change. Bearing failures, gearbox degradation, and hydraulic AGC faults together own 67% of all unplanned rolling mill downtime — and every one of them broadcasts a detectable signal 3-8 weeks before the mill actually stops. This guide breaks down the failure modes that matter, how bearing defect frequencies reveal Stage 2 wear weeks before overall vibration levels move, and how roll force anomaly detection catches hydraulic AGC degradation the HMI compensates around.
Rolling Mill Predictive Maintenance: Bearing Wear & Roll Force Anomalies
A practical 2026 field guide for plant maintenance managers and reliability engineers running hot strip mills, cold rolling mills, and finishing lines — grounded in the failure modes that actually cost tonnes.
The three failure modes that own 67% of rolling mill downtime
A hot strip mill finishing stand runs backup rolls under 2,500-4,000 tonnes of separation force and bearings that operate hotter, faster, and under more variable load than any other bearing in the plant. Calendar-based PM captures roughly 0.003% of that bearing's operating life — the rest of the time the mill is running blind. A single undetected backup roll bearing failure takes the line offline for 12-36 hours at $250K-$1M in combined repair, roll damage, and lost revenue. A condition-monitored CMMS that links vibration, thermal, and hydraulic signal streams to the same work order engine converts this into a scheduled event.
| Failure mode | Share | Warning | Signal source | Cost if missed |
|---|---|---|---|---|
| Work & backup roll bearing failure BPFO, BPFI, BSF, FTF defect frequencies |
32% | 5-7 wks | Triaxial vibration + housing temperature | $250K-$1M |
| Main drive gearbox degradation Gear mesh harmonics, tooth pitting |
21% | 6-12 wks | Vibration FFT + oil particle count | $500K-$3M |
| Hydraulic AGC servo valve degradation Response time drift, position error |
14% | 3-6 wks | AGC response time + oil temperature | $180K-$450K |
| Coupling misalignment & shaft wear | 9% | 4-8 wks | Vibration + laser alignment | $80K-$220K |
BPFO, BPFI, BSF, FTF — the four signals that predict bearing failure
Every rolling element bearing broadcasts its condition through four characteristic frequencies determined by its physical geometry. When a defect develops on any surface, energy concentrates at the corresponding frequency. Envelope demodulation extracts the low-amplitude bearing defect signal from the high-amplitude structural vibration that dominates the overall RMS reading. A bearing at Stage 2 defect severity can show entirely normal overall RMS while its BPFO envelope has grown 400% over six weeks — which is why fixed-threshold alarms fire only 24-48 hours before failure. To see how this maps into a live dashboard, book a mill reliability demo.
Ball Pass Frequency Outer race
Rolling elements passing a fixed defect on the stationary outer race. First to develop under radial load — dominant failure mode on work roll and backup roll bearings.
Ball Pass Frequency Inner race
Rolling elements passing a defect on the rotating inner race. Modulated by shaft speed — appears as sidebands in the envelope spectrum. Common on drive-end bearings.
Ball Spin Frequency
Frequency at which a rolling element with a surface defect rotates against the races. Indicates spalling or fatigue damage on the ball or roller itself.
Fundamental Train Frequency
Cage rotation frequency. Rare as a primary indicator — its presence signals late-stage cage damage. FTF sidebands around BPFO demand immediate scheduling for a bearing change.
Roll force patterns that reveal what the AGC is hiding
The Automatic Gauge Control system is designed to compensate for mechanical drift — that is exactly why it hides degradation. When a hydraulic AGC servo valve begins to degrade, the AGC compensates by increasing correction amplitude. Strip gauge stays within tolerance. The HMI shows nothing. But roll force transducers, hydraulic pressure telemetry, and cylinder position sensors are recording the effort required to maintain that compensation. Reliability engineers who monitor roll force and AGC response time together see the degradation signature 3-6 weeks before servo valve failure causes a cobble event. This is the case for correlating roll force with vibration and hydraulics in a single time-series engine rather than running each stream separately.
Roll force & hydraulic anomaly signatures
| Anomaly pattern | What it indicates | Warning |
|---|---|---|
| Roll force asymmetry rising between drive-end and operator-side transducers under constant strip width | Bearing wear on one chock, roll bending drift, or thermal camber imbalance | 3-5 wks |
| AGC servo valve response time drift — cylinder correction takes longer to reach setpoint | Servo valve spool stiction, contamination, or seal wear compensated invisibly by AGC gain | 3-4 wks |
| Hydraulic oil temperature rising 5-12°C above baseline at constant production load | Servo valve leaking internally, working harder to hold cylinder position | 2-4 wks |
| Widening delta between motor torque and calculated roll force under matched schedule | Increasing driveline friction — often precedes BPFO emergence by 3-4 weeks | 6-8 wks |
Rolling mill predictive maintenance FAQ
How much advance warning does BPFO frequency monitoring actually give on a rolling mill bearing?
Documented across integrated hot strip mill deployments, the BPFO envelope signal typically emerges 5-7 weeks before functional bearing failure. Bearings under high radial load (backup roll bearings on finishing stands) show faster progression, giving 3-5 weeks of usable warning. Bearings under lighter load can give 6-9 weeks. The key variable is not detection sensitivity — modern envelope demodulation catches BPFO amplitude changes of 20-30% above baseline — it is baseline quality. A campaign-specific baseline that accounts for rolling speed, strip width, and reduction gives clean detection.
Do we need to replace our existing PLC and SCADA systems to run predictive maintenance?
No. Modern predictive maintenance platforms run alongside existing mill automation — L1 PLCs, L2 supervisory, and L3 MES stay in place. The predictive layer taps historian data (roll force, motor current, hydraulic pressure, cylinder position) via OPC UA or MQTT, and adds dedicated vibration and thermal sensors where coverage is missing. The CMMS integration is the one active connection — condition detections generate work orders in the same system the maintenance team already uses.
What is the difference between overall vibration RMS and bearing defect frequency monitoring?
Overall RMS is the total energy in the vibration signal across a broad frequency range. It only rises meaningfully in the final 1-2 weeks before bearing failure. Bearing defect frequency monitoring uses envelope demodulation to isolate specific low-amplitude signals at BPFO, BPFI, BSF, and FTF frequencies. These appear 5-7 weeks before failure and are invisible on the overall RMS trend. A rolling mill bearing at Stage 2 defect severity can have overall RMS well below ISO 10816 alarm while its BPFO envelope has grown 400% over six weeks.
Can roll force asymmetry actually predict bearing wear before the vibration signature appears?
Yes. Roll force asymmetry between the drive-end and operator-side transducers under constant strip width and reduction is one of the earliest whole-stand health indicators available, catching drift 3-5 weeks before BPFO amplitude emerges on the same bearing. What it detects is the loss of geometric symmetry as bearing wear, roll bending drift, or thermal camber imbalance shifts the load distribution across the roll body. Combined with the widening delta between motor torque and calculated roll force, roll force analytics catches degradation weeks earlier than vibration alone.
How do we handle the false positive problem that kills most predictive maintenance pilots?
Three disciplines separate mature programmes from failed pilots. First, baseline before alerting — the analytics platform runs in silent mode for 4-6 weeks collecting data across rolling campaigns before any alerts are enabled. Second, multi-signal confirmation — a single anomalous signal triggers monitoring, not a work order; two independent signals crossing threshold on the same asset triggers action. Third, human-in-the-loop for the first 30 days after alert activation. Programmes that skip this discipline typically generate 40-60% false positive rates in month one and lose credibility before month three.
What is the realistic ROI timeline for a full rolling mill predictive maintenance rollout?
The typical payback envelope is 12-18 months for a full mill rollout, with the first measurable benefits inside 6 months of alert activation. The primary drivers are avoided catastrophic failures — a single prevented backup roll bearing failure at $250K-$1M covers a significant portion of the initial investment. Sustained benefits compound after month 6 as maintenance cost per tonne shifts from the $4.80/t reactive baseline toward $1.90/t. To scope a rollout for your mill, start with a free Oxmaint trial.
Stop losing rolling campaigns to signals you already had
Oxmaint connects continuous vibration, thermal, hydraulic AGC, and roll force analytics to your CMMS work order engine — so the 5-7 week window between a Stage 2 BPFO signal and a functional bearing failure becomes a scheduled bearing swap during a planned roll change. Not an 18-hour emergency strip at $8K-$12K per hour in lost production.