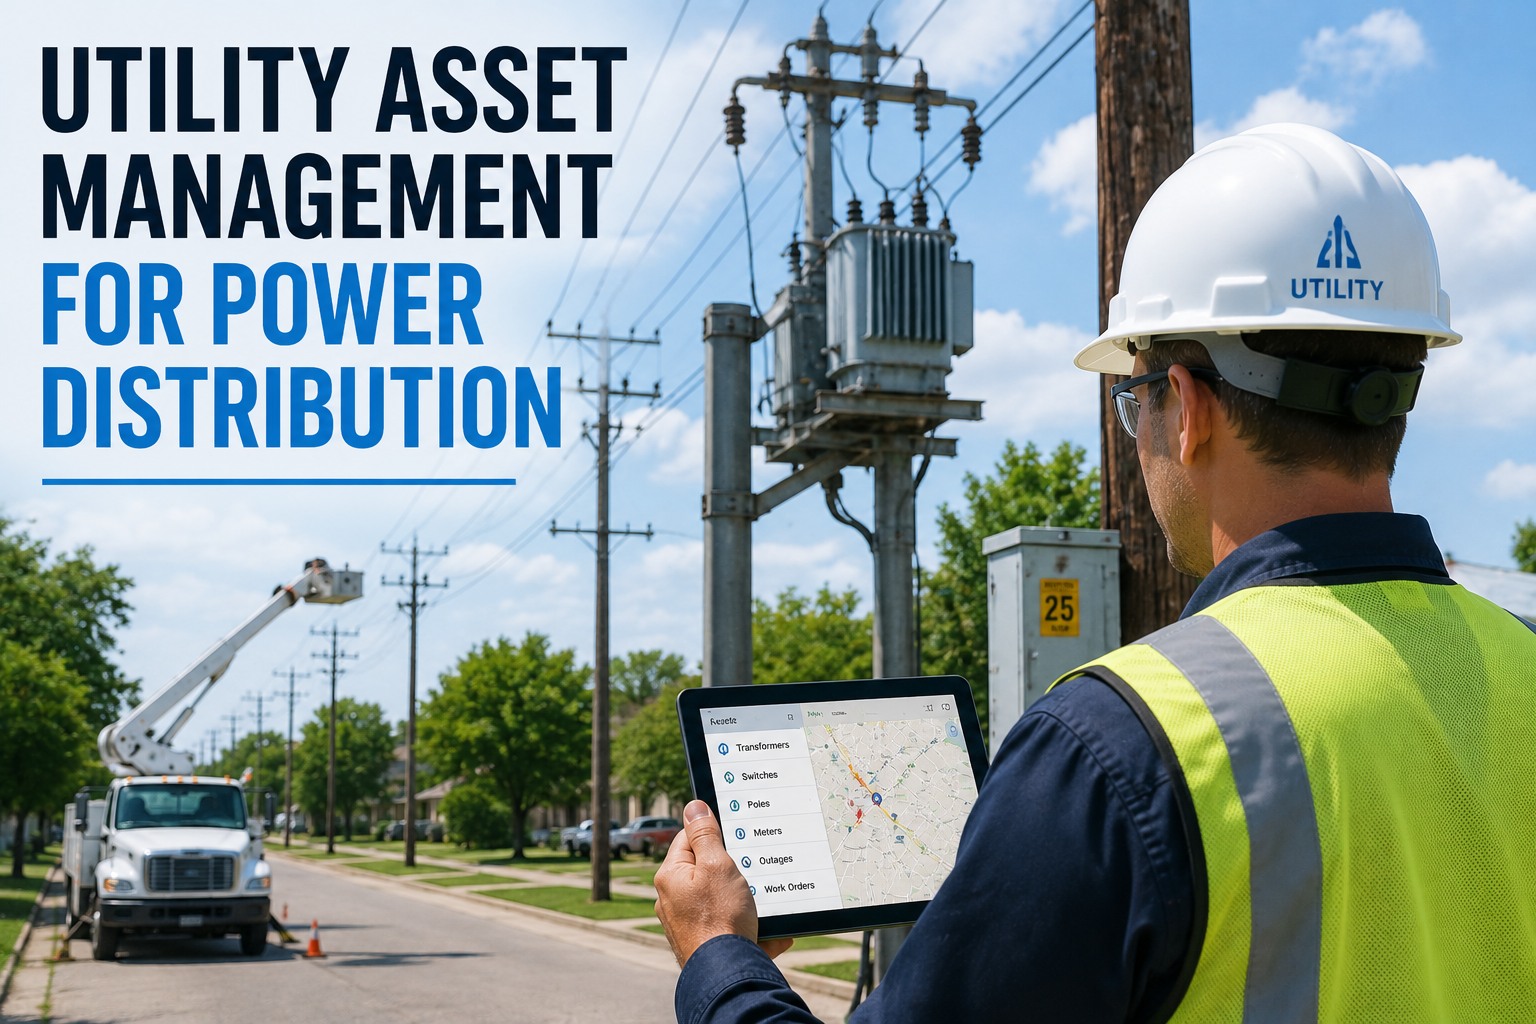
Power distribution networks are sprawling, heterogeneous systems where every wooden pole, pad-mount transformer, recloser, and meter socket ages on its own curve. A distribution utility maintaining 120,000 poles and 8,000 miles of overhead conductor cannot afford a reactive maintenance posture — weather events, vegetation encroachment, and component fatigue compound into outages that directly move SAIDI and SAIFI numbers. OxMaint gives distribution asset managers a structured CMMS for building a complete asset registry, scheduling condition-based inspections, and converting field observations into prioritized work orders. The result is a defensible, audit-ready maintenance program aligned with ISO 55000 principles — one that turns scattered asset data into measurable reliability gains. Start Free Trial to see your distribution network the way regulators and rate cases expect you to.
Every pole, line, and switchgear has a failure curve. Is yours being tracked?
Distribution utilities lose an average of 18–24 minutes of SAIDI per year to preventable equipment failures — degraded insulators, corroded connectors, and overloaded transformers that inspections should have caught months earlier. OxMaint turns your asset registry into a living reliability system.
The distribution asset registry — foundation of every reliability gain
ISO 55000-aligned asset management starts with a single, deduplicated record for every component on the network. Without it, inspection scheduling is guesswork and capital planning drifts toward replacement-by-crisis.
Asset registry design
Build a hierarchical registry — feeder → lateral → pole → component — capturing manufacturer, install date, voltage class, GPS coordinates, and criticality. Supports NERC, PRC-005, and state reliability reporting out of the box.
Inspection scheduling
Drive patrols, infrared surveys, and climb inspections on intervals tuned to asset class and criticality. Pole inspections every 4–8 years, recloser function tests annually, substation IR sweeps every 6 months.
Condition tracking
Record field observations as structured health scores (0–100) per asset. Declining trends on a wood pole cross-arm or oil-filled transformer automatically trigger work order generation under configurable thresholds.
CMMS for SAIDI / SAIFI
Every outage event links to the responsible asset. Repeat-failure analysis, MTBF trending, and worst-performing circuit reports feed directly into capital prioritization and reliability improvement plans.
What condition-based maintenance is worth on a distribution network
A mid-sized distribution utility (≈120K customers, 14 substations, 3,800 miles of line) typically spends $3.6M annually on O&M. Shifting 30% of corrective spend into condition-based prevention recovers measurable reliability minutes.
Preventable failures (degraded connectors, overloaded transformers, rotted poles) contribute an estimated 12–18% of annual CMI. Targeted inspections and timely replacement directly reduce the numerator.
Each sustained outage prevented removes one event from the numerator. A feeder averaging 4.2 faults per year, reduced to 3.1 through vegetation and asset intervention, cuts SAIFI by 0.9 on that circuit.
| Asset Class | Annual Failure Rate | Avg. Outage Duration | Customers Affected | CMI / Year | Recoverable via CBM |
|---|---|---|---|---|---|
| Overhead transformers (pole-mount) | 0.8% | 2.4 hrs | ~45 | 6,480 | ~35% |
| Reclosers & sectionalizers | 1.2% | 1.8 hrs | ~280 | 6,048 | ~40% |
| Wood poles (structural failure) | 0.3% | 5.5 hrs | ~120 | 7,128 | ~55% |
| Underground cable (URD) | 2.1% | 6.2 hrs | ~60 | 4,651 | ~25% |
| Switchgear (pad-mount) | 0.6% | 3.1 hrs | ~90 | 3,353 | ~45% |
| Network total (per 1,000 assets) | — | — | — | 27,660 | ~38% |
A 1,000-asset segment with 27,660 annual customer-minutes of interruption can recover roughly 10,510 CMI — about 4.4 minutes of SAIDI per customer — by migrating from time-based to condition-based maintenance.
From registry to reliability: a 5-phase rollout
Most distribution utilities can stand up a functioning OxMaint CMMS for their overhead network within 60–90 days. The underground and substation tiers follow in months three through five.
Asset registry migration
Import GIS data, pole inventories, and transformer records. Deduplicate against existing spreadsheets. Establish GPS coordinates, voltage class, and criticality tier for every overhead asset.
Inspection program configuration
Configure patrol routes, IR survey schedules, and climb-inspection cycles per NESC and state PUC rules. Build condition score templates for poles, insulators, transformers, and switchgear.
Field crew onboarding
Deploy the mobile inspection app to linemen and contractors. Capture photos, defect codes, and severity ratings at the pole. Offline-first sync for rural service territories with no cellular coverage.
Work order automation
Activate threshold-based work order generation. A pole scoring below 40 on structural integrity auto-creates a replacement WO routed to the nearest crew with materials list and estimated hours.
Reliability analytics & reporting
Generate SAIDI/SAIFI contribution reports by feeder, asset class, and failure mode. Feed worst-performing circuit lists into the annual capital plan with defensible, data-backed justification.
Your distribution grid has thousands of assets. How many do you actually see?
OxMaint gives every pole, transformer, and switchgear a living record — inspection history, condition score, and failure forecast in one place. Deploy in weeks, not quarters.
A 180-asset substation territory, before and after
Consider a distribution utility operating 14 substations with 180 major assets each (transformers, breakers, reclosers, regulators). At $42K annual maintenance spend per substation, even a 20% reduction in unplanned failures returns measurable SAIDI recovery.
- — Paper inspection sheets, 30% never digitized
- — Average 11 unplanned outages per substation per year
- — 142 minutes of SAIDI contributed by preventable failures
- — $42K annual O&M, 60% reactive
- — No condition scores; replacement decisions by age only
- → 100% digital inspections with photo evidence
- → Average 6.4 unplanned outages per substation per year
- → SAIDI contribution reduced to 78 minutes (−45%)
- → $34K annual O&M, 35% reactive
- → Health scores (0–100) on every asset, forecasted 18 months out
We went from paper patrol sheets to a digital condition register in eleven weeks. The first IR survey alone flagged 23 connectors we would have missed — three of them on a feeder that feeds a hospital. That alone justified the platform.
Distribution asset management, answered
How does OxMaint handle assets spread across a large geographic service area?
The mobile inspection app works offline-first — linemen and contractors capture pole-level observations, photos, and defect codes in the field with no cellular signal, then sync automatically when connectivity returns. GPS coordinates anchor every asset record, so dispatchers can route crews to the highest-priority defects by proximity. You can Start Free Trial to test offline capture on your own territory.
Can the CMMS support both overhead and underground distribution assets?
Yes. Asset classes include pole-mount and pad-mount transformers, overhead and underground conductors, reclosers, sectionalizers, voltage regulators, capacitor banks, switchgear, and metering. Each class has its own inspection template, condition scoring model, and failure-mode library, so overhead wood-pole inspections and URD cable testing live in one unified registry.
How does the platform calculate SAIDI and SAIFI contribution by asset?
Every outage event in the system links to the asset or assets responsible. OxMaint aggregates customer-minutes interrupted and customer interruption counts per asset, per feeder, and per substation over any reporting period. This produces a ranked worst-performing asset list that feeds directly into your capital prioritization process and regulatory reliability filings.
What inspection intervals does OxMaint support for distribution equipment?
Intervals are fully configurable per asset class and criticality tier. Common defaults include pole inspections every 4–8 years per NESC, recloser function tests annually, substation infrared surveys every 6 months, transformer oil sampling on 3-year cycles, and switchgear thermography annually. Custom intervals can be set per state PUC requirements or individual utility standards.
How long does it take to deploy OxMaint across a distribution network?
A typical overhead-only deployment takes 60–90 days: registry migration in month one, inspection configuration in month two, and field crew onboarding in month three. Underground and substation tiers roll out in months four and five. Most utilities see their first measurable SAIDI recovery within 12 months of full deployment. Book a Demo to scope a timeline for your service territory.
Turn your distribution asset data into reliability you can defend
Build a complete registry, schedule condition-based inspections, and let every pole, transformer, and switchgear carry its own health record. OxMaint makes it happen in weeks.
Free 14-day trial · No credit card