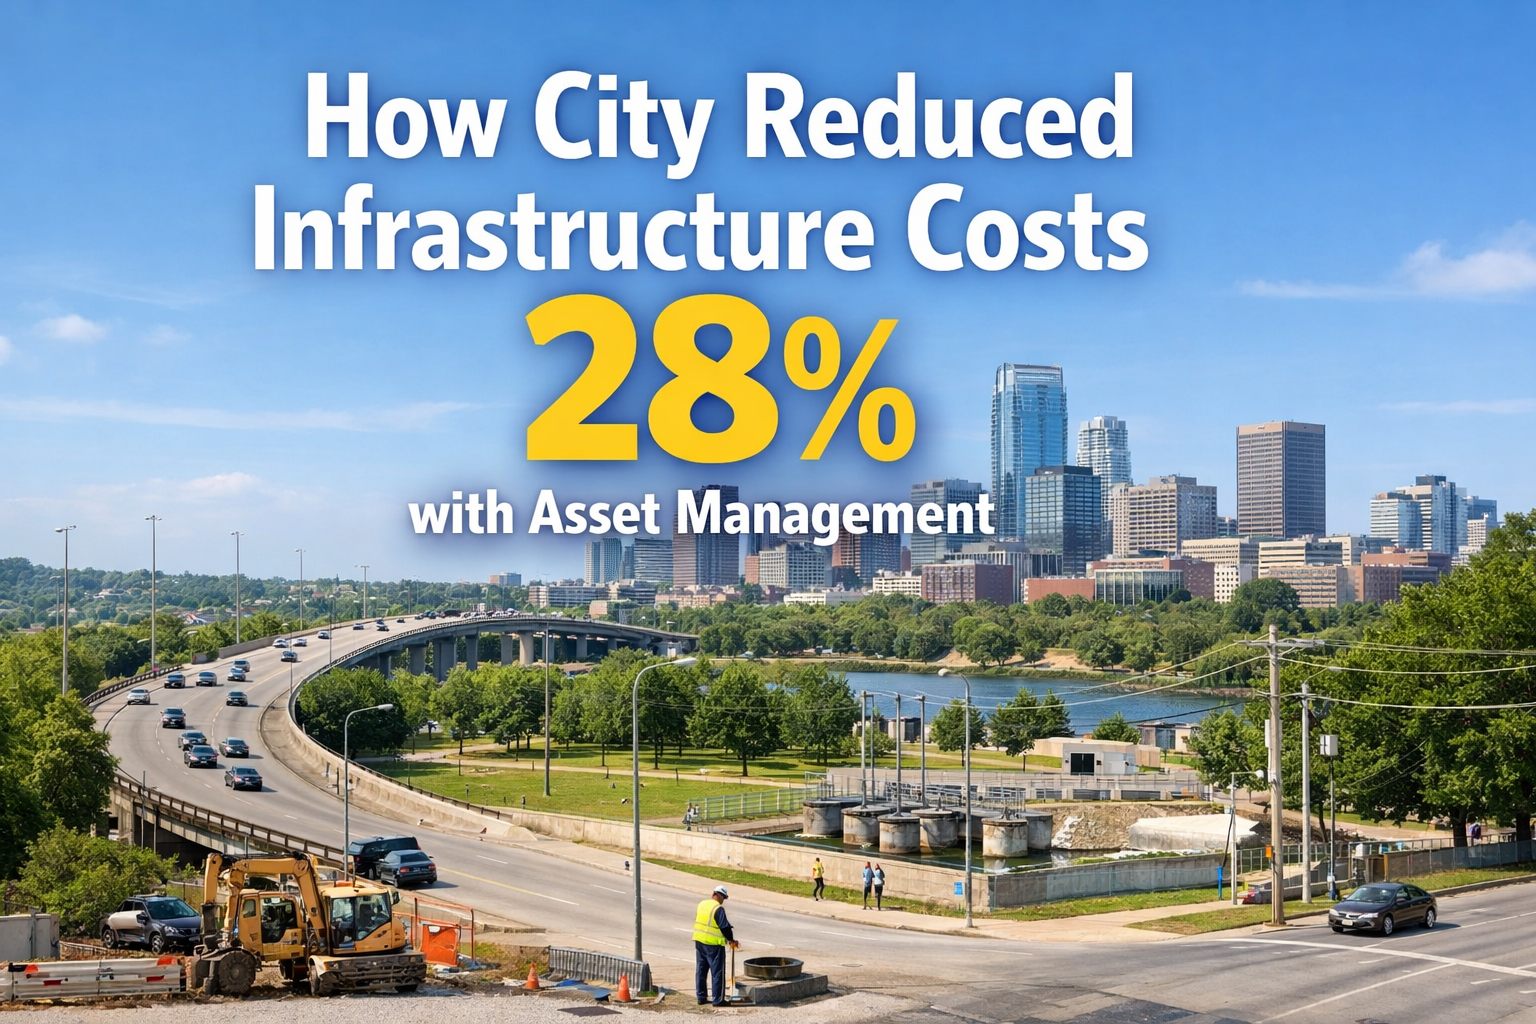
A mid-sized city of 185,000 residents was spending $14.2M annually on infrastructure maintenance with 73% going to emergency repairs. After implementing modern asset management, they cut costs by 28% in just 18 months. Here's exactly how they did it.
Municipal infrastructure—roads, bridges, water systems, public buildings—deteriorates predictably. Yet most cities still operate reactively, fixing things only after they break. This case study shows what happens when a city shifts from reactive to preventive asset management.
How a City Reduced Infrastructure Costs 28% with Asset Management
From Reactive Repairs to Predictive Maintenance: A Municipal Transformation Story
The Challenge: A City Drowning in Reactive Maintenance
Spiraling Emergency Repair Costs
The Situation
The city managed 12,000+ infrastructure assets across roads, bridges, water/sewer systems, parks, and 47 public buildings. With no centralized asset management system, maintenance teams relied on spreadsheets, paper work orders, and phone calls. Over 73% of all maintenance was reactive—responding to failures after they occurred.
Financial Impact
- Emergency repairs cost 3-5x more than planned preventive maintenance
- $14.2M annual maintenance budget with costs rising 8-12% yearly
- No visibility into asset condition, remaining useful life, or failure trends
- Citizen complaints about road conditions, water outages, and facility closures up 45%
The Solution: Modern Cloud-Based Asset Management
Implementation Strategy & Timeline
Phased Rollout Timeline
See How Asset Management Can Work for Your Municipality
Get a personalized walkthrough showing how modern CMMS reduces infrastructure costs, improves response times, and extends asset life—tailored to your city's needs.
The Results: 28% Cost Reduction Breakdown
Measurable Savings Across Every Department
Annual Savings Breakdown
Before vs. After: Key Metrics
Performance Comparison
5 Strategies That Drove the 28% Reduction
Replicable Tactics for Any Municipality
What Made the Difference
Is This Achievable for Your City
High-Impact Candidates:
Cities spending more than half their budget on emergency repairs see the fastest ROI
Still using spreadsheets, paper, or disconnected systems across departments
Rising service requests for road conditions, facility issues, or utility outages
Getting Started Is Simple:
Focus on water systems, bridges, and high-traffic roads first for maximum impact
Get field crews on mobile apps within weeks—not months of training
Track emergency vs. planned ratio, response times, and cost per work order immediately
Start Your Free Trial — No Credit Card Required
See how OxMaint helps municipalities digitize assets, automate preventive maintenance, and reduce infrastructure costs. Get started in minutes, not months.
Want a customized infrastructure savings analysis Chat with our municipal solutions team — We'll estimate your potential savings based on your city's size and current spending.
Key Takeaways: City Infrastructure Cost Reduction
- 28% cost reduction achieved in 18 months by shifting from reactive to preventive maintenance
- $3.9M annual savings across emergency repairs, labor efficiency, asset lifespan, and inventory
- 62% fewer emergency repairs through condition monitoring and automated PM scheduling
- 92% field adoption with mobile-first CMMS vs. months of training with legacy systems
- 78% citizen satisfaction up from 34% with faster response times and fewer service disruptions
- Quick wins matter: Digitizing work orders alone delivered 12% savings in 4 months
Ready to Reduce Your City's Infrastructure Costs
Schedule a free consultation to see how modern asset management can cut your maintenance budget by 20-30%. We'll analyze your current spending and show you a realistic savings roadmap.