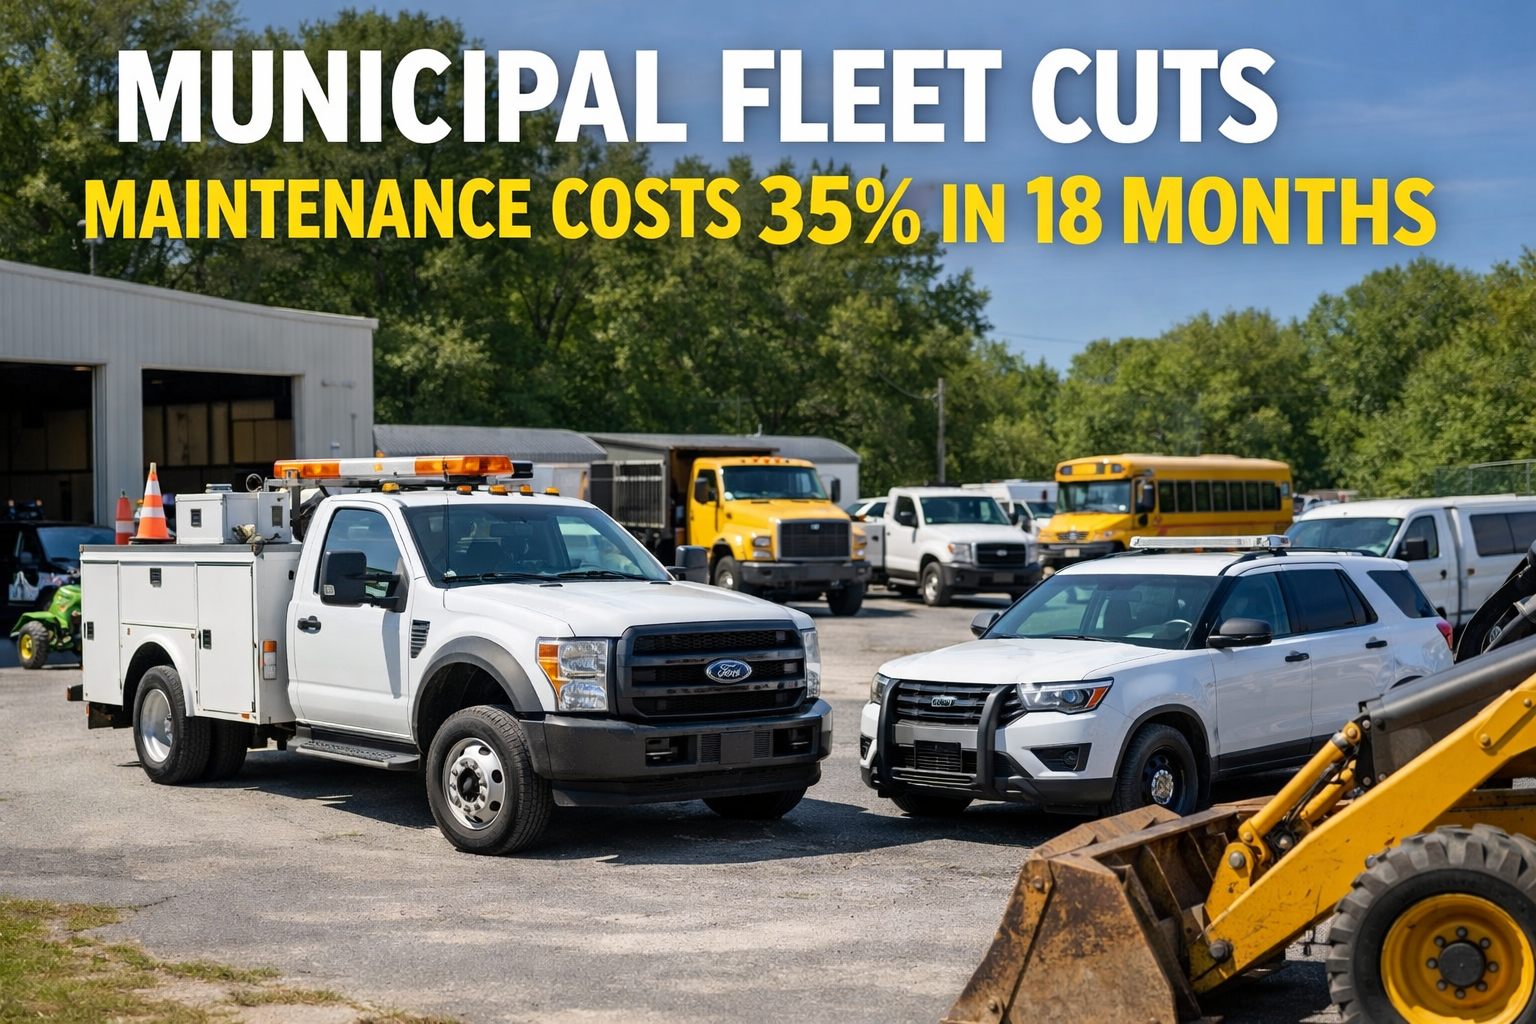
A mid-sized city managing a 280-vehicle municipal fleet—police cruisers, fire apparatus, public works trucks, transit buses, and administrative vehicles—was spending $3.4M annually on maintenance with 73% of all work being reactive emergency repairs. After deploying a cloud-based CMMS platform across all departments, the fleet cut total maintenance costs by 35% in 18 months while improving vehicle availability to 94%. Here's the playbook.
Municipal fleets are uniquely challenging: they operate diverse vehicle types across multiple departments, each with different missions, usage patterns, and compliance requirements. When maintenance is reactive, costs spiral—and taxpayers pay the price. This case study shows how one city transformed fleet operations from a budget liability into a model of public-sector efficiency. City fleet managers facing similar challenges can schedule a free demo to see this approach in action.
Ready to Cut Your Municipal Fleet Maintenance Costs?
Schedule a consultation to see how OxMaint helps government fleets automate preventive maintenance, reduce breakdowns, and save taxpayer dollars. No sales pressure—just honest assessment.
The Problem: $3.4M in Reactive Maintenance and Rising
The city's fleet division managed 280 vehicles across 5 departments—Police, Fire, Public Works, Transit, and Administration. Each department tracked maintenance differently: Public Works used spreadsheets, Police relied on a legacy desktop system, and Fire kept paper logs. The central fleet garage had no visibility into which vehicles were overdue for service until something broke.
Critical Maintenance Failures Before Transformation
- 73% Reactive Maintenance: Nearly three-quarters of all work orders were unplanned emergency repairs—the most expensive type of maintenance
- No Centralized Fleet View: 5 departments using 4 different tracking methods with zero cross-department visibility
- PM Compliance at 41%: Fewer than half of scheduled preventive maintenance services were completed on time
- 28 Missed Service Routes Per Quarter: Vehicle breakdowns caused public works and transit route failures affecting residents
- Spare Parts Overstocking: $380K in excess inventory because each garage ordered independently with no shared parts catalog
- Technician Inefficiency: Mechanics spent 2.1 hours per day on paperwork, parts searching, and work order processing instead of turning wrenches
Pre-Implementation Cost Breakdown
- Total Annual Maintenance Spend: $3.4M across all 5 departments
- Emergency Repair Costs: $2.48M (73% of total—reactive work costs 3-5x more than planned)
- Vehicle Availability Rate: 81% (target: 95%)
- Average Repair Turnaround: 4.7 days per vehicle
- PM Compliance Rate: 41% fleet-wide
- Missed Public Service Routes: 28 per quarter due to vehicle breakdowns
- Annual Vehicle Replacement Costs: $1.8M (premature replacements from deferred maintenance)
The Solution: One CMMS Platform Across All Departments
City leadership approved a unified cloud CMMS deployment connecting all 5 departments, 3 maintenance garages, and 280 vehicles into a single platform. The goal was simple: shift from reactive to preventive, standardize processes, and give fleet managers real-time visibility into every vehicle's status.
Key Technology Components Deployed
Unified Asset Management
All 280 vehicles loaded with complete profiles—make, model, mileage, service history, warranty status, and department assignment. Every asset visible from one dashboard regardless of department.
Automated PM Scheduling
Preventive maintenance schedules built from OEM specifications and tailored to each vehicle type's duty cycle. Police cruisers on high-mileage intervals, fire apparatus on engine-hour triggers, public works trucks on combined mileage-and-calendar schedules.
Mobile Work Orders for Technicians
Mechanics received and completed work orders on tablets—logging time, parts, photos, and notes digitally. Eliminated 2+ hours of daily paperwork and created instant maintenance history records.
Cross-Department Parts Inventory
Shared parts catalog across all 3 garages with real-time stock levels, automatic reorder points, and cross-garage transfer capability. No more duplicate ordering or emergency parts runs.
Implementation Timeline: 18 Months to 35% Cost Reduction
Phase 1: Foundation (Months 1-4)
- Complete fleet audit—280 vehicles cataloged with full service histories digitized
- Cloud CMMS deployed at central garage; Police and Public Works departments onboarded first
- Eliminated backlog of 89 overdue PM services within first 60 days
- Mobile tablets deployed to 22 fleet technicians across 3 garages
Phase 2: Full Rollout (Months 5-10)
- Fire, Transit, and Administration departments onboarded to unified platform
- Automated PM scheduling activated for all 280 vehicles with department-specific intervals
- Shared parts inventory system live across all 3 garages
- Real-time fleet dashboards deployed for department heads and city manager
Phase 3: Optimization (Months 11-18)
- Preventive-to-reactive ratio flipped from 27:73 to 71:29
- Vehicle replacement schedules extended based on improved maintenance data
- Quarterly fleet performance reports automated for city council budget reviews
- Technician productivity KPIs integrated into performance management
The Results: 35% Cost Reduction in 18 Months
Breakthrough Fleet Performance Outcomes
- 35% Maintenance Cost Reduction: Annual spend dropped from $3.4M to $2.21M—saving $1.19M per year
- 92% PM Compliance: Up from 41%—more than doubling preventive maintenance completion rates
- 47% Fewer Breakdowns: Unplanned emergency repairs cut nearly in half across the fleet
- 94% Vehicle Availability: Up from 81%—approaching the 95% gold standard for municipal fleets
- Zero Missed Service Routes: Down from 28 per quarter—no resident-facing service disruptions
- 1.4-Day Average Repair Turnaround: Down from 4.7 days—vehicles back in service 70% faster
Detailed Performance Comparison
| Fleet Metric | Before CMMS | After 18 Months | Improvement |
|---|---|---|---|
| Annual Maintenance Cost | $3.4M | $2.21M | 35% reduction |
| PM Compliance Rate | 41% | 92% | 124% improvement |
| Reactive vs. Preventive Ratio | 73:27 | 29:71 | Fully inverted |
| Vehicle Availability | 81% | 94% | 16% improvement |
| Missed Service Routes/Quarter | 28 | 0 | 100% elimination |
| Avg. Repair Turnaround | 4.7 days | 1.4 days | 70% faster |
| Spare Parts Excess Inventory | $380K | $95K | 75% reduction |
Financial Impact Breakdown
- $1.19M Annual Maintenance Savings: Direct reduction in repair costs, emergency parts, and overtime labor
- $285K Spare Parts Optimization: Cross-garage inventory sharing eliminated duplicate stock and emergency purchasing
- $420K Deferred Vehicle Replacements: Better-maintained vehicles lasted 2-3 years longer, delaying capital expenditures
- $165K Technician Productivity Gain: Digital work orders recovered 2+ hours per mechanic per day
- Total 18-Month Financial Benefit: $3.09M in savings and deferred costs against $128K implementation investment
Ready to Reduce Your Fleet Maintenance Costs?
See how OxMaint helps municipal and government fleets automate PM scheduling, unify departments, and cut costs. Start your free trial today—no credit card required.
4 Strategies That Drove 35% Cost Savings
Strategy 1: Flip the Reactive-to-Preventive Ratio
The single biggest cost driver was emergency repairs. By automating PM schedules and enforcing compliance with escalation alerts, the fleet inverted from 73% reactive to 71% preventive—where planned maintenance costs 3-5x less than emergency breakdowns.
Strategy 2: Unify All Departments on One Platform
Eliminating 4 disconnected tracking systems gave fleet managers cross-department visibility for the first time. This exposed duplicate parts inventory, inconsistent service intervals, and vehicles falling through the cracks between departments.
Strategy 3: Put Mobile Tools in Technicians' Hands
Tablets replaced clipboards. Mechanics logged work in real time—capturing labor hours, parts used, and photos of completed repairs. This recovered 2+ hours per technician per day and created audit-ready maintenance records automatically.
Strategy 4: Use Data to Extend Vehicle Life
With complete digital maintenance histories, the fleet division made data-driven replacement decisions instead of relying on age-based rules. Vehicles with strong maintenance records were kept 2-3 years longer, deferring $420K in capital replacement costs—start your free trial to build this kind of fleet intelligence.
Lessons Learned for Municipal Fleet Managers
What Worked and What to Watch For
- Start With the Worst Department: Onboarding the department with the highest reactive rate first generated the most dramatic early wins and built internal support
- Technician Buy-In Is Everything: Mechanics who saw mobile tools reduce their paperwork became the strongest advocates for the new system
- Council Needs Dashboards: Automated quarterly reports showing cost trends and vehicle availability gave elected officials confidence in the investment
- Parts Consolidation Pays Immediately: Cross-garage inventory visibility eliminated $285K in excess stock within the first year
- PM Compliance Drives Everything: Once PM compliance crossed 80%, breakdown rates dropped sharply—the compounding effect accelerated savings in months 12-18
- Implementation Cost: $128K total (platform, tablets, training, data migration)
- Time to Break Even: Month 6 after go-live
- 18-Month ROI: 2,314% ($3.09M benefit vs. $128K investment)
- Ongoing Annual Cost: $38K (platform licensing + support)
- Staff Impact: Zero layoffs—technicians redeployed from paperwork to preventive maintenance work
Your Fleet's Cost Reduction Starts Here
Schedule a free fleet assessment to identify your biggest maintenance cost drivers and see how OxMaint automates PM scheduling, unifies departments, and delivers measurable savings. No sales pressure—just honest assessment.