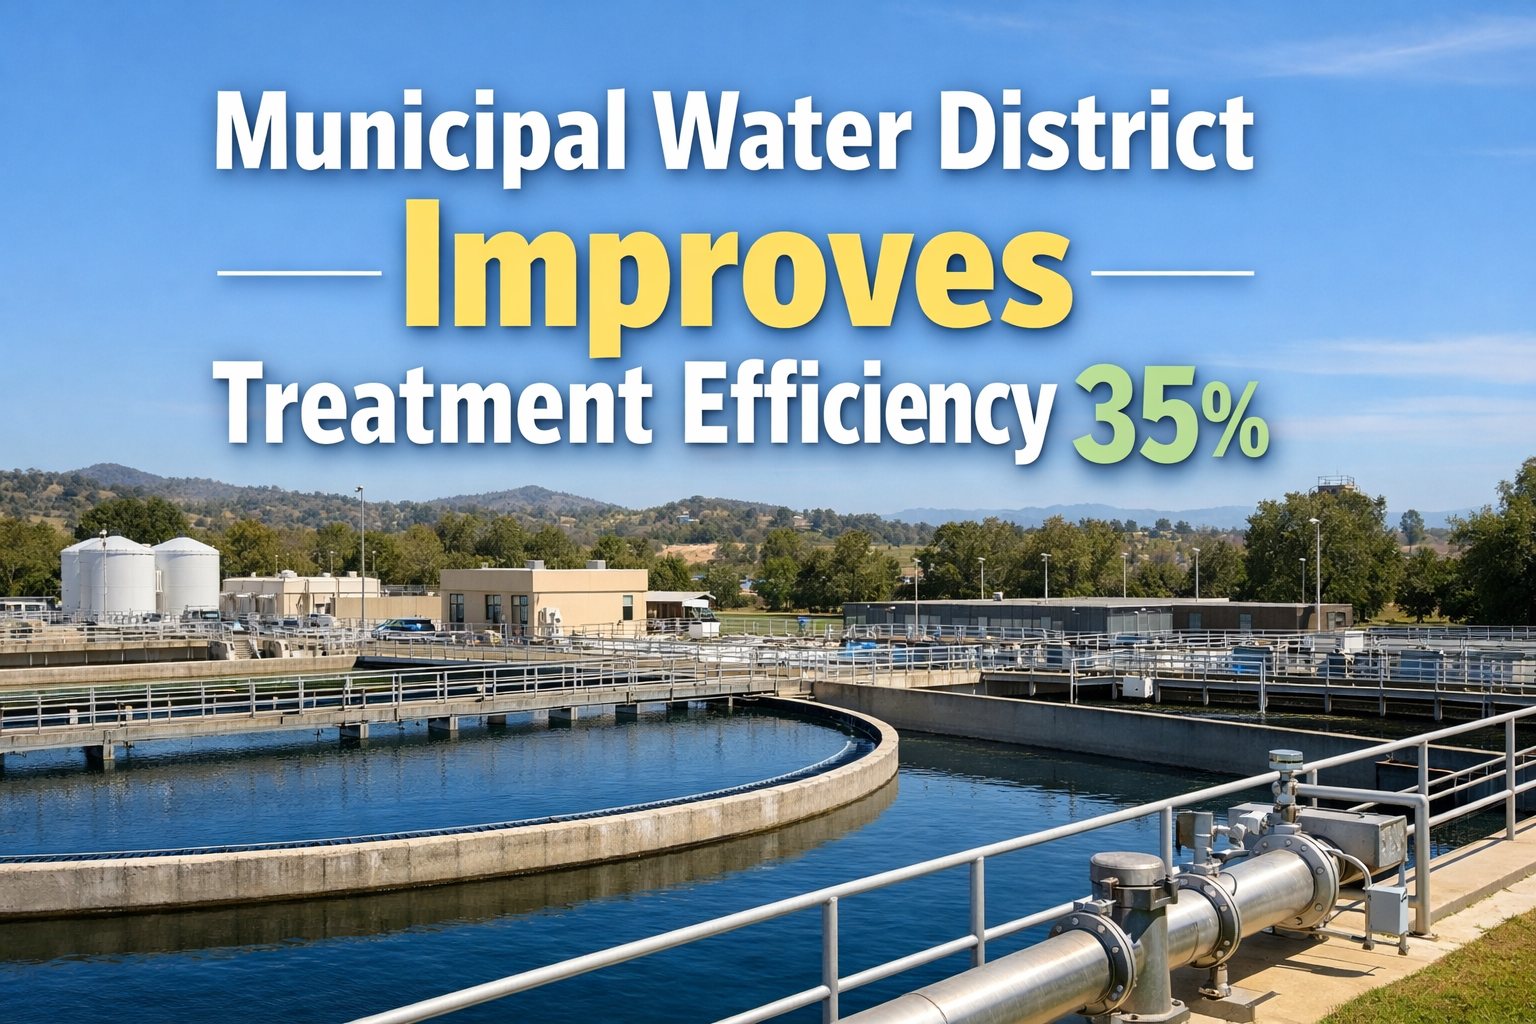
A municipal water district serving 310,000 residents was struggling with aging treatment infrastructure, rising chemical costs, and increasing regulatory pressure. Treatment plants arewere operating at just 65% efficiency, with chemical overspending of $1.2M annually and frequent compliance near-misses that threatened public health and the district's operating permits. Within 18 months of implementing modern asset management and process optimization, the district achieved a 35% improvement in treatment efficiency—saving $2.1M annually while exceeding every EPA water quality standard.
Water treatment is among the most asset-intensive municipal operations, with pumps, chemical feed systems, filtration units, UV disinfection arrays, and SCADA controls all requiring precise coordination. When equipment degrades or maintenance falls behind, treatment efficiency drops, chemical usage spikes, and compliance risks escalate rapidly across the entire treatment chain. This case study examines how one district transformed operations through intelligent facility management.
Optimize Your Water Treatment Operations
See how modern asset management helps water districts reduce chemical waste, improve efficiency, and maintain 100% regulatory compliance.
The Challenge: Inefficient Treatment Operations Draining Resources
The district operated three water treatment plants processing a combined 42 million gallons daily (MGD), serving residential, commercial, and industrial customers. Decades of deferred maintenance, manual monitoring processes, and reactive equipment management had created systemic inefficiencies that compounded year over year.
Pre-Implementation Performance Profile
- Treatment Efficiency: 65% of optimal performance benchmarks
- Chemical Overspending: $1.2M annually above optimized dosing levels
- Unplanned Equipment Downtime: 847 hours annually across three plants
- Energy Consumption: 18.4 million kWh/year for treatment operations
- Compliance Near-Misses: 14 incidents in the previous 24 months
- Maintenance Approach: 78% reactive, 22% preventive
- Annual Operating Cost: $8.6M for treatment operations
Critical Operational Issues
- Manual Chemical Dosing: Operators adjusting chemical feed rates based on experience rather than real-time water quality data and automated optimization
- Aging Filtration Systems: Filter media past optimal lifespan, requiring excessive backwash cycles and wasting 2.3M gallons daily
- Pump Degradation: High-lift and distribution pumps operating 18-25% below rated efficiency
- No Predictive Capability: Equipment failures causing emergency shutdowns and treatment bypasses
- Siloed Plant Data: Three plants with separate SCADA systems, no centralized performance visibility
- Paper-Based Maintenance: Work orders tracked on paper with no historical trending or failure pattern analysis capability
The Solution: Integrated Asset Management and Process Optimization
The district implemented a comprehensive cloud-based CMMS and asset management platform that unified all three treatment plants under a single digital operations center, connecting SCADA data, maintenance workflows, chemical management, and compliance documentation into one intelligent system.
Key Technology Components Deployed
- Centralized Asset Registry: 4,200+ treatment assets digitized with condition scoring and lifecycle tracking
- Predictive Maintenance Engine: Vibration, temperature, and performance sensors on critical equipment feeding AI-powered failure prediction algorithms
- Chemical Optimization Module: Real-time turbidity, pH, and chlorine residual monitoring driving automated dosing adjustments
- Mobile Workforce Management: Field technicians accessing work orders, asset history, and SOPs on tablets
- Compliance Automation: Automated EPA reporting, sampling schedules, and regulatory documentation
- Energy Monitoring Integration: Per-process energy tracking identifying inefficient operations
Implementation Timeline
Phase 1: Foundation and Quick Wins (Months 1-4)
- Complete asset inventory and condition assessment across all three plants
- CMMS deployment with automated PM scheduling for 280 critical assets
- SCADA integration providing centralized monitoring dashboard
- Eliminated 14 overdue regulatory inspections within first 60 days
Phase 2: Process Optimization (Months 5-10)
- Chemical feed optimization system activated—immediate 18% reduction in chemical usage
- Predictive maintenance sensors installed on 85 high-value rotating equipment assets
- Filter performance monitoring and automated backwash optimization reducing water waste
- Energy baseline established with per-process consumption tracking
Phase 3: Advanced Analytics and Continuous Improvement (Months 11-18)
- Machine learning models predicting equipment degradation 3-6 weeks before failure
- Automated compliance reporting eliminating 320 hours of manual documentation annually
- Cross-plant performance benchmarking driving best practice standardization
- Energy optimization achieving 22% reduction in treatment-related power consumption
Results: 35% Treatment Efficiency Improvement Achieved
Key Performance Achievements
- 35% improvement in overall treatment efficiency
- $2.1M annual operating cost savings
- 42% reduction in chemical consumption through optimized dosing
- 91% reduction in unplanned downtime (847 hrs → 76 hrs annually)
- Zero compliance violations since implementation (vs. 14 near-misses prior)
- 22% energy reduction in treatment operations
- ROI of 412% in the first 18 months
Detailed Performance Comparison
| Metric | Before Implementation | After Implementation | Improvement |
|---|---|---|---|
| Treatment Efficiency | 65% | 88% | +35% |
| Chemical Costs | $2.8M/year | $1.6M/year | -42% |
| Unplanned Downtime | 847 hours/year | 76 hours/year | -91% |
| Energy Consumption | 18.4M kWh/year | 14.3M kWh/year | -22% |
| Compliance Incidents | 14 near-misses/2yr | 0 violations | 100% compliant |
| Maintenance Approach | 78% reactive | 82% preventive/predictive | Complete reversal |
| Backwash Water Waste | 2.3M gal/day | 1.1M gal/day | -52% |
| Annual Operating Cost | $8.6M | $6.5M | -$2.1M saved |
ROI Analysis and Financial Impact
Investment Breakdown:
- CMMS Platform and Licensing: $96,000 annually
- Sensors and Hardware: $185,000 (one-time)
- SCADA Integration: $120,000 (one-time)
- Training and Change Management: $38,000 (one-time)
- Total First-Year Investment: $439,000
Annual Savings Delivered:
- Chemical Cost Reduction: $1,200,000
- Energy Savings: $410,000
- Maintenance Cost Reduction: $320,000
- Avoided Compliance Penalties: $85,000
- Reduced Water Waste: $85,000
- Total Annual Savings: $2,100,000
Financial Summary
First-Year ROI: 412%
Payback Period: 2.5 months
Projected 5-Year Savings: $10.5 million
Cost per Treated Gallon Reduction: 34%
Key Strategies That Drove the 35% Improvement
1. Real-Time Chemical Optimization
Replacing manual dosing with sensor-driven automated chemical feed control eliminated chronic over-dosing. The system continuously adjusts coagulant, chlorine, and fluoride rates based on incoming raw water quality—saving $1.2M annually in chemical costs alone.
2. Predictive Maintenance on Critical Equipment
Vibration and thermal sensors on pumps, blowers, and motors predicted 94% of potential failures 3-6 weeks in advance. This eliminated emergency shutdowns that previously forced treatment bypasses and caused compliance risks.
3. Filter Performance Analytics
Continuous monitoring of filter head loss, turbidity breakthrough, and runtime optimization reduced unnecessary backwash cycles by 52%, recovering 1.2 million gallons of treated water daily that was previously wasted.
4. Centralized Multi-Plant Visibility
Connecting three separate SCADA systems into one unified operations dashboard allowed managers to compare plant performance, share best practices, and balance loading across facilities for optimal district-wide efficiency.
5. Automated Compliance Documentation
Every sample, test result, maintenance activity, and calibration was automatically logged with timestamps and digital signatures—eliminating 320 hours of annual paperwork while creating an audit-proof compliance record.
Lessons Learned and Recommendations
Critical Success Factors for Water Districts
- Start with Chemical Optimization: Fastest payback and most visible impact for board and ratepayer support
- Invest in Operator Training: Technology only works when operators trust and understand the systems
- Connect SCADA to CMMS: The gap between process data and maintenance data is where efficiency is lost
- Prioritize Critical Assets First: Focus predictive maintenance on the 15% of assets that cause 80% of failures
- Automate Compliance Early: Removes the biggest source of staff anxiety and frees time for optimization work
- Measure Everything from Day One: Baseline data is essential for proving ROI to elected officials and ratepayers
Recommendations for Water Treatment Facilities
- Conduct a comprehensive treatment efficiency audit before selecting technology solutions
- Deploy mobile-accessible CMMS tools for field operators within the first 60 days
- Integrate chemical feed optimization as a Phase 1 priority for immediate cost reduction
- Establish automated compliance reporting to eliminate manual documentation burden
- Implement cross-plant benchmarking to identify and replicate best practices
- Plan for continuous improvement—the system should get smarter every quarter
Frequently Asked Questions
Q: How does asset management improve water treatment efficiency
A: Modern asset management platforms connect process monitoring, equipment maintenance, and chemical optimization into one system. When a pump degrades, the system detects the efficiency loss, schedules maintenance before failure, and adjusts treatment processes to compensate—preventing the cascading inefficiencies that plague reactive operations.
Q: What is the typical ROI timeline for water treatment optimization
A: Most water districts see positive ROI within 3-6 months, primarily from chemical cost reduction and energy savings. Chemical optimization alone typically pays for the entire platform. Predictive maintenance savings compound over 12-18 months as equipment reliability improves and emergency repair costs decline.
Q: Can this work for smaller water systems
A: Yes—cloud-based platforms scale to any size. Smaller systems often see even faster ROI because inefficiencies represent a larger percentage of their operating budget. A district serving 20,000 residents can achieve similar percentage improvements with proportionally smaller investment.
Q: How does predictive maintenance prevent compliance violations
A: Equipment failures are the leading cause of treatment upsets and compliance violations. Predictive maintenance identifies failing equipment weeks before it impacts treatment quality, allowing scheduled repairs during low-demand periods rather than emergency responses during treatment disruptions.
Ready to Improve Your Water Treatment Efficiency
Schedule a free consultation to see how modern asset management can reduce chemical costs, eliminate compliance risks, and optimize your treatment operations.