.png)
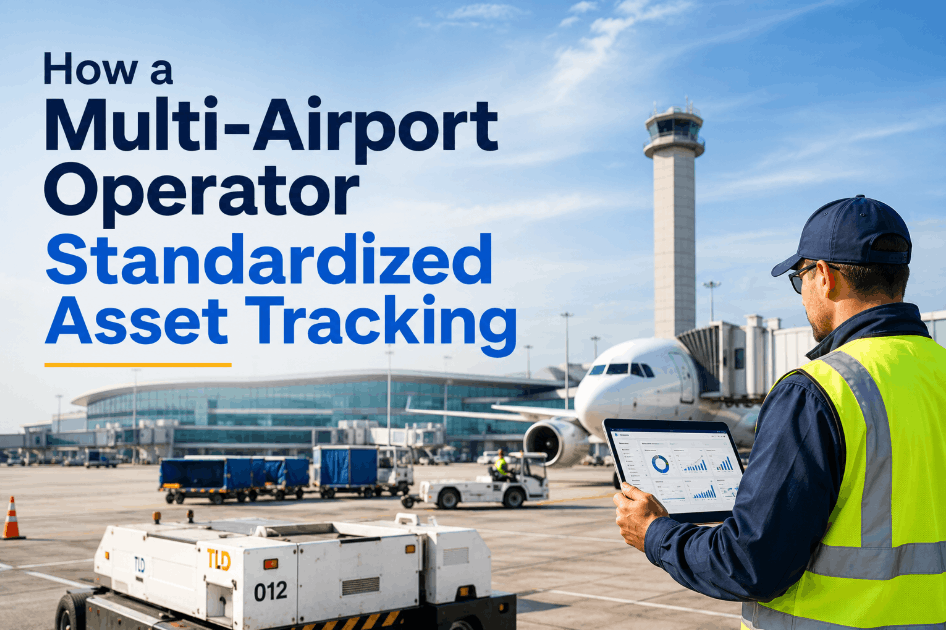
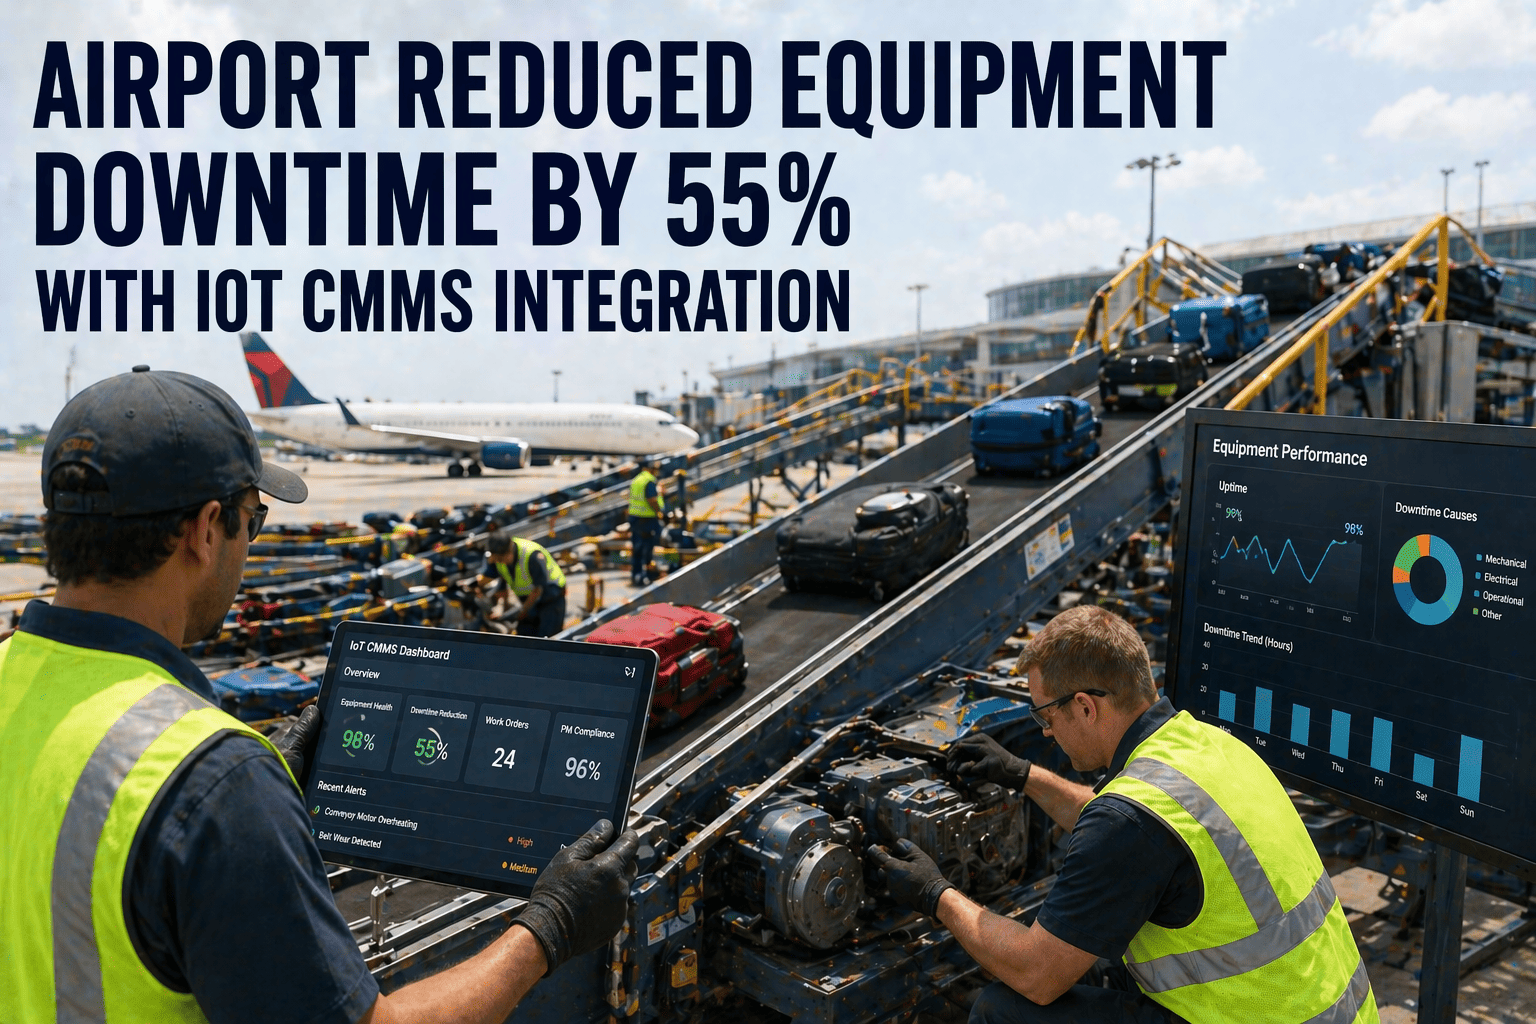
An airport group in the Midwest operating 8 facilities — two hubs, three mid-sized regional airports, and three secondary fields — had eight different maintenance philosophies, eight separate spreadsheet systems, eight inventories, and zero portfolio visibility. The smallest airport spent more per square foot on maintenance than the largest hub. Two airports were running the same baggage conveyor brand on opposite PM intervals. Spare parts sat unused at one site while another paid expedited shipping for the identical part. When the corporate operations director asked a simple question — "what is our portfolio-wide PM compliance rate?" — nobody could answer it without a two-week data-pulling exercise. Eighteen months after consolidating onto a single CMMS platform with a standardized asset hierarchy, the group reported a 28% reduction in total maintenance cost across the portfolio, 95% PM compliance, and the ability to benchmark every airport against every other airport on the same dashboard. If your airport group is running parallel maintenance organizations that happen to share an owner, you are leaving the same money on the table — start a free trial to see how the standardization actually works, or book a demo with the team to walk through your portfolio.
8 Airports. 1 CMMS. 28% Lower Maintenance Cost in 18 Months.
A multi-airport operating group ended a decade of fragmented maintenance — eight separate systems, eight separate inventories, zero portfolio visibility — by consolidating onto a single asset hierarchy. The financial result was measurable. The operational result was structural.
Your portfolio is one business. Your CMMS should reflect that.
If your airport group is asking each director for a different KPI report in a different format, the spreadsheet sprawl is costing you more than you can see. A single portfolio-aware CMMS replaces every local system without replacing any local team. You can start a free trial in minutes or book a demo for a portfolio-level walkthrough.
The Hidden Cost of "Independent" Airports Inside One Group
A multi-airport group is technically one organisation. Operationally, it usually behaves like eight. Each airport has its own CMMS spreadsheet, its own preferred vendors, its own inventory practices, and its own definition of "PM compliance" — which means the corporate ops team cannot compare any two airports on the same metric. Industry data confirms the pattern: airport portfolios that have not standardised maintenance run 30–45% of total spend through cost multipliers — emergency callouts, expedited shipping, duplicate inventory, regulatory remediation — none of which appear as line items in any single facility's budget.
The 6 Pillars of Multi-Airport Standardisation
Standardising maintenance across 8 airports is not a software project — it is an operating-model change with software as the enabling layer. Six pillars define what "standardised" actually means at the portfolio level. Skip any one and the standardisation collapses back into local variation within 12 months.
Portfolio > Airport > Terminal/Airfield > System > Asset > Component. Every chiller, jet bridge, and conveyor sits at the same hierarchy depth. No exceptions, no "we do it differently here" — that is the variation that defeats benchmarking on day one.
A baggage carousel at Airport A and Airport H run the same PM template — same intervals, same checklist items, same parts list. Local supervisors approve the template at rollout, then it is locked at portfolio level until a controlled change request modifies it everywhere.
PM compliance, MTBF, MTTR, work order ageing, and maintenance cost per square foot are calculated identically at every site. One formula, one dashboard, eight comparable airports. The CFO finally gets an apples-to-apples portfolio view.
A shared parts catalogue with cross-site visibility. When Airport C's stockroom holds a part Airport F is overnight-shipping, the system flags the imbalance before the order goes out. Duplicate inventory drops 35–50% in year one.
Approved vendor lists, master service agreements, and rate cards are managed at the portfolio level. Eight airports stop independently negotiating the same elevator service contract at eight different price points.
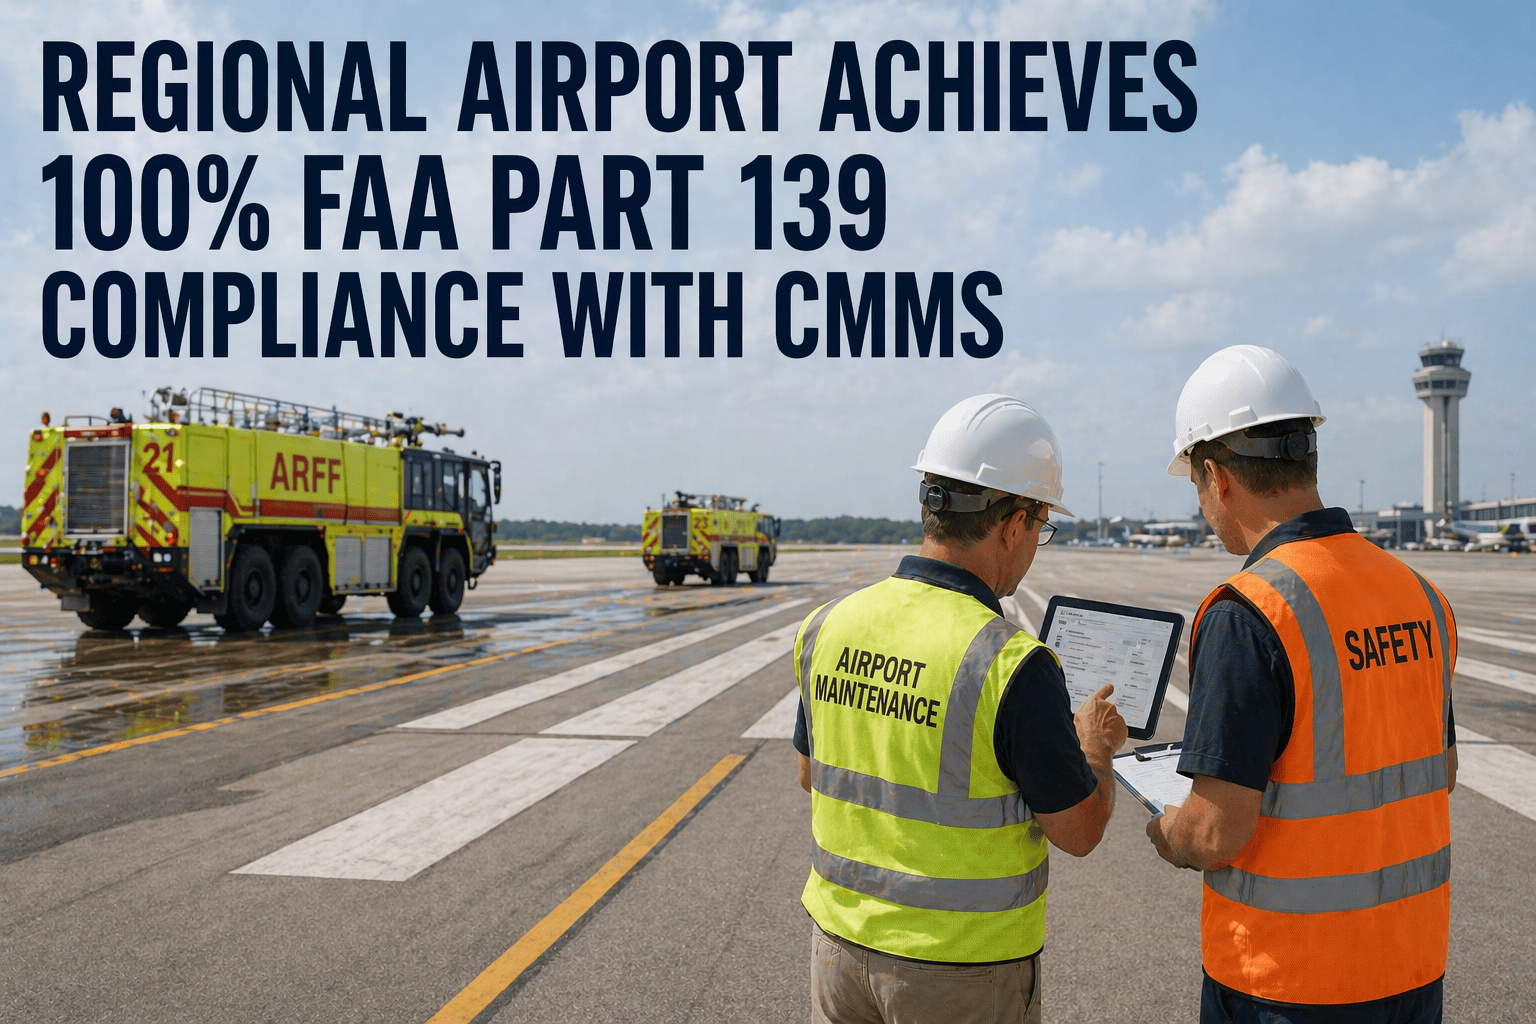
FAA Part 139 self-inspection records, OSHA documentation, and FAA CertAlert response evidence follow the same schema everywhere. When the FAA inspector arrives at any airport, the documentation pack is identical and audit-ready in minutes.
What 8 Independent Airports Looked Like Before
Below are the six fragmentation symptoms the airport group documented during their pre-standardisation audit. Every multi-airport portfolio has at least four of these. Most have all six.
Airport A counted overdue PMs as "completed-late". Airport D excluded them from the denominator entirely. Airport G measured by labour hours, not work order count. Reported PM compliance at the portfolio level was meaningless because no two airports calculated it the same way.
A portfolio-wide stockroom audit found $2.4M in spares carried at multiple airports for assets that broke twice a decade. Meanwhile, three of the airports were carrying expedited-shipping budgets for parts another airport had on the shelf 240 miles away.
When Airport B's de-icing pump failed in a specific way, Airport E hit the same failure six weeks later and had to learn it independently. Shared failure history is the single highest-leverage benefit of portfolio CMMS, and the airport group had none of it.
The same elevator maintenance contractor was charging Airport F 41% more per service call than Airport A — for the identical scope. Without a portfolio rate card, every airport negotiated alone and the vendors knew it.
When an FAA Part 139 inspection was scheduled at any of the airports, the local team spent up to two weeks pulling self-inspection records, training certifications, and ARFF readiness documentation from disparate folders, emails, and binders.
The corporate finance team could not produce a credible 5-year portfolio CapEx forecast because no one could tell them the remaining useful life of any asset class across the eight sites. Every renewal decision was reactive.
A portfolio CMMS is not a head-office takeover — it is shared infrastructure.
Local airport directors keep their authority. Local supervisors keep their teams. What changes is the data layer underneath them — and that is what unlocks 28% portfolio savings without any layoffs.
The 8-Airport Rollout: How OxMaint Was Sequenced
Standardising 8 airports at once would have failed. The group sequenced rollout across two waves, six months apart. Each airport went live in 4 weeks, not 18 months. The pattern below is how OxMaint structures multi-site implementations for airport groups.
Corporate ops, engineering, and a representative from each airport agreed on the standard hierarchy: Portfolio > Airport > Terminal/Airfield > System > Asset > Component. Every asset class — chillers, jet bridges, baggage systems, ARFF vehicles, runway lighting circuits — got a single canonical structure. Two weeks total.
A mid-sized hub and a regional airport went first. The contrast was deliberate — the system needed to prove it worked at both ends of the complexity spectrum before scaling. Asset import, PM template build, mobile rollout to technicians: 4 weeks each.
With the templates proven, three additional airports onboarded simultaneously. The PM template library was already built, so each airport's go-live focused on asset import, local PM customisation, and technician training. Average go-live: 28 days per airport.
The remaining three airports onboarded in parallel six months after Wave 1. By this point, peer airports were sharing PM template improvements via the platform itself — the implementation became self-reinforcing. Total elapsed time across 8 airports: 11 months.
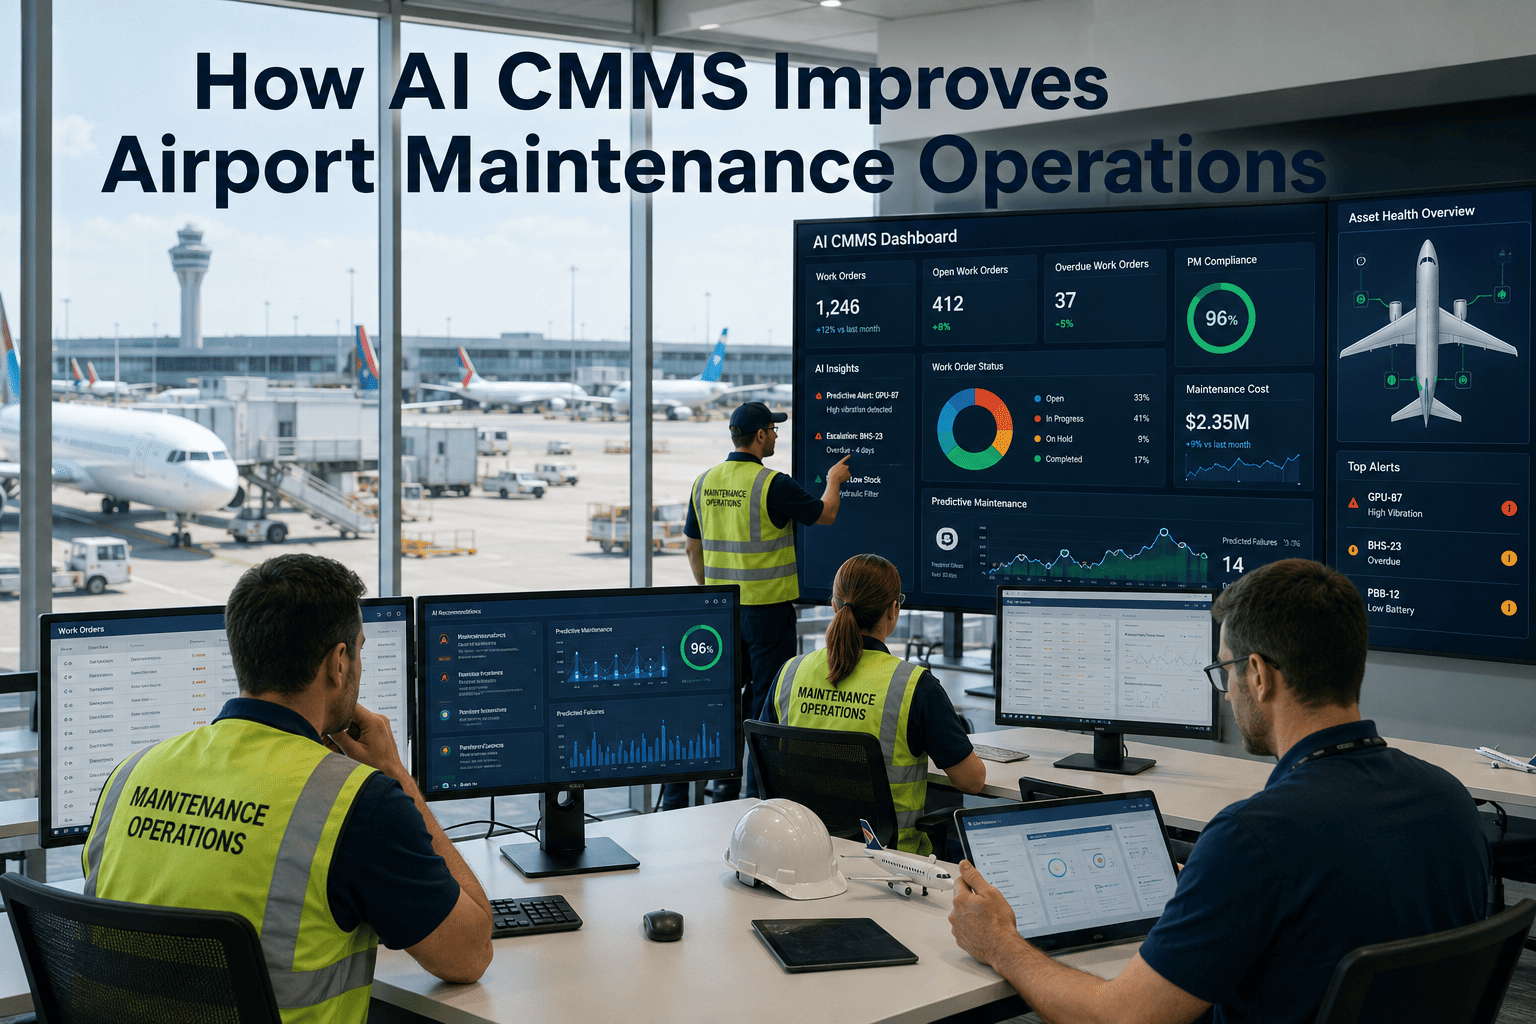
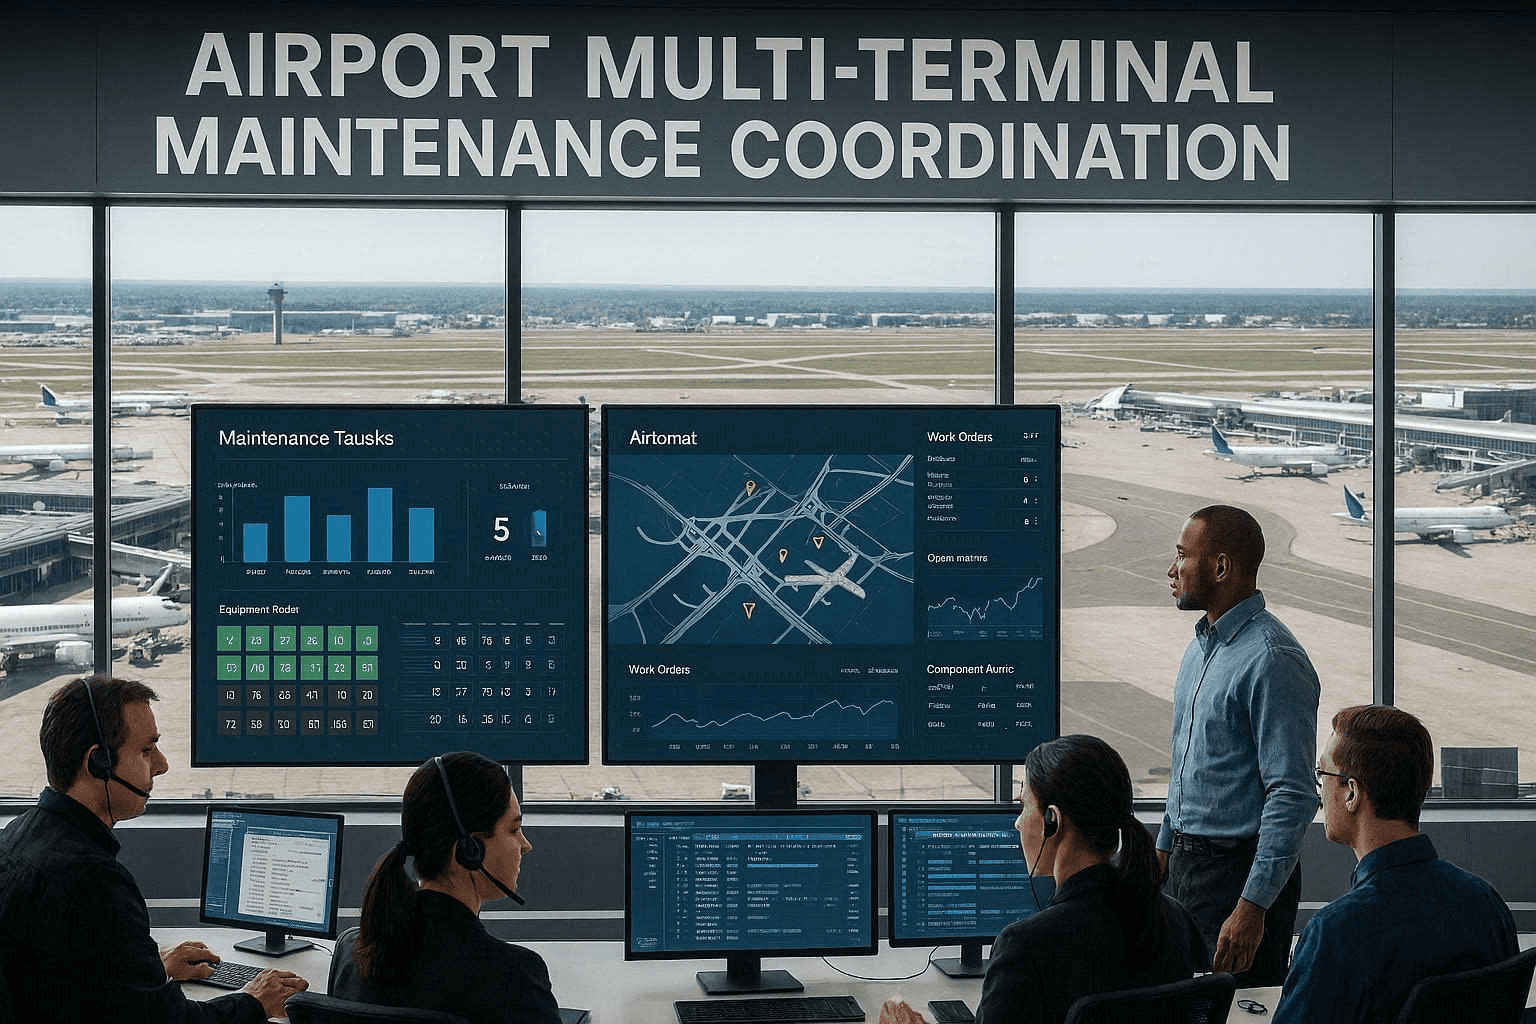
With all 8 airports on the platform, the corporate operations team activated the portfolio dashboard: cost per square foot by airport, PM compliance ranking, MTBF outliers, parts inventory imbalances, and 5-year CapEx forecast — all on a single screen.
The group instituted a quarterly portfolio review where every airport director sees their KPIs ranked against peers. The conversation shifted from "we are doing fine" to "Airport D is at 97% PM compliance — what is their crew doing differently?" That benchmarking culture is where the 28% cost reduction actually came from.
Cross-Airport Benchmarking — What the Portfolio Dashboard Now Shows
Once 8 airports run on a single CMMS with identical KPI definitions, every metric becomes a benchmarking opportunity. Below is a representative slice of the portfolio dashboard 18 months after standardisation — every airport ranked on the same scale, with outliers visible at a glance.
Portfolio average: 95% PM compliance. Pre-standardisation portfolio average (where it could be calculated at all): 64%. The smaller regionals — historically the worst-performing tier — now match the hubs because they are running the same templates with the same accountability.
Before vs After Standardisation — Portfolio Snapshot
| Operational Metric | Before (Fragmented) | After (Standardised on OxMaint) | Change |
|---|---|---|---|
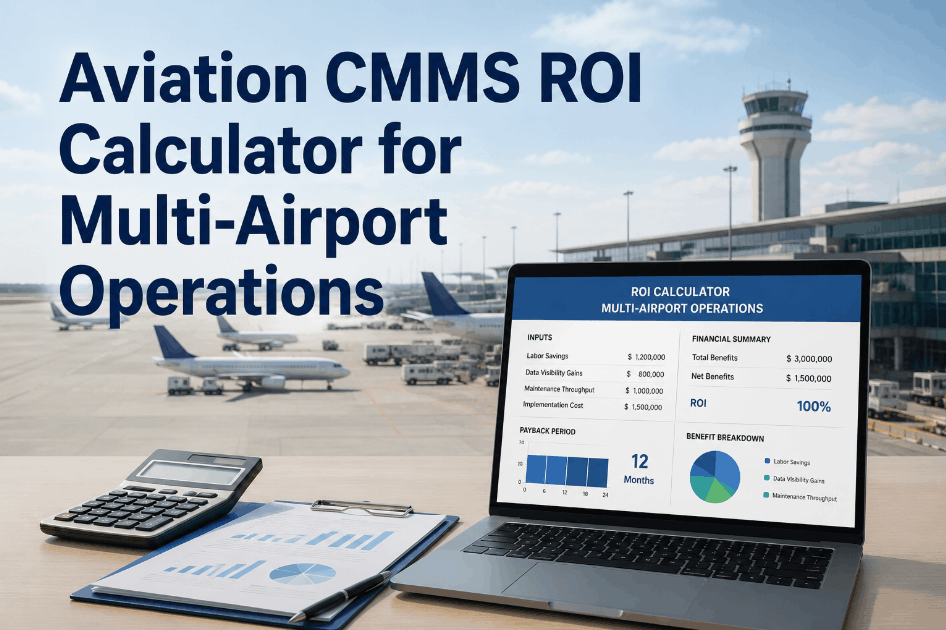
| Total maintenance spend (portfolio) | $52.8M annually | $38.0M annually | -28.0% |
| PM compliance (portfolio average) | ~64% (estimated) | 95% | +31 pts |
| Emergency-to-planned work ratio | 38% emergency | 11% emergency | -71% |
| Spare parts inventory carried | $8.6M across sites | $5.4M with shared visibility | -37% |
| FAA Part 139 audit prep time | 10–14 days | Under 4 hours | -95% |
| Portfolio CapEx forecast horizon | None reliable | Rolling 5–10 year | New capability |
| MTTR (cross-portfolio average) | 9.4 hours | 4.1 hours | -56% |
| Time to onboard a new airport | N/A (separate systems) | 4 weeks | New capability |
The 18-Month Result, In Numbers
Frequently Asked Questions
Will standardising the CMMS force every airport to do maintenance the same way?
How does OxMaint handle the differences between large hubs and regional airports?
What does the rollout actually cost compared to running 8 separate systems?
How does portfolio standardisation affect FAA Part 139 audit readiness?
Eight airports. Eight maintenance programs. One CMMS — and 28% lower cost.
OxMaint is built for multi-site commercial and industrial portfolios. Standard asset hierarchy, portfolio-level KPIs, shared parts catalogue, audit-ready compliance schema, and rolling 5–10 year CapEx forecasting — out of the box, no heavy implementation. Bring your portfolio onto a single platform and start benchmarking every airport against every other airport on the same dashboard.