Ground ops lives and dies on the turnaround, and the turnaround lives and dies on GSE that's actually ready when the aircraft arrives. Yet most ramp teams measure GSE the way they measure weather — anecdotally. "The belt loader's been playing up." "We're short on tugs today." None of that tells you whether your fleet is getting more reliable or less, or which unit is quietly eating your on-time performance. The fix is a small set of KPIs that turn ramp reliability into numbers you can act on. This guide breaks down the four that matter most, and shows how OXMAINT AI, the AI-powered CMMS, generates every one of them from the work orders you already log.
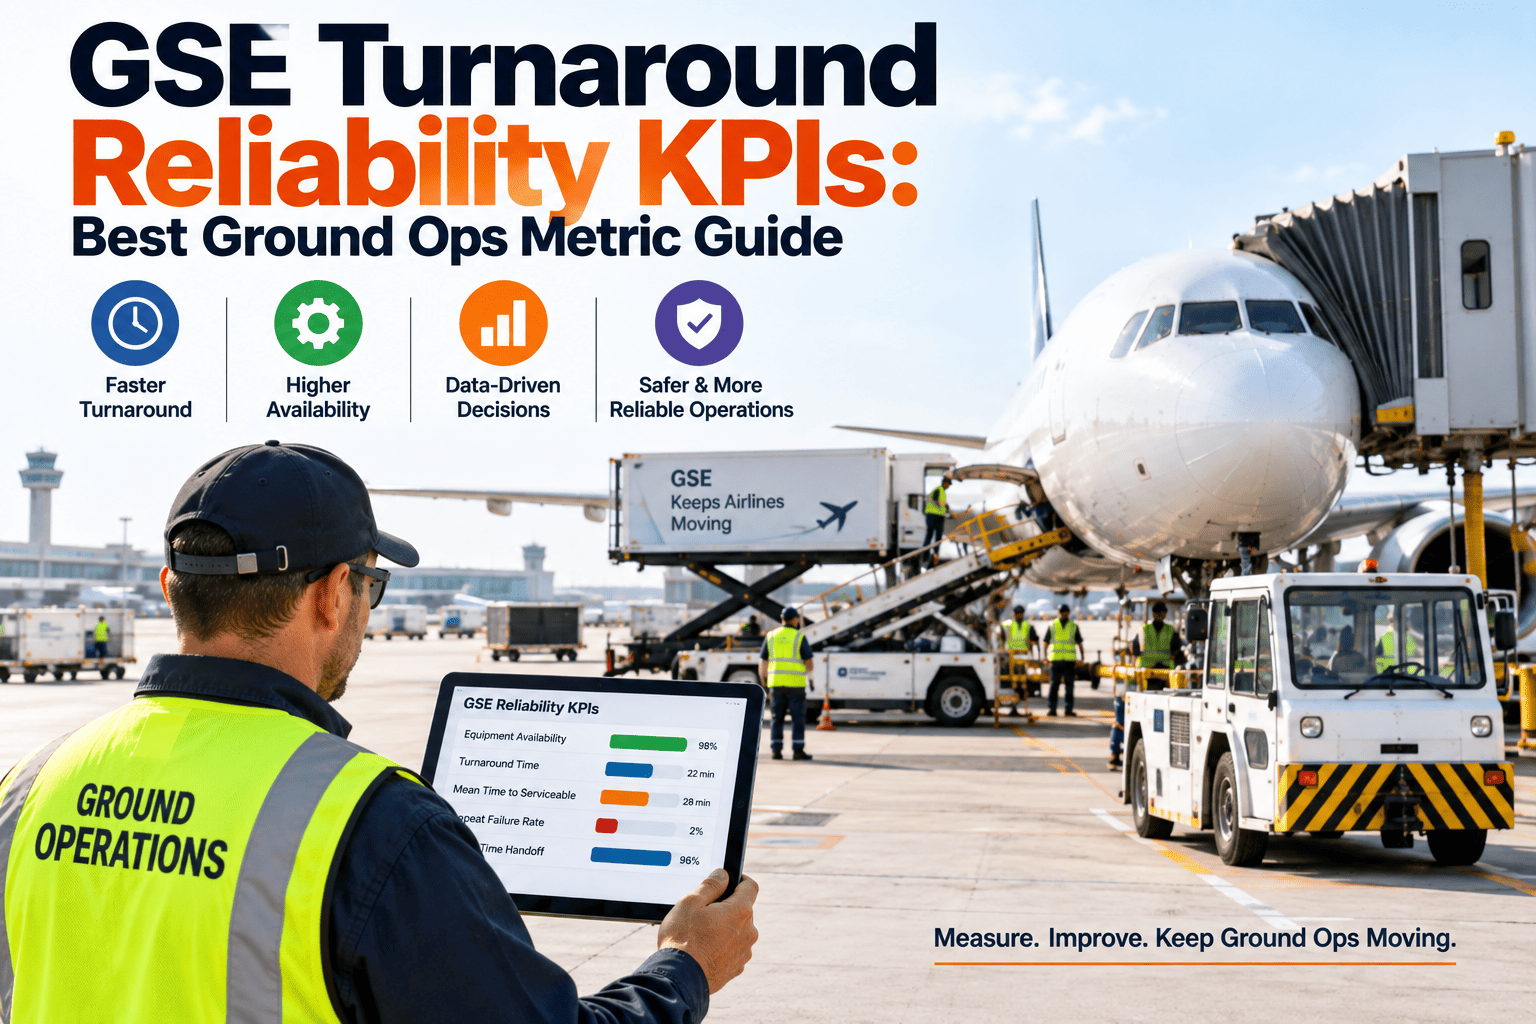
GSE Turnaround Reliability KPIs: Best Ground Ops Metric Guide
You can't improve GSE reliability you don't measure — and "it feels unreliable" isn't a metric. Four KPIs turn ramp performance into something you can track and defend: availability at the gate, failed handoff rate, minute-to-serviceable, and repeat-fail per tail number. OXMAINT AI builds all four from your maintenance history, so ground ops runs on a live scorecard instead of ramp folklore.
Why "It Feels Unreliable" Isn't Enough
Ramp teams under pressure default to gut feel — the loudest breakdown gets remembered, the slow decline doesn't. Without numbers, you can't tell a one-off from a pattern, can't prove the fleet is improving, and can't defend a repair-or-replace call to finance. KPIs replace the anecdote with a trend: the same event, counted the same way, every day. Start free and trade folklore for numbers.
- A slowly declining unit that never fails dramatically
- Which tail numbers keep getting unreliable equipment
- Whether the fleet is actually improving or drifting
- How long a failed unit really takes to get serviceable
- The evidence to justify replacing a chronic offender
- Availability trending up or down, unit by unit
- Repeat failures pinned to specific equipment
- A fleet-level direction you can actually manage
- Real minute-to-serviceable, not a guess
- The data to back a repair-or-replace decision
The Four KPIs That Matter
These four cover the whole reliability picture — is the gear ready, does it hold up during the handoff, how fast does it recover, and which units are chronic. Track these and you're managing the fleet, not reacting to it. Book a demo to set targets for your ramp.
How to Read Them Together
No single KPI tells the whole story — they're most powerful read as a set. Here's what each combination is pointing at. Start free and see all four on one dashboard.
| What you see | What it means | Where to look |
|---|---|---|
| Availability high, handoff fails high | Gear is present but failing under load | Condition of in-service units, not fleet size |
| Availability low, minute-to-serviceable high | Slow recovery is choking readiness | Maintenance response and spares staging |
| Fleet fine, one tail's repeat-fail high | A few chronic units skew the ramp | Repair-or-replace on those specific units |
| All four trending the wrong way | Systemic — PM cadence isn't keeping up | The preventive schedule itself |
A KPI You Calculate by Hand Once a Month Is Already Stale.
Ramp reliability moves daily — a monthly spreadsheet can't keep up, so the numbers arrive too late to act on. OXMAINT AI computes all four KPIs from the work orders you're already logging, so the scorecard is live, per-unit, and current when you look.
What OXMAINT AI Does With Your GSE Data
You already log GSE faults and repairs. OXMAINT AI turns that same history into a live reliability scorecard — so the KPIs cost you no extra tracking. Start free and put your history to work.
Spreadsheet KPIs vs. a Live Scorecard
| What matters | Manual spreadsheet | OXMAINT AI |
|---|---|---|
| Freshness | Monthly, already stale | Live from logged work |
| Per-unit detail | Fleet averages only | Down to each tail/unit |
| Minute-to-serviceable | Estimated after the fact | Timestamped automatically |
| Repeat offenders | Hard to spot in totals | Surfaced per tail number |
| Effort to maintain | Hours of manual entry | Built from data you log |
| From metric to action | A number on a page | Becomes scheduled work |
Frequently Asked Questions
Run Ground Ops on Numbers, Not Folklore.
Turn the GSE faults you're already logging into four live KPIs — availability, failed handoff, minute-to-serviceable, and repeat-fail per tail — so you catch the weak units before they reach the gate.