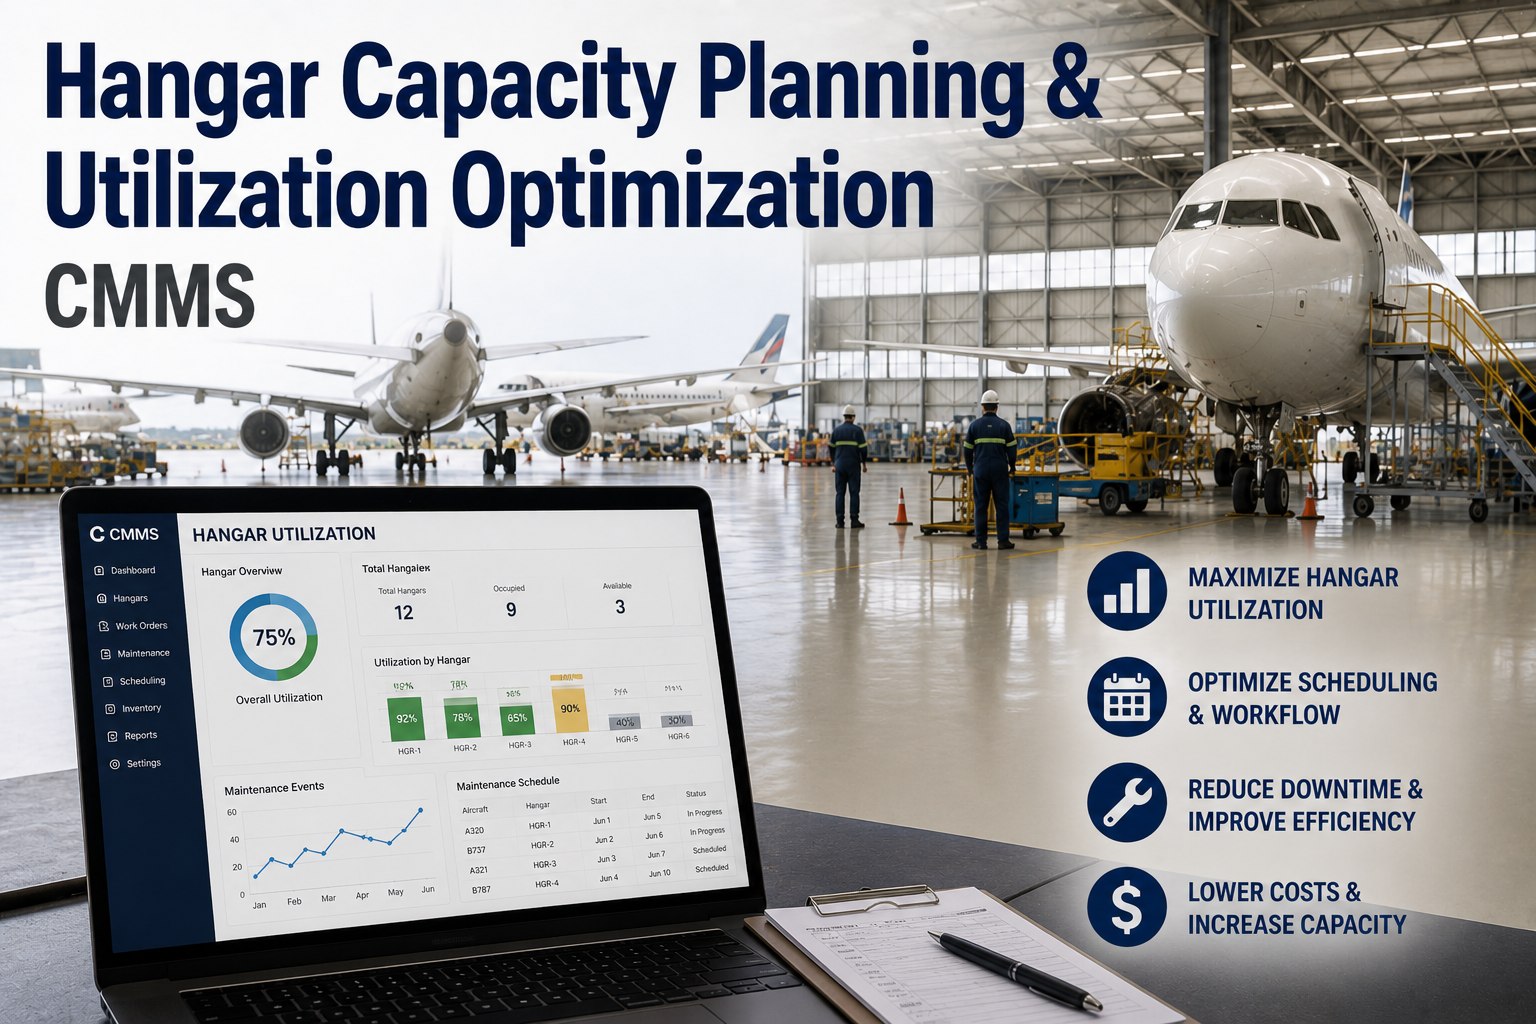
Hangar Capacity Planning and Utilization Optimization

By Lewis Abbott on April 1, 2026

hangar-capacity-planning-utilization-optimization

Most MRO facilities are flying blind on capacity — they know the hangar is full, but they cannot tell you which bay will open Thursday, which team has 40% slack next week, or whether accepting that next AOG recovery will blow the schedule for three planned checks. The difference between a hangar that runs at 61% utilization and one that pushes 87% is not more aircraft or more mechanics — it is knowing exactly where every hour, every bay, and every skill set is going, before the week starts. If your planning still happens in spreadsheets and whiteboard conversations, you are leaving real throughput on the table. Want to see what data-driven capacity management looks like in practice? Start a free trial or book a demo with our MRO operations team today.

MRO Operations & Facility Management · 2026

Hangar Capacity Planning
That Fills Bays, Not Spreadsheets

A practical guide for MRO directors, maintenance planners, and facility managers who want to move from reactive scheduling to proactive bay utilization — with real metrics, real tooling, and real outcomes.

61%
Average hangar utilization at MROs using manual scheduling
MRO Benchmark Study, 2024
$38K
Lost revenue per idle bay-day at a mid-size commercial MRO
Aviation Week MRO Report, 2025
26%
Throughput improvement achieved by MROs adopting digital capacity tools
Oliver Wyman MRO Survey, 2025
4.2x
ROI delivered in year one from optimized slot management and labor allocation
Oxmaint MRO Client Data, 2025
Get Started Today

Ready to Stop Guessing and Start Optimizing?

Oxmaint gives your planning team live visibility into bay availability, labor hours, and workload forecasts — so you can schedule with confidence, not instinct. If you are still reconciling bay assignments in a shared spreadsheet the night before work begins, it is time for a better approach. Start a free trial and run your first capacity forecast in under an hour, or book a demo to walk through a live planning session with our team.

The Foundation

What Is Hangar Capacity Planning — and Why Does It Break Down?

Hangar capacity planning is the discipline of matching available physical space (bays), skilled labor, tooling, and parts supply to the incoming maintenance workload — across a rolling planning horizon of days, weeks, and months. Done well, it ensures every bay runs at peak utilization, no qualified technician is idle, and every customer commitment is met without a last-minute scramble.

Done poorly — which describes most facilities running on shared spreadsheets and tribal knowledge — it produces chronic overbooking, hidden slack, schedule collisions, and TAT overruns that erode customer confidence and margin simultaneously. The root issue is not a lack of effort but a lack of real-time data. Planners cannot optimize what they cannot see. Start a free trial to see live capacity visibility in action, or book a demo with our MRO planning specialists.

The Four Capacity Dimensions
01
Physical Space
Bay dimensions, door clearance, aircraft type compatibility, and simultaneous occupancy limits
02
Labor Capacity
Technician headcount, license ratings, shift coverage, and available man-hours per task type
03
Tooling & Equipment
Dock availability, GSE, test equipment, and specialized tooling shared across concurrent work packages
04
Parts & Materials
Rotable availability, consumables stock, and vendor lead times that gate task start windows
Where It Goes Wrong

8 Capacity Planning Failures That Cost MROs Millions Every Year

These are not edge cases — they are the weekly reality for MROs still running capacity on gut feel and static schedules. Each one has a measurable cost.

01
Phantom Bay Availability
A bay shows as open in the schedule but cannot accept an aircraft because of tooling in place, an adjacent check requiring dock space, or an unreported delay pushing the current tenant. Planners discover the conflict 24 hours before slot time.
02
Labor Allocation Blindness
Scheduling adds a new work package without checking how many licensed A&P mechanics are already committed. Three checks land simultaneously, all drawing from the same NDT inspector pool — and two of them stall waiting for sign-off.
03
Scope Creep Cascade
An airframe check opens work items beyond the quoted scope. Without real-time capacity recalculation, the additional 340 man-hours push into the next aircraft's slot — creating a ripple that affects four subsequent customers.
04
Tooling Contention
Two simultaneous engine changes require the same fixture set. The conflict only surfaces when both work packages begin — one team sits idle while management resolves the contention. Average delay: 6.4 hours per event.
05
AOG Acceptance Without Capacity Check
Commercial pressure drives acceptance of unplanned AOG recovery without evaluating impact on scheduled work. The expedited entry disrupts three planned checks, burning customer goodwill and eroding margin on all four aircraft.
06
Manual Workload Forecasting Lag
Weekly capacity meetings work from data compiled the day before. By the time decisions are made, two shifts have already occurred under the old assumptions. Reactive replanning burns management time without improving outcomes.
07
Chronic Underutilization Hidden by Busyness
The hangar looks busy — technicians are moving, tools are in use — but actual billable throughput sits at 61%. Idle pockets in the schedule are invisible without utilization analytics. Revenue is being left in empty bays.
08
No Forward Visibility for Commercial Teams
Sales cannot quote accurate TAT commitments because operations cannot confirm bay availability past two weeks. Losing a contract because "we couldn't confirm the slot in time" is a capacity planning failure, not a sales failure.
Before vs. After

Manual Scheduling vs. Digital Capacity Management: The Operational Gap

Here is what your planning team experiences — and what your customers experience — depending on which model your facility runs today.

Without Digital Capacity Planning
Bay Visibility Horizon
5–7 days, manually maintained spreadsheet
Labor Allocation Accuracy
Estimated — conflicts found when work begins
Scope Change Response
Manual replanning — 4–8 hours per event
AOG Acceptance Decision
Based on gut feel — impact unknown until collision
Utilization Reporting
Monthly — too late to act on within the period
TAT Quote Confidence
Low — commercial team adds buffer to cover risk
With Oxmaint Capacity Module
Bay Visibility Horizon
Rolling 90-day live view, updated in real time
Labor Allocation Accuracy
Man-hour demand vs. supply — conflict flagged instantly
Scope Change Response
Automatic schedule recalculation — under 60 seconds
AOG Acceptance Decision
Impact simulation before commitment — data-backed yes/no
Utilization Reporting
Live dashboard — actionable within the same shift
TAT Quote Confidence
High — commercial team quotes from confirmed slot data

Ready to close the gap? Start a free trial or book a demo with our MRO capacity planning team.

How Oxmaint Solves It

Oxmaint Capacity Module: 8 Features That Transform Hangar Planning

Every feature below connects directly to a real planning constraint your team faces today. No feature bloat — each one solves a specific problem that costs MROs measurable revenue.

01
Live Bay Occupancy Dashboard
Real-time view of every bay — current aircraft, estimated release, tooling status, and dock configuration. No phone calls, no spreadsheet refreshes. Planners see the exact moment a bay becomes available.
02
Man-Hour Demand vs. Supply Engine
Load planned man-hours for every active work package against available technician hours by rating, shift, and skill. Surface overloaded periods before they become delays. Rebalance with drag-and-drop workload shifting.
03
AOG Impact Simulation
Before accepting an unplanned entry, run a one-click simulation showing which scheduled work packages are displaced, by how many hours, and which customers are affected. Accept or redirect with full information — not instinct.
04
Scope Change Auto-Recalculation
When a check opens additional findings, the system automatically recalculates the impact on bay release time, downstream slot availability, and labor demand — giving planners actionable options within 60 seconds of scope discovery.
05
Rolling 90-Day Capacity Forecast
Forward-looking slot availability across every bay, updated as work orders progress. Commercial teams can quote TAT with confirmed slot data — not estimated buffers. Close more contracts by promising what you can actually deliver.
06
Tooling Contention Detection
Tag shared tooling assets to work packages. System flags conflicts when two concurrent packages require the same fixture, test bench, or GSE — before both teams show up on the floor expecting the equipment.
07
Utilization Analytics by Bay, Team, and Period
Live utilization rate by bay, shift, technician team, and aircraft type. Identify chronic underutilization patterns, peak bottlenecks, and shift-level imbalances. Move from 61% average to 85%+ without adding a single bay.
08
Multi-Site Portfolio View
For MRO groups operating across multiple facilities, consolidate bay availability, labor capacity, and workload across all sites. Route incoming aircraft to the optimal location based on real-time capacity data — not historical assumption.
The Utilization Gap

Where 26% More Throughput Comes From

The difference between a 61% and 87% utilized hangar is not more aircraft — it is eliminating the invisible waste built into every unoptimized schedule. Here is where that waste hides.

38%

Schedule Buffer Padding
Time added by planners to cover unknown risk — eliminated when real data replaces guesswork
28%

Labor Idle Time at Bay
Technicians waiting for parts, tooling, or sign-off — reduced by pre-positioning triggered by work order milestones
22%

Unplanned Bay Turns
Aircraft repositioned mid-check due to scheduling conflicts — eliminated by contention detection before entry
12%

Scope Creep Overrun
Additional findings extending bay occupancy beyond plan — mitigated by automatic recalculation and slot adjustment
Measured Results

What Optimized Capacity Delivers: Results by the Numbers

87%
Peak Bay Utilization
MROs using Oxmaint's capacity module achieve 87% bay utilization versus 61% industry average for facilities using manual planning methods.
26%
Throughput Improvement
Average throughput increase in year one of implementation — driven by eliminating schedule padding and invisible idle time from the bay floor.
60 sec
Scope Change Recalculation
What took 4–8 hours of manual replanning now produces actionable schedule adjustments in under 60 seconds from the moment additional findings are logged.
4.2x
Year-One ROI
Return on platform investment across bay revenue recovery, reduced idle labor costs, and improved TAT compliance that drives repeat customer commitment.
FAQ

Frequently Asked Questions: Hangar Capacity Planning

01 How does Oxmaint integrate with our existing work order and MRO management systems?

Oxmaint's capacity module connects directly to your existing work order data — whether in Oxmaint or imported from legacy MRO systems. Work order milestones, man-hour estimates, and parts requirements feed the capacity engine automatically, so your planning dashboard stays current without manual data entry. For facilities with existing MRO software, Oxmaint provides structured import tools and API connectivity to avoid duplicate data management. Planners work from one live view rather than reconciling multiple systems before every scheduling decision.

API connectivity Work order sync No duplicate entry
02 How long does it take to get meaningful capacity data after implementation?

Most MRO facilities see a live bay dashboard within their first week of implementation. Loading your bay configuration, aircraft type compatibility matrix, and active work packages takes 2–4 days with standard onboarding support. Labor capacity data — technician headcount, ratings, and shift structure — typically populates within the same window. Forecasting becomes meaningful by the end of week two, when the system has accumulated enough real-time work order progression data to generate accurate completion estimates. Unlike enterprise software deployments that take 6–12 months, Oxmaint is built for operational teams who need value in days, not quarters.

Live in 1 week Forecasting by week 2 No lengthy onboarding
03 Can the system handle mixed-fleet MROs working on multiple aircraft types simultaneously?

Yes — mixed fleet is one of the primary use cases Oxmaint's capacity module was built to handle. Each bay carries a configuration profile that defines compatible aircraft types by dimensions, door clearance, and dock setup. The system will not allow scheduling of an aircraft type incompatible with the assigned bay, eliminating a common source of planning errors at multi-type MROs. Labor demand is filtered by aircraft type-specific rating requirements, so the system only counts technicians whose certifications cover the scheduled aircraft — preventing the allocation errors that surface when a check begins and the licensed crew is committed elsewhere.

Multi-type bay config Rating-filtered labor Type compatibility checks
04 What reporting does Oxmaint provide for MRO directors and ownership groups?

Oxmaint generates portfolio-level capacity reports covering bay utilization rates, throughput per period, TAT compliance by customer and aircraft type, labor efficiency ratios, and forecast accuracy over rolling periods. For MRO directors, the operations dashboard provides real-time visibility into current status across all bays and pending workload. For ownership groups and investors, exportable reports track revenue-generating utilization versus idle time, enabling informed capital planning decisions about facility expansion or equipment investment. All reports are generated on demand — no analyst time required to compile them before management reviews.

Utilization analytics TAT compliance tracking Investor-grade export
Your Next 26% Throughput Increase Is Already in Your Hangar

Stop Leaving Bay Revenue on the Floor.

Oxmaint gives MRO directors and maintenance planners the live bay dashboard, labor demand engine, AOG simulation, and rolling 90-day forecast to run a hangar at 87% utilization — not 61%. No lengthy implementation. No consultant fees. Real capacity data from day one, across every bay, every shift, and every aircraft type in your facility.

Share This Story, Choose Your Platform!