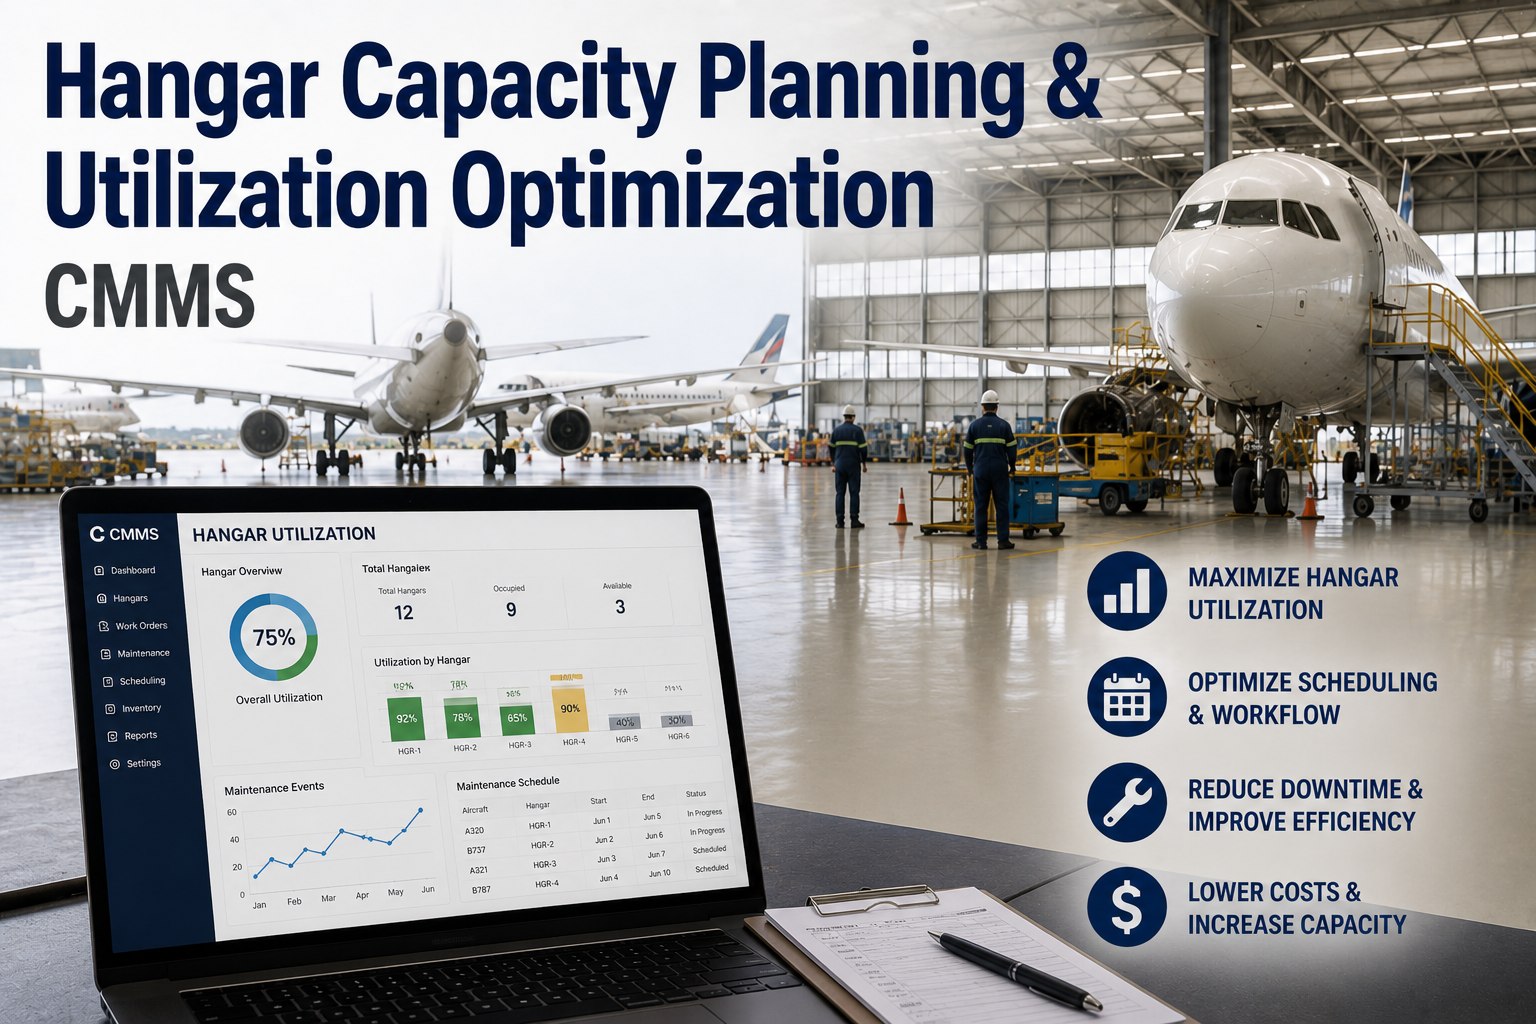
Hangar capacity is the most expensive square meter in any MRO operation — often 3–5× the cost per footprint of a standard workshop — yet most facilities quietly run at 60–75% utilization when 85% or more is structurally achievable. The gap is rarely a lack of bays; it is a lack of slot discipline, resource-constrained scheduling, and real-time visibility across work packages, tooling, and skilled labor. A CMMS built for aviation maintenance closes that gap by treating every hangar bay as a bookable, capacity-metered asset rather than a static location. If you want to turn dormant hangar hours into recovered margin without pouring concrete, Start Free Trial and see where your bays are actually leaking time.
Is your hangar quietly burning $4.2M a year in idle bay-time?
A 4-bay widebody MRO running at 68% utilization loses roughly 11,700 billable bay-hours every year. At $360/hr, that is direct margin evaporating — recoverable through slot logic, bay assignment rules, and resource-constrained scheduling inside a purpose-built CMMS.
Why most MROs plateau at 68% — and what 85% looks like
Hangar utilization is not one number; it is the product of slot occupancy, bay-type fit, and resource availability. Most planning teams optimize only the first and lose 15–20 points to the other two.
A bay with the aircraft parked but no skilled crew or tooling assigned scores zero on Resource Fit — yet most spreadsheets count it as 100% occupied.
Add one C-check slot recovered per quarter and the figure compounds past $3.8M before tooling savings.
From whiteboard slots to resource-constrained bay assignment
A CMMS-grade hangar planner does what Gantt charts cannot: it refuses to book a slot when the crew, tooling, ground equipment, and parts are not simultaneously available.
Work package decomposition
Each visit is broken into task blocks with skill codes, tooling BOM, and estimated duration. The CMMS tags bay-type requirements (widebody/narrowbody, tail height, door clearance) before any slot is offered.
Constraint-matched slot search
The engine scans the bay calendar for windows where aircraft type fits, ground time is uninterrupted, and no adjacent bay blocks the tail or swing-span. Conflicts surface in seconds, not the next morning's standup.
Crew and tooling reservation
Once a slot is held, the CMMS reserves certified technicians, NDT equipment, docking sets, and consumables against that bay — preventing double-commitments that cause the silent 20% utilization drain.
Work package phase optimization
Phases are sequenced to compress critical-path downtime: structural work fronts-loaded while parts logistics complete, cabin refurbishment slotted into the tail-end window, NDT queued for overnight cure cycles.
Disruption recovery in minutes
When a parts delay or finding extends a visit, the CMMS re-flows downstream slots, flags at-risk customers, and re-balances crews across bays — keeping overall utilization stable even when individual visits slip.
The five levers that move utilization from 68% to 85%
Bay-type right-sizing
Stop parking narrowbodies in widebody-capable bays. The CMMS enforces type-fit rules so each aircraft lands in the smallest bay that satisfies clearance and door-swing requirements.
Changeover compression
Docking teardown to next-aircraft tow-in averages 14 hours. A CMMS checklist with parallel task assignment and pre-staged ground equipment routinely cuts that to 9–10 hours.
Night-window activation
Structural inspections and NDT cure cycles scheduled overnight convert dormant dark-hours into billable bay-time without adding shifts or footprint.
Resource-fit enforcement
No slot is confirmed until crew certifications, tooling availability, and parts are locked. Eliminates the "parked but idle" hours that inflate perceived utilization.
Visit-phase overlap
Sequencing log-card work, structural repair, and cabin refurbishment in overlapping waves — instead of strict serial phases — reclaims 2–3 days per C-check.
What changes when hangar planning leaves the spreadsheet
| Planning dimension | Spreadsheet / whiteboard | CMMS-driven hangar planner |
|---|---|---|
| Slot visibility | Daily, often stale by mid-morning | Live, down to the minute, multi-bay |
| Resource fit check | Manual; relies on planner memory | Auto-validated against crew certs & tooling |
| Conflict detection | Discovered at daily standup | Flagged at booking, before commitment |
| Disruption re-flow | Hours of re-planning; cascading slips | Re-sequenced in minutes; customers auto-notified |
| Utilization reporting | Monthly, aggregated, retrospective | Real-time dashboard; bay, crew, and aircraft-level |
| Margin impact | Hidden; discovered at quarter-close | Visible daily; $-per-bay-hour tracked live |
The four KPIs a hangar CMMS should surface every morning
Effective bay utilization
Billable hours divided by available hours, weighted by resource-fit factor. The headline number — anything under 75% is a margin leak.
Bay changeover time
Aircraft-out to next-aircraft-ready. Leading indicator of docking discipline and ground-equipment staging; every hour saved is an hour of recovered bay-time.
Resource-fit compliance
Share of booked slots where crew, tooling, and parts were confirmed before aircraft arrival. Low scores predict slip events 48–72 hours out.
Recovered bay-hour value
Loaded revenue per billable bay-hour. Multiply by recovered hours to translate utilization gains into the language finance responds to.
"We moved from a Gantt-on-a-wall to CMMS-driven slot booking and recovered 1,940 billable bay-hours in the first six months — without adding a single bay. That paid for the system eleven times over."
Every week at 68% utilization is billable margin you never get back.
Deploy a hangar capacity planner that turns slot logic, bay assignment, and resource-constrained scheduling into recovered revenue — typically live in under 30 days.
Hangar capacity planning & CMMS utilization — answered
What is the realistic utilization ceiling for an MRO hangar?
Most well-run facilities can sustain 85–88% effective utilization, with elite operators touching 91% during peak quarters. The last 10–12 points require disciplined changeover compression, night-window activation, and resource-fit enforcement — not additional footprint. Pushing past 92% is generally counterproductive, as it removes the slack needed for disruption recovery and unplanned findings.
How does a CMMS differ from a Gantt chart for hangar scheduling?
A Gantt chart shows time; a CMMS validates constraints. It refuses to confirm a slot unless the bay type, crew certifications, tooling, ground equipment, and parts are all available in the same window. It also re-flows downstream bookings automatically when a visit slips, whereas a Gantt requires manual rework. You can see the difference in a live environment — Book a Demo and we will walk through a 4-bay scenario.
How long does it take to deploy a hangar capacity CMMS?
For a 3–6 bay facility with clean aircraft-type data and existing work-package templates, typical go-live is 21–35 days. The longest phase is usually loading bay-type constraints (door clearance, tail height, swing-span) and mapping crew certifications. Once that foundation is in place, slot booking, resource locking, and utilization dashboards activate quickly.
Can a CMMS help with audit and regulatory traceability for hangar slots?
Yes. Every slot booking, changeover, resource assignment, and re-plan event is timestamped and attributable. For EASA Part-145 and FAA Part 145 audits, this produces a defensible record of which bay held which aircraft, which crew was assigned, and when each phase opened and closed — replacing manual bay logs that auditors routinely challenge.
What is the payback period for a hangar utilization CMMS?
Most mid-sized MROs recover the annual subscription cost within the first 8–12 weeks of live use, purely through recovered bay-hours. A 4-bay widebody facility moving from 68% to 85% utilization typically captures $2–4M in annualized margin — orders of magnitude above the software investment. Start a Start Free Trial to model your own numbers against your current bay calendar.
Turn 68% utilization into 85% — without pouring concrete.
Deploy CMMS-driven slot booking, resource-constrained scheduling, and live utilization tracking. Most facilities are live in under 30 days and see recovered bay-hours within the first billing cycle.
Free 14-day trial · No credit card