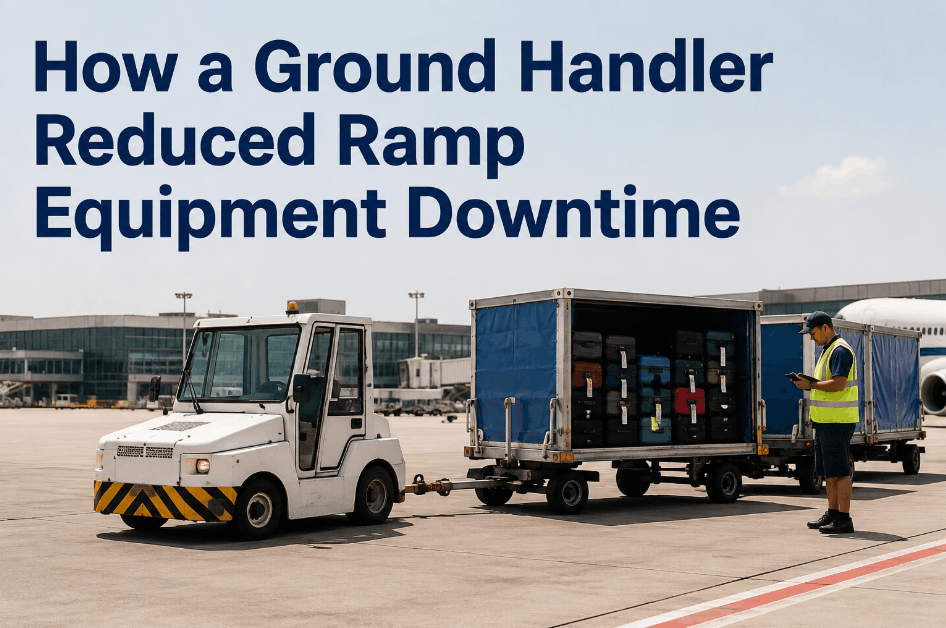
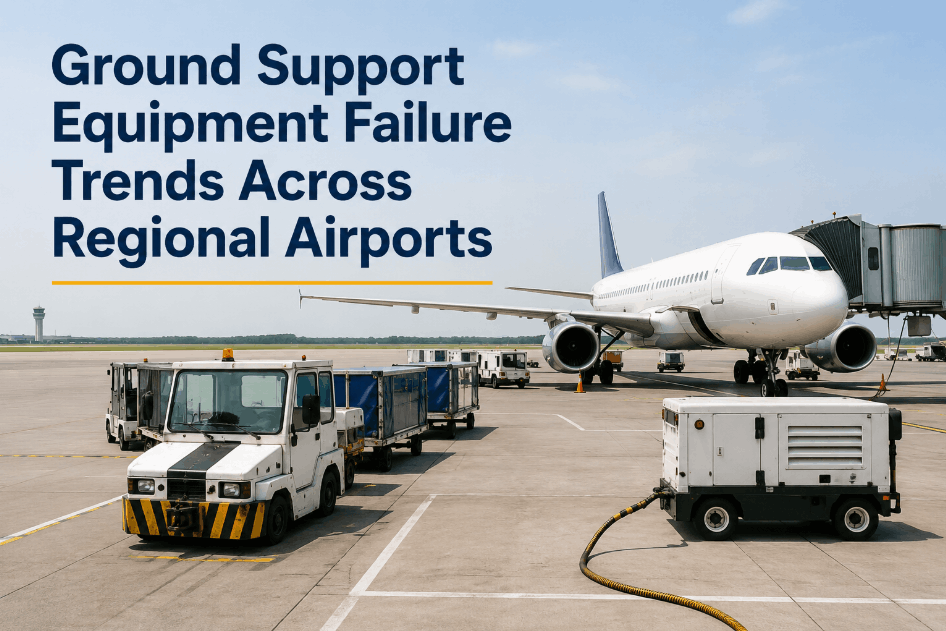
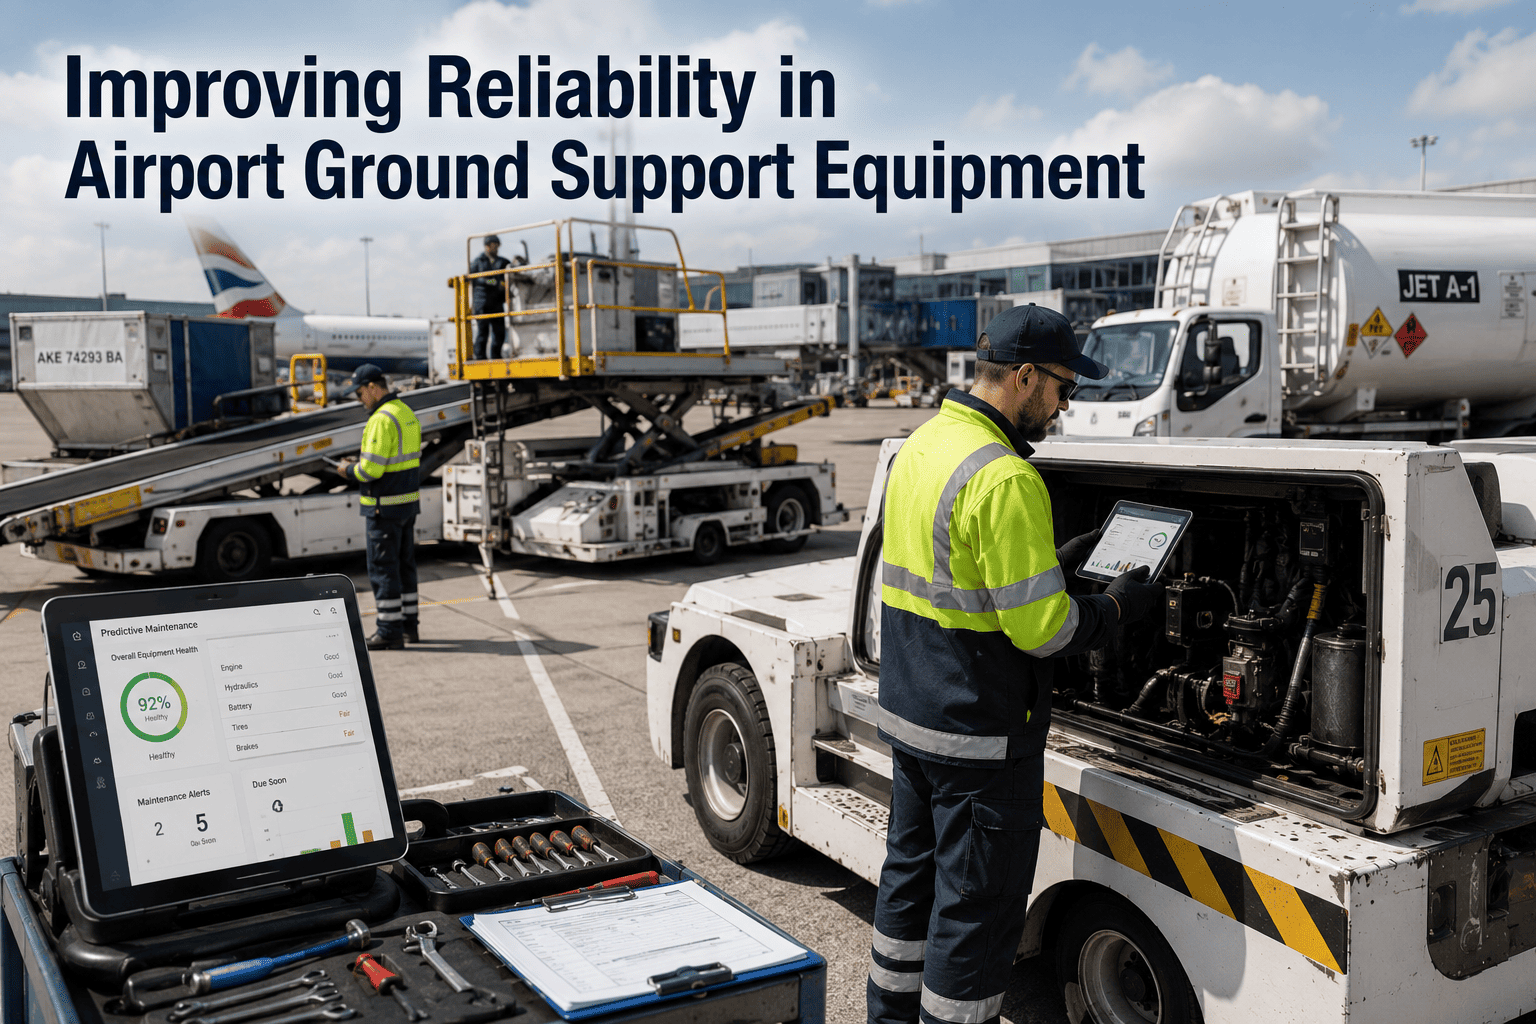
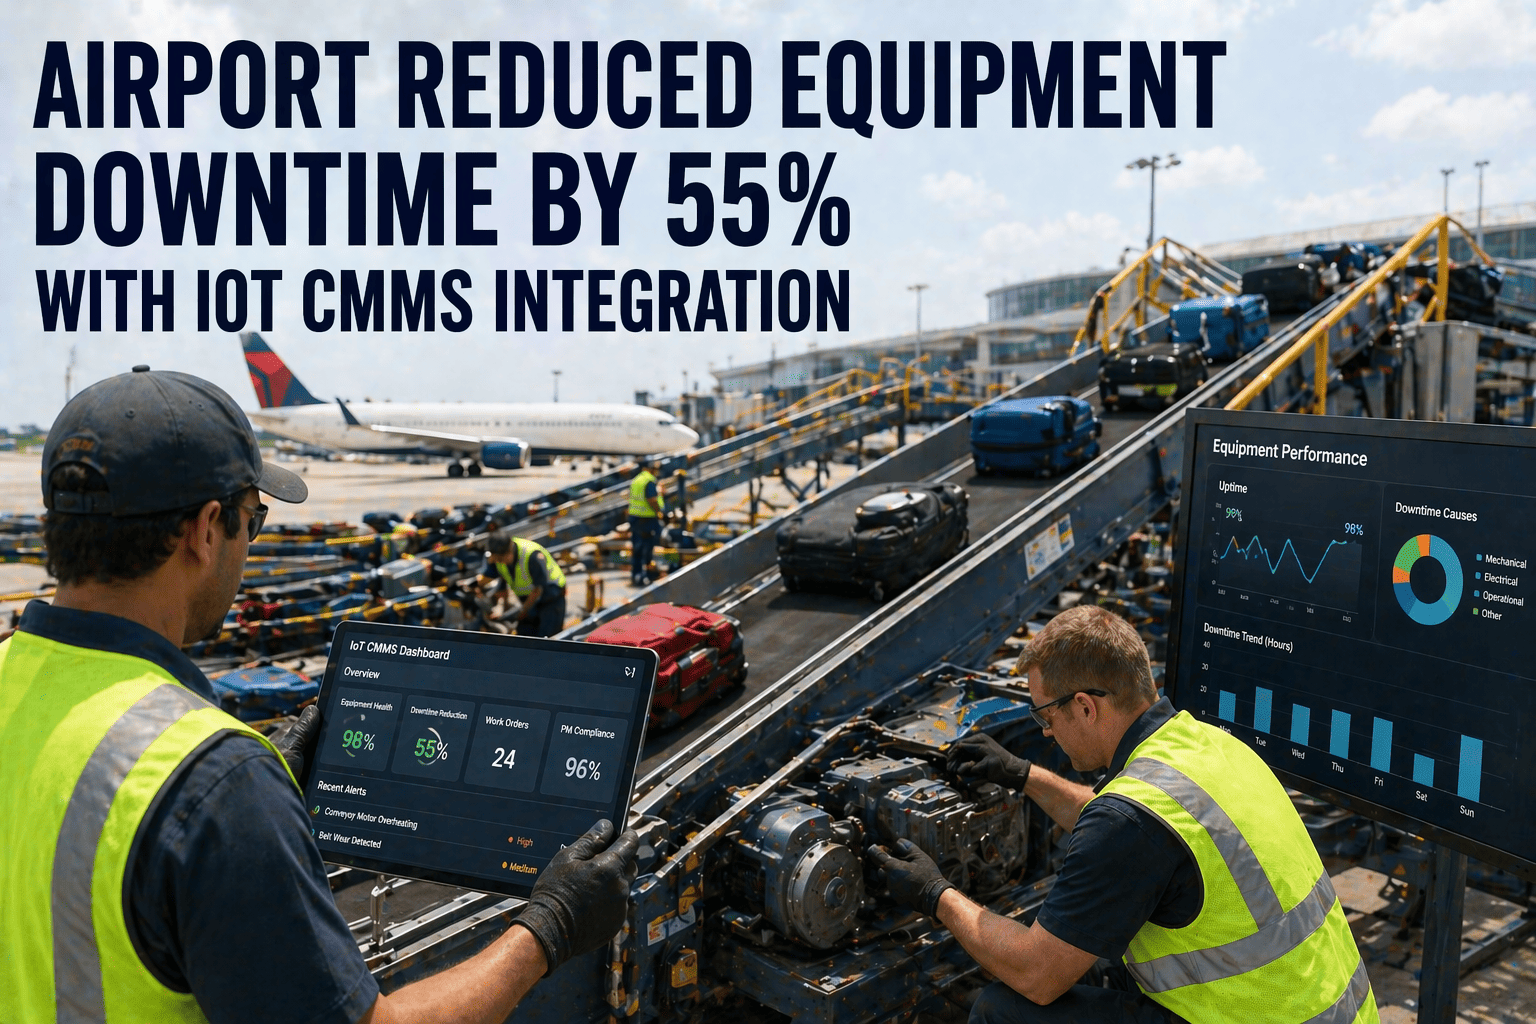
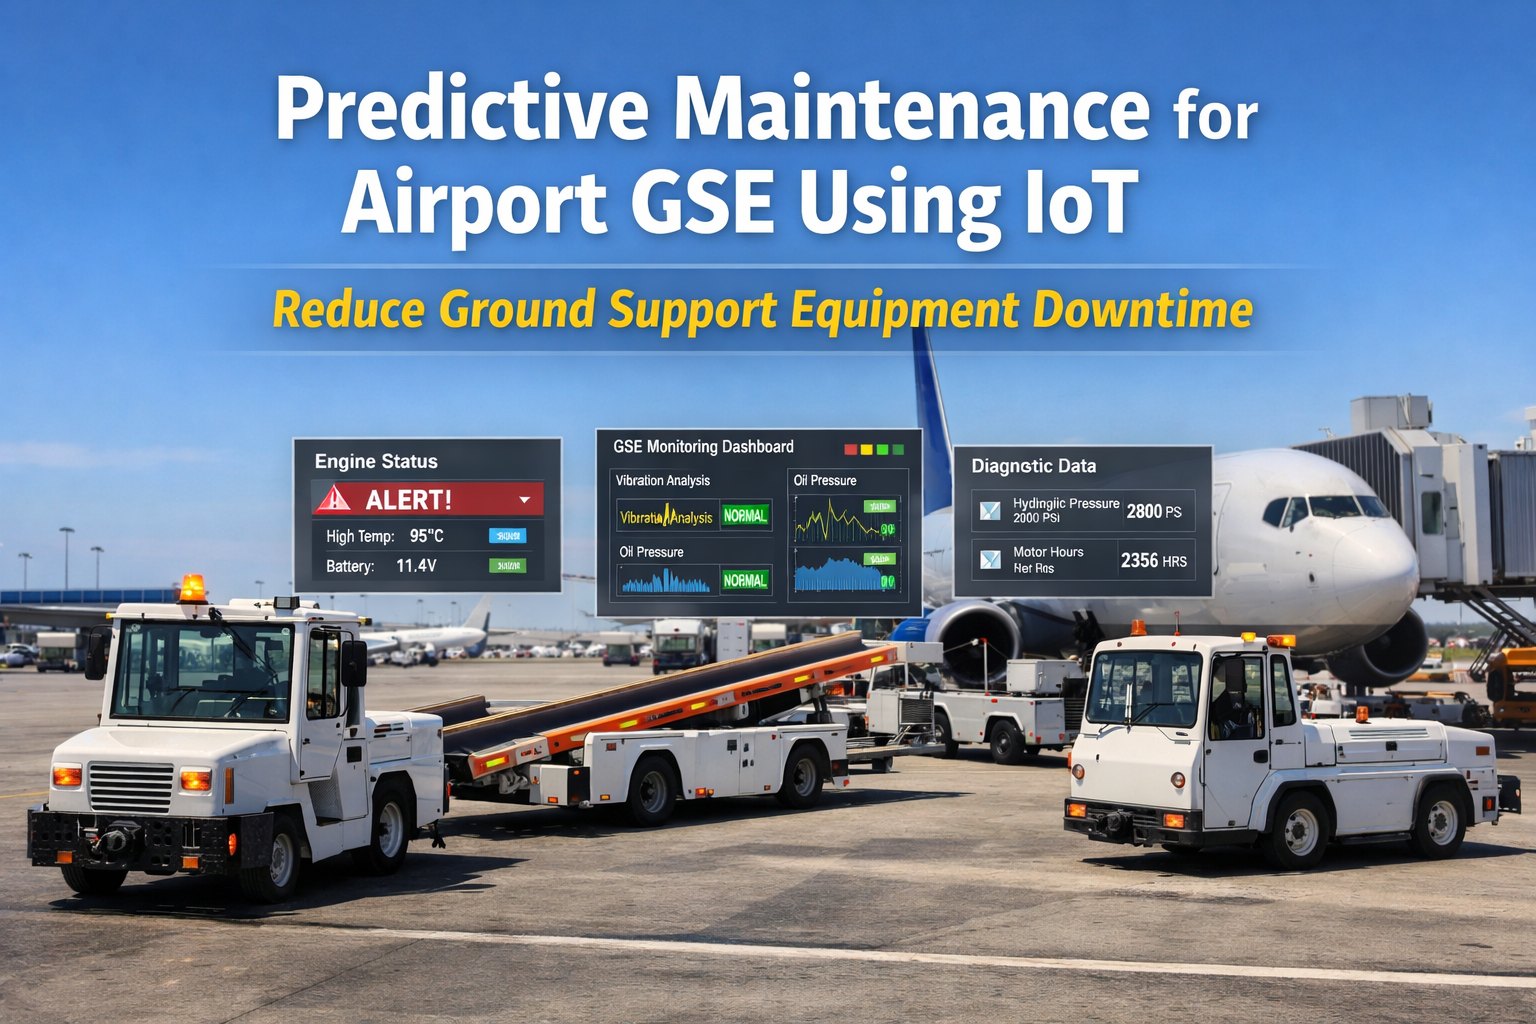
A ground handling company operating a 140-unit ramp equipment fleet — baggage tractors, belt loaders, pushback tugs, and ground power units — was losing turnaround time to equipment that kept breaking down in the same way, week after week. Outage logging happened on paper after the fact, if at all, leaving no pattern to act on. Sign Up Free to see how structured maintenance intervals and root cause tracking change ramp readiness — after deploying Oxmaint's preventive maintenance and analytics platform, the ground handler cut unplanned outage minutes by 60%, reduced average recovery time from 5.4 to 2.7 hours, and lifted peak-bank serviceability from 81% to 96% within 100 days.
Cut Ramp Equipment Downtime. Stop Recurring Failures. Lift Serviceability in 100 Days.
Oxmaint connects outage logging, maintenance intervals, and root cause tracking for ramp GSE fleets — replacing reactive repairs with data-driven recovery and risk ranking.
01 / The Operation
Ramp Ground Support Equipment. Reactive Repairs. No Outage Pattern Tracking.
Operation Type
Independent ground handling company servicing multiple airline customers at a single-airport ramp, operating baggage tractors, belt loaders, pushback tugs, and ground power units across two daily peak banks.
Fleet Scale
140 ground support equipment units maintained by a 14-person ramp maintenance crew, supporting turnaround schedules with limited slack between aircraft arrivals.
Downtime Baseline
3,400 unplanned outage minutes per month across the fleet. Average mean time to repair of 5.4 hours and mean time between failures of 210 hours fleet-wide.
Failure Pattern Baseline
38% of repaired faults recurred within 30 days. Peak-bank serviceability — the share of fleet available during the two daily peak periods — averaged 81%, with a standing backlog of 64 deferred repair items.
Prior System
Paper outage logs completed after the fact, no fixed maintenance interval schedule, and no structured root cause process — repairs addressed the immediate symptom without tracking whether the same defect kept returning.
Annual Overhead Exposure
Combined cost exposure from turnaround delay penalties, expedited repair premiums, and repeat-failure labor estimated at $680,000 annually against a fleet with no structured maintenance interval discipline.
02 / The Challenge
Without Outage Logging and Root Cause Tracking, the Same GSE Failures Keep Coming Back
Ramp ground support equipment runs in punishing conditions with no tolerance for downtime during a peak bank. When outage logging happens after the fact instead of at the point of failure, maintenance teams lose the data needed to tell a one-off failure from a recurring defect — and recovery speed suffers because every repair starts from zero. Book a Demo to see how Oxmaint's outage tracking and root cause tools close this gap for ramp operations.
3,400
Outage minutes/month
Thirty-four hundred unplanned outage minutes accumulated across the fleet every month, much of it during peak banks when a downed tug or loader had the highest cost to turnaround schedules.
5.4 hrs
Average MTTR
Five and a half hours of average recovery time per failure, inflated by technicians starting each repair without access to the unit's prior fault history or any pattern of recurring issues.
38%
Failure recurrence rate
More than one in three repaired faults reappeared within 30 days — a clear signal of unresolved root causes that went undetected without structured defect tracking across repair events.
81%
Peak-bank serviceability
Nearly one in five fleet units was unavailable during the two daily peak banks when ramp turnaround pressure was highest, with no risk ranking to flag which units were most likely to fail next.
"We'd fix the same tug three times in a month and never know it until someone happened to remember. There was no record connecting one breakdown to the last one."
03 / The Solution
Oxmaint CMMS: Structured Maintenance Intervals, Outage Logging, and Root Cause Tracking for Ramp GSE
After reviewing maintenance platforms against the ramp's downtime and recovery speed requirements, the ground handler's operations director selected Oxmaint for its preventive maintenance scheduling, work order tracking, and analytics tools suited to a fast-cycling ground equipment fleet. Sign Up Free and log your first GSE outage with a connected repair history today.
OUTAGE LOGGING
Every GSE outage logged digitally at the point of failure through the mobile app, capturing unit ID, symptom, and downtime start and end time — building the outage minute and MTTR baseline the ramp had never had.
MAINTENANCE INTERVALS
Preventive maintenance schedules configured per equipment type based on runtime hours rather than calendar guesswork, shifting high-failure units from reactive repair to interval-based servicing.
ROOT CAUSE TRACKING
Repair records linked to full unit history, flagging when a closed work order's symptom matched a fault closed within the prior 30 days — turning recurring failures into a visible pattern instead of a surprise.
RISK RANKING
Fleet units ranked by failure frequency, outage minutes, and recurrence history, letting the maintenance crew prioritize the units most likely to fail next during the following peak bank.
RECOVERY SPEED ANALYTICS
MTTR and MTBF tracked per equipment category through Oxmaint's analytics and reporting tools, giving the maintenance crew a measurable target for recovery speed instead of an informal sense of "fast enough."
04 / Implementation
Outage Logging Live in 14 Days. Maintenance Intervals Configured by Day 45. Risk Ranking Live by Day 100.
The rollout prioritized capturing accurate outage data first, since every later improvement depended on having a reliable failure record. Book a Demo to see how this sequencing applies to your own ramp fleet.
Days 1–14
Fleet Registry Build and Mobile Outage Logging Activation
All 140 GSE units catalogued in Oxmaint with unit ID, equipment type, and runtime hour tracking. Mobile outage logging activated across the maintenance crew, capturing every failure from day one of rollout.
Days 15–45
Maintenance Interval Configuration by Equipment Type
Runtime-hour-based preventive maintenance intervals configured for tugs, loaders, and ground power units using the first 30 days of outage data as a baseline. Backlog of 64 deferred repairs triaged by risk.
Days 46–75
Root Cause Tracking and Recurrence Flagging
Repair records cross-referenced for recurring symptoms within 30-day windows, surfacing units with unresolved root causes. Recurrence rate began declining as technicians addressed flagged units differently.
Days 76–100
Risk Ranking Live and Peak-Bank Serviceability Stabilized
Fleet-wide risk ranking deployed to the maintenance crew ahead of each peak bank, prioritizing inspection and servicing on the highest-risk units. Serviceability during peak banks reached 96% by day 100.
05 / Results
100 Days to Structured Maintenance Intervals. Sustained Downtime Reduction Across the Ramp Fleet.
Connecting outage logging to maintenance intervals and root cause tracking delivered measurable downtime reduction within the first quarter of rollout. Sign Up Free to start tracking your own fleet's recurrence rate, or Book a Demo to see how these results map to your ramp operation.
| Metric |
Before Oxmaint |
After Oxmaint |
Change |
| Unplanned outage minutes |
3,400/month |
1,360/month |
−60% outage minutes |
| Mean time to repair (MTTR) |
5.4 hours |
2.7 hours |
−50% recovery time |
| Mean time between failures (MTBF) |
210 hours |
305 hours |
+45% MTBF |
| Failure recurrence rate (within 30 days) |
38% |
14% |
−63% recurrence |
| Peak-bank serviceability |
81% |
96% |
+15 points |
| Deferred repair backlog |
64 units |
19 units |
−70% backlog |
| Units on interval-based maintenance |
0% |
92% of fleet |
Structured intervals |
| Outages logged at point of failure |
Inconsistent paper logs |
100% mobile logging |
Full outage capture |
| Annual downtime and repair cost exposure |
$680,000/year |
Estimated $250,000/year |
−63% cost exposure |
+15pt
Peak serviceability
$430K
Annual savings recovered
"Risk ranking changed how we plan a peak bank. We now know which three tugs are most likely to fail before the push, instead of finding out when one dies on the ramp."
06 / Key Business Impact
What Structured Outage Tracking Protected Beyond Downtime Minutes
The serviceability gains traced back to data the ramp had never systematically captured before. Book a Demo to see how these same patterns apply to your own ground support fleet.
01
The 38% recurrence rate was not a repair quality problem — it was a memory problem. Technicians had no way to know a unit's last three fault codes when starting a new repair, so the same root cause kept getting treated as a new issue each time.
02
High MTTR was driven less by repair difficulty than by missing context. Once outage logs carried prior fault history, technicians could rule out previously addressed causes immediately, cutting diagnostic time before any wrench turned.
03
Risk ranking turned peak-bank planning from reactive to proactive. Knowing which units carried the highest failure probability let the maintenance crew pre-position attention before a peak bank instead of responding after a unit went down.
04
Interval-based maintenance reduced reliance on reactive repair for the highest-failure equipment categories, shifting maintenance labor toward scheduled servicing where it prevents downtime instead of toward emergency fixes after the fact.
See How Structured Outage Tracking Can Cut Your Ramp Equipment Downtime
Oxmaint's CMMS connects outage logging, maintenance intervals, and root cause tracking — delivering measurable MTTR and serviceability gains for ground support fleets within one quarter.
07 / FAQ
Frequently Asked Questions
How does a CMMS reduce ramp ground support equipment downtime?
A CMMS logs every outage at the point of failure and links repairs to runtime-hour maintenance intervals, replacing reactive fixes with structured servicing that lowers outage minutes and unplanned breakdowns.
How does Oxmaint help reduce failure recurrence in GSE fleets?
Oxmaint flags repair records where a closed fault matches a symptom resolved within the prior 30 days, surfacing recurring root causes so technicians can address the underlying issue instead of the immediate symptom.
Can Oxmaint track MTTR and MTBF for ramp equipment?
Yes. Oxmaint's analytics and reporting tools calculate mean time to repair and mean time between failures per equipment category, giving maintenance teams a measurable recovery speed benchmark.
How does Oxmaint support risk ranking for ground support equipment?
Oxmaint ranks fleet units by failure frequency, outage minutes, and recurrence history, helping maintenance crews prioritize the highest-risk units ahead of peak operating periods.
How quickly can a ground handler deploy maintenance interval scheduling?
Facilities with an existing equipment list can have mobile outage logging live within two weeks. Runtime-hour-based maintenance intervals are typically configured within 30 to 45 days once outage data accumulates.
What ROI can ground handlers expect from structured outage logging?
Ramp operations with high recurrence rates and unstructured repair processes typically see measurable downtime and cost reductions within one quarter. This ground handler estimated $430,000 in annualized savings within 100 days.
Does Oxmaint support root cause analysis for recurring GSE defects?
Yes. Oxmaint links repair history per unit so technicians and maintenance leaders can review prior fault patterns and identify root causes that a single repair event would not reveal on its own.
−60% Outage Minutes. −50% MTTR. Risk Ranking Live in 100 Days.
140 GSE units. One ramp. One connected CMMS for downtime reduction. See what Oxmaint delivers for your fleet.