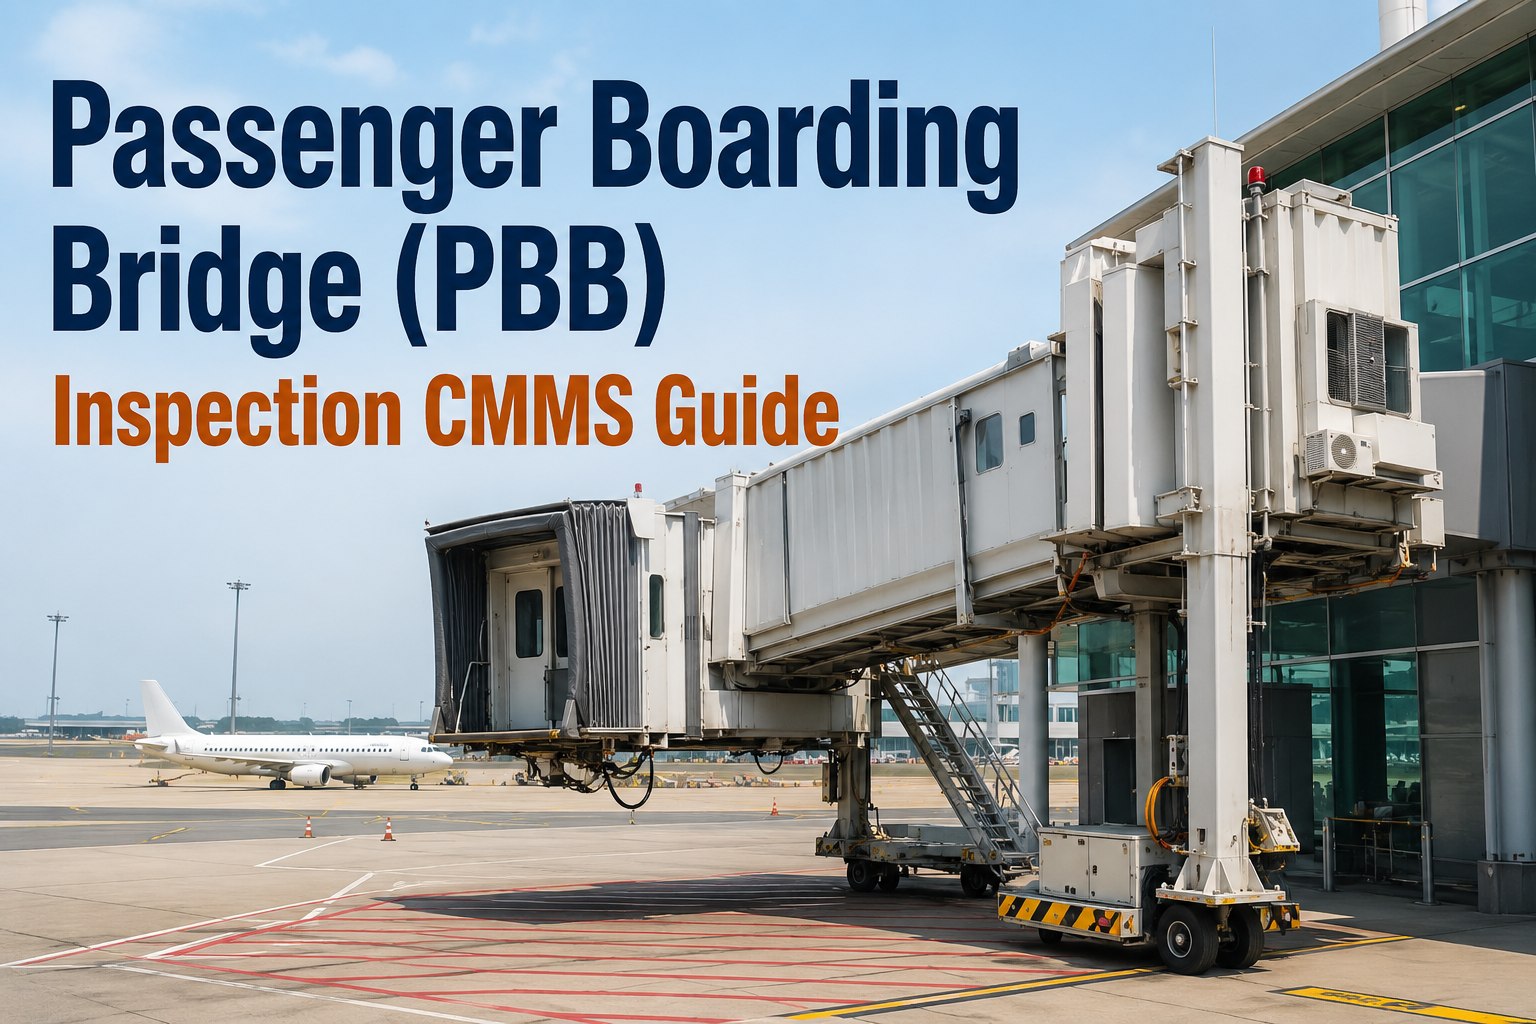
Jet bridge downtime rarely announces itself with a dramatic failure — it shows up as a slightly slower docking cycle, a delayed boarding handoff, or a gate that quietly falls behind schedule. Gate operations teams using Sign Up Free on OxMaint can track bridge health, fault history, and docking cycle times by gate — turning jet bridge utilization into a measurable analytics practice instead of a reactive maintenance call after boarding has already slipped.
Why Jet Bridge Downtime Quietly Erodes Gate Throughput
Most terminals track total bridge outages but rarely break utilization down by docking cycle, fault frequency, or maintenance response time per unit. That gap is where small mechanical drift turns into a boarding delay. Book a Demo to see how OxMaint maps bridge health against gate schedules to expose risk before it reaches the boarding door.
Five Dimensions of Jet Bridge Utilization Analytics
A complete utilization analytics view connects docking cycle time, fault patterns, and maintenance response data into one gate-level picture. Sign Up Free to start logging bridge asset data in OxMaint and give every gate the same visibility.
Docking Cycle Time Tracking
The time between aircraft arrival and confirmed docking is a measurable signal of bridge health. Logging this cycle by unit reveals which bridges are drifting toward failure before a hard fault occurs.
Bridge Occupancy vs Gate Schedule
Comparing how long a bridge stays engaged against the scheduled gate turn shows where occupancy is running long, often the first sign of a mechanical or alignment issue developing.
Fault Frequency by Bridge Unit
Tracking fault history per bridge — not just per terminal — exposes which specific units are repeat offenders and need a different maintenance interval than the rest of the fleet.
Boarding Handoff Lag
The gap between bridge docking and boarding start is its own measurable interval. Isolating this lag separates bridge-caused delay from gate agent or jet bridge software handoff delay.
Maintenance Response Time Visibility
When a fault is reported, the time to dispatch and resolve it determines whether one gate goes dark for minutes or hours. Response time data by shift shows where crew coverage gaps exist.
Jet Bridge Utilization Benchmarks by Gate Type
Different gate configurations create distinct bridge usage and fault patterns. Comparing your gate activity against these benchmarks helps prioritize where monitoring will matter most. Book a Demo to explore how OxMaint tracks bridge utilization alongside maintenance records in one platform.
| Gate Type | Common Downtime Driver | Typical Docking Cycle | Boarding Risk Level | OxMaint Maintenance Lever |
|---|---|---|---|---|
| Narrow-Body Domestic Gates | High cycle count, wheel assembly wear | 2–4 min docking | Medium–High | Cycle-based predictive PM alerts |
| Wide-Body International Gates | Dual-bridge alignment, longer dwell | 4–7 min docking | High | Unit-level fault history tracking |
| Regional Commuter Gates | Lower priority maintenance scheduling | 2–3 min docking | Medium | Shared-resource response dashboards |
| High-Frequency Hub Gates | Back-to-back occupancy pressure | 3–5 min docking | High | Real-time occupancy vs schedule alerts |
| Remote and Contact-Mix Gates | Inconsistent usage patterns, drift unnoticed | 3–6 min docking | Medium | Fault frequency trend reporting |
How Jet Bridge Downtime Compounds Across Gate Operations
A single bridge fault rarely stays a single-gate problem. It pushes passengers to remote stands, strains gate agent coordination, and adds risk to the next connection. Book a Demo to see how OxMaint connects bridge asset data with gate schedules to flag compounding boarding risk early.
Building a Jet Bridge Utilization Analytics Practice with OxMaint
Putting bridge analytics into daily practice starts with treating each unit as a tracked asset. Sign Up Free to register your jet bridges in OxMaint and begin logging docking cycle data from day one.
Register Bridges as Tracked Assets
Log every jet bridge in OxMaint with QR-based identification, gate assignment, and maintenance history as the foundation for utilization tracking.
Configure Health and Fault Alerts
Set thresholds in OxMaint that flag abnormal docking cycle times or repeat fault codes, so maintenance can respond before the bridge goes fully out of service.
Monitor Docking Cycle Times by Unit
Use OxMaint's analytics dashboards to compare docking cycle times across bridges and flag units that are drifting from baseline performance.
Schedule Predictive PM Windows
Use cycle count and fault history to schedule preventive maintenance during low-traffic windows rather than waiting for an in-service failure.
Report Utilization Trends by Gate
Turn bridge data into recurring reports that gate operations and maintenance planning can review together to prioritize the next service interval.
Frequently Asked Questions: Jet Bridge Utilization Analytics
What is jet bridge utilization analytics?
It is the practice of tracking docking cycle times, fault frequency, and occupancy patterns per bridge unit to identify where mechanical wear or scheduling pressure is creating boarding risk.
How does bridge downtime affect overall gate throughput?
A single bridge outage forces remote-stand operations or boarding delay, which compresses the turnaround window for every flight scheduled at that gate afterward.
How does OxMaint support jet bridge maintenance tracking?
OxMaint logs bridge asset history, schedules preventive maintenance by cycle count, and reports fault frequency by unit so gate teams can see where attention is needed before a failure occurs.
What is the difference between docking cycle time and boarding handoff lag?
Docking cycle time measures how long it takes the bridge to connect to the aircraft. Boarding handoff lag measures the time between docking and boarding start, which can be affected by factors beyond the bridge itself.
How often should jet bridge utilization data be reviewed?
High-cycle hub gates benefit from daily review of fault alerts, with broader utilization trend reviews on a weekly basis. OxMaint automates this reporting cadence across all tracked bridges.