Airports consume as much energy as small cities — terminal HVAC alone accounts for 50–70% of building energy use, airfield lighting runs 24/7, and ground support equipment burns through diesel at industrial scale. Yet most airport facility teams still track energy performance in disconnected spreadsheets, making it nearly impossible to tie maintenance actions to measurable carbon reductions. With 590 airports now enrolled in ACI's Carbon Accreditation programme and net-zero 2050 deadlines approaching fast, the gap between sustainability ambition and operational execution has never been wider. Want to close that gap at your airport? Start a free trial for 30 days and see how CMMS-driven energy management works, or book a demo with our airport solutions team.
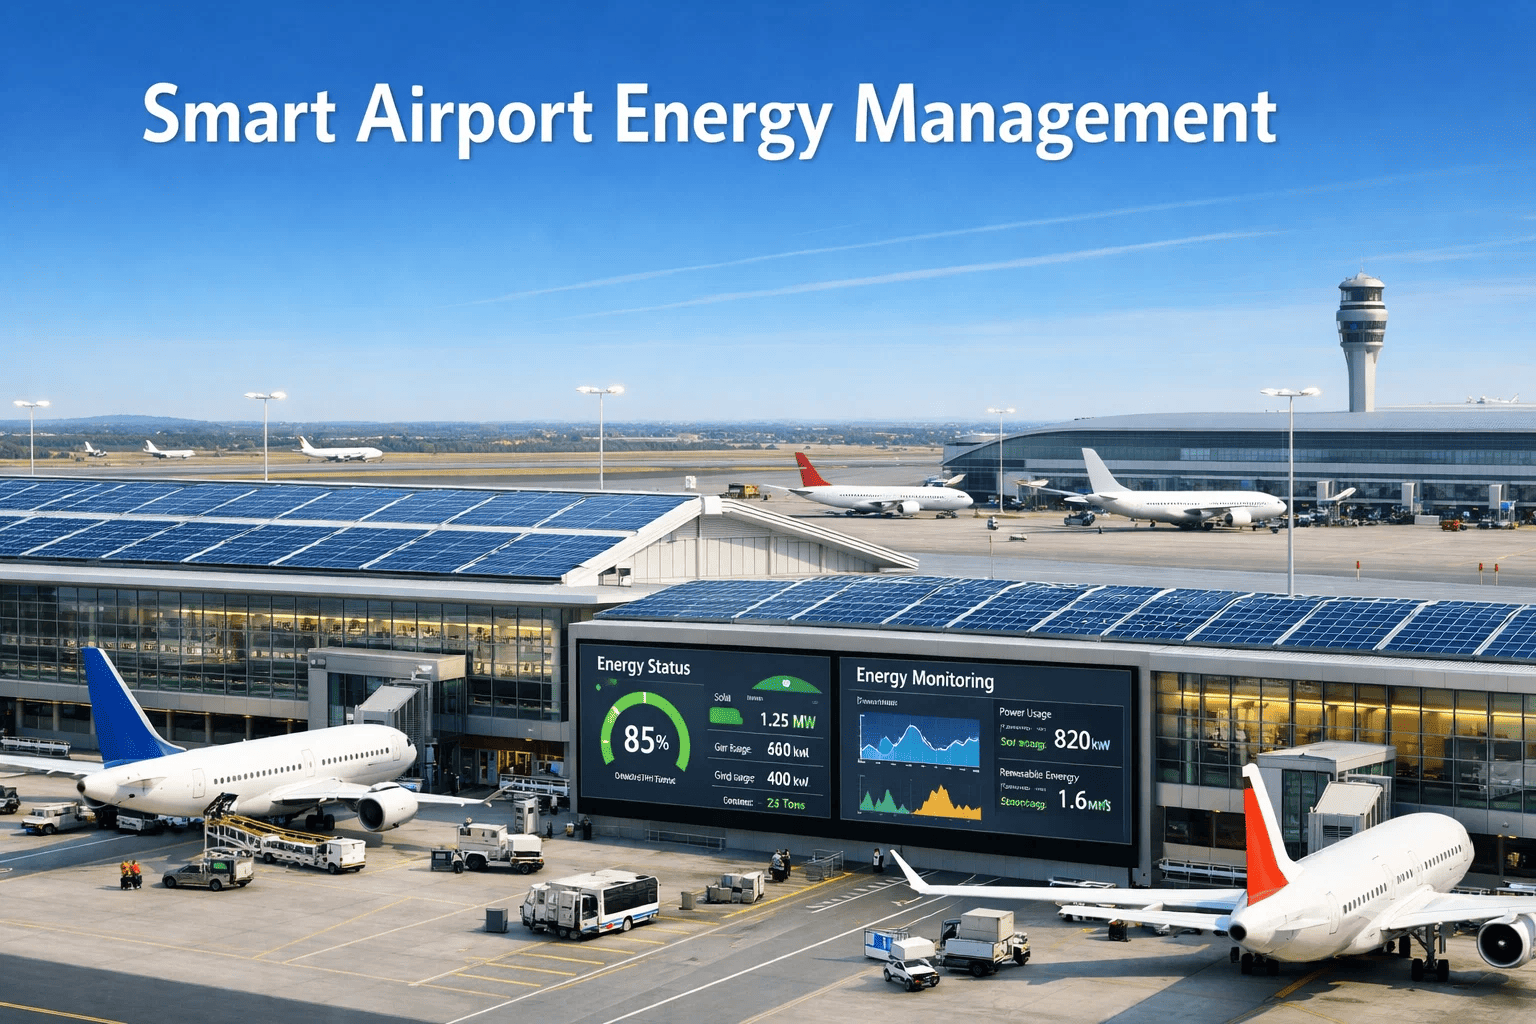
Smart Airport Energy Management: CMMS Strategies for Net-Zero Aviation Goals
HVAC optimization, airfield lighting control, renewable asset tracking, and Scope 1-2-3 emissions reporting — all connected to your maintenance workflow.
Where Airport Energy Actually Goes — and Why Maintenance Teams Hold the Key
An international airport operates like a small city with the energy demands to match. Terminal buildings — with their soaring atriums, 18-hour lighting cycles, and climate control for millions of passengers — are the largest single energy consumers. Airfield operations add runway and taxiway lighting, navigation aids, and ground support equipment. Behind the scenes, baggage handling systems, data centres, and water treatment plants compound the load. Research shows terminal buildings alone account for the majority of total airport electricity consumption, with HVAC, lighting, and ICT systems as the three largest energy draws.
The critical insight for facility managers: maintenance condition directly determines energy performance. A fouled chiller coil increases compressor energy draw by 15–25%. Misaligned dampers in air handling units waste conditioned air into unconditioned zones. Failed occupancy sensors leave terminal concourse lighting at full power through empty midnight hours. Every one of these is a maintenance failure that shows up as an energy cost — and a carbon emission. Connecting energy tracking to maintenance execution is no longer optional for airports pursuing ACI Carbon Accreditation. Ready to connect those dots? Start a free trial and map your airport energy assets in Oxmaint, or book a demo to see the energy-maintenance connection in action.
Source: Airport energy research literature and ACI benchmarking data. Percentages vary by climate zone and terminal design.
The 7-Level ACI Carbon Accreditation Path — and Where CMMS Fits at Every Stage
ACI's Airport Carbon Accreditation is the only globally endorsed carbon management standard for airports, now covering 53.6% of global passenger traffic. The programme's 7 levels guide airports from basic emissions mapping (Level 1) through absolute reductions (Level 4) to full net-zero operations (Level 5). At every level, the core requirement is the same: measure, manage, reduce, and verify. A CMMS that connects asset condition to energy consumption provides the operational backbone for all four actions.
Mapping and Reduction
Calculate Scope 1 and 2 carbon footprint. Set reduction targets. Track year-over-year improvement.
CMMS Role: Asset registry with energy consumption baseline per systemScope 3 and Optimization
Expand carbon footprint to include third-party emissions. Engage stakeholders. Offset remaining emissions where needed.
CMMS Role: Vendor energy compliance tracking, ground equipment PM schedulesTransformation
Achieve absolute emissions reductions across operations and business partners. Compensate residual emissions with verified offsets.
CMMS Role: Renewable asset lifecycle management, predictive maintenance on solar/EV systemsNet Zero Achieved
Maintain net-zero on Scope 1 and 2. Commit to net-zero Scope 3 by 2050. Only 21 airports globally have reached this level.
CMMS Role: Continuous verification, automated ESG reporting, audit-ready documentationMost airports today sit between Level 1 and Level 3 — meaning the biggest gains are still ahead. The airports that move fastest will be those that integrate energy data into daily maintenance decisions, not quarterly sustainability reports. Want to see what that integration looks like? Book a demo to see Oxmaint's energy-connected maintenance workflows.
Why Airport Energy Targets Fail — The 6 Operational Gaps That Block Net-Zero Progress
Disconnected Energy Data
BMS, SCADA, and utility meters feed separate dashboards. No link between a chiller PM failure and the energy spike it caused. Facility managers see the cost but cannot trace the cause.
Manual ESG Reporting
Sustainability teams spend 80+ hours per quarter compiling carbon data from spreadsheets. Numbers lag reality by months — far too slow for ACI verification cycles.
Reactive HVAC Maintenance
Terminal HVAC runs until failure. A single chiller outage during peak summer increases terminal temperature by 4–6 degrees in under 2 hours — passenger complaints spike and emergency repairs cost 3–5x preventive work.
No Renewable Asset Lifecycle View
Solar panels, EV chargers, and battery storage are installed but not maintained as production assets. Panel degradation goes untracked. Inverter failures reduce generation 15–20% before anyone notices.
Airfield Lighting Waste
Runway and taxiway lighting accounts for 15–22% of airport electricity. Lamp and LED driver failures reduce intensity, triggering full-system overdrives that increase consumption by 10–15% across the circuit.
Ground Equipment Emissions Blind Spot
Diesel-powered GSE (pushback tractors, baggage tugs, de-icing trucks) are the largest Scope 1 emitter at most airports. Without PM-linked fuel tracking, electrification ROI calculations are guesswork.
Airport Energy Management: Without CMMS vs With Oxmaint
| Dimension | Without CMMS | With Oxmaint |
|---|---|---|
| HVAC Energy Tracking | Monthly utility bills — no asset-level visibility | Real-time energy per chiller, AHU, and zone tied to PM records |
| Carbon Reporting | Quarterly manual compilation — 80+ hours per cycle | Automated Scope 1, 2, and 3 data aggregation from asset records |
| Airfield Lighting PM | Reactive lamp replacement after intensity complaints | Scheduled inspections with photometric threshold triggers |
| Solar Array Maintenance | Panels cleaned when visibly dirty — no degradation tracking | Generation-based PM triggers with panel-level condition scoring |
| GSE Fleet Emissions | Fuel logs on paper — no connection to vehicle condition | Fuel consumption per vehicle linked to engine health and PM compliance |
| Audit Readiness | Scramble to assemble records before ACI verification | Audit-ready digital records with timestamped evidence and sign-offs |
Swipe to view all columns on mobile
Connect your airport's energy performance to every maintenance action — from HVAC coils to solar panels
Oxmaint tracks asset condition, energy impact, and carbon output across terminals, airfield, and ground operations in one platform — so your sustainability targets are backed by maintenance reality.
How Oxmaint Connects Energy, Maintenance, and Carbon Reporting for Airport Operations
Energy-Linked Asset Registry
Every HVAC unit, chiller, AHU, lighting circuit, and solar inverter carries an energy consumption baseline in its Oxmaint asset record. When PM is completed, the energy impact is logged. When a compressor starts drawing 20% above baseline, the work order generates automatically — before the monthly utility bill arrives. This asset-level energy view is what ACI Level 2 and above requires but most airports still assemble manually. Start a free trial and build your airport energy asset map.
Automated Carbon Reporting
Oxmaint aggregates Scope 1 emissions (GSE fuel, heating), Scope 2 (electricity from grid), and Scope 3 (vendor operations, tenant energy) from maintenance records and meter integrations. Reports align with ISO 14064 and ACI verification requirements. What used to take 80+ hours of manual compilation becomes a real-time dashboard that updates with every closed work order. Book a demo to see carbon reporting in action.
Terminal HVAC Optimization Workflows
Condition-based PM schedules for chillers, cooling towers, AHUs, and ductwork — triggered by runtime hours, temperature deviation, or energy consumption thresholds. Filter replacement, coil cleaning, damper calibration, and refrigerant charge checks all run on the schedule that matches your terminal's actual operating conditions, not a generic calendar. Research shows properly maintained HVAC systems reduce airport terminal energy use by 15–35%. Start a free trial to configure HVAC PM schedules.
Renewable Energy Asset Lifecycle Management
Solar arrays, battery storage, EV charging stations, and ground-source heat pumps are production assets that need lifecycle tracking — not just installation records. Oxmaint manages panel degradation curves, inverter health, battery cycle counts, and charger uptime as part of the unified airport asset hierarchy. Istanbul Airport's 199 MW solar plant is proof that airports are scaling renewables fast — the maintenance infrastructure must keep pace. Book a demo to see renewable asset tracking.
The Numbers Behind CMMS-Driven Airport Energy Management
Frequently Asked Questions
How does Oxmaint help airports achieve ACI Carbon Accreditation?
Oxmaint provides the operational data backbone that ACI verification requires — asset-level energy consumption records, maintenance-linked carbon calculations, and timestamped digital evidence for every work order. The platform aggregates Scope 1, 2, and 3 emissions from maintenance records and meter integrations, generating audit-ready reports that align with ISO 14064. This replaces the manual spreadsheet compilation that most airports still rely on, cutting reporting time from weeks to hours. Book a demo to see ACI-aligned reporting.
What airport assets should be in the CMMS for energy management?
At minimum: all terminal HVAC equipment (chillers, AHUs, cooling towers, boilers), airfield lighting circuits and regulators, solar arrays and inverters, EV charging infrastructure, battery storage systems, ground support equipment fleet, baggage handling drives, and building envelope systems (insulation, glazing, automated doors). Each asset should carry an energy consumption baseline so deviations trigger maintenance action automatically. Start a free trial to build your airport asset registry.
Can Oxmaint track Scope 3 emissions from airport tenants and ground handlers?
Yes. Oxmaint's vendor management module tracks third-party energy data alongside internal operations. Tenant energy reporting, ground handler GSE fuel consumption, and airline APU usage can all be logged against the relevant asset zones. This is required for ACI Level 3 and above, where airports must demonstrate active engagement with third-party emission sources. Book a demo to see Scope 3 tracking.
How does CMMS-driven maintenance actually reduce airport carbon emissions?
Every poorly maintained asset wastes energy — and wasted energy is carbon. A fouled chiller coil increases compressor draw by 15–25%. A failed lighting driver triggers circuit-wide overdrives. A diesel GSE vehicle with overdue engine service burns 10–15% more fuel per hour. When CMMS schedules catch these conditions early, the energy waste never happens. Across thousands of assets at a major airport, these micro-efficiencies compound into measurable carbon reductions that satisfy ACI verification. Start a free trial and quantify your maintenance-energy connection.
Your net-zero deadline is fixed. Your maintenance platform should accelerate you toward it — not hold you back.
Oxmaint connects every airport asset — from terminal chillers to runway lights to solar inverters — into one energy-aware maintenance platform with built-in carbon tracking and ACI-aligned reporting.