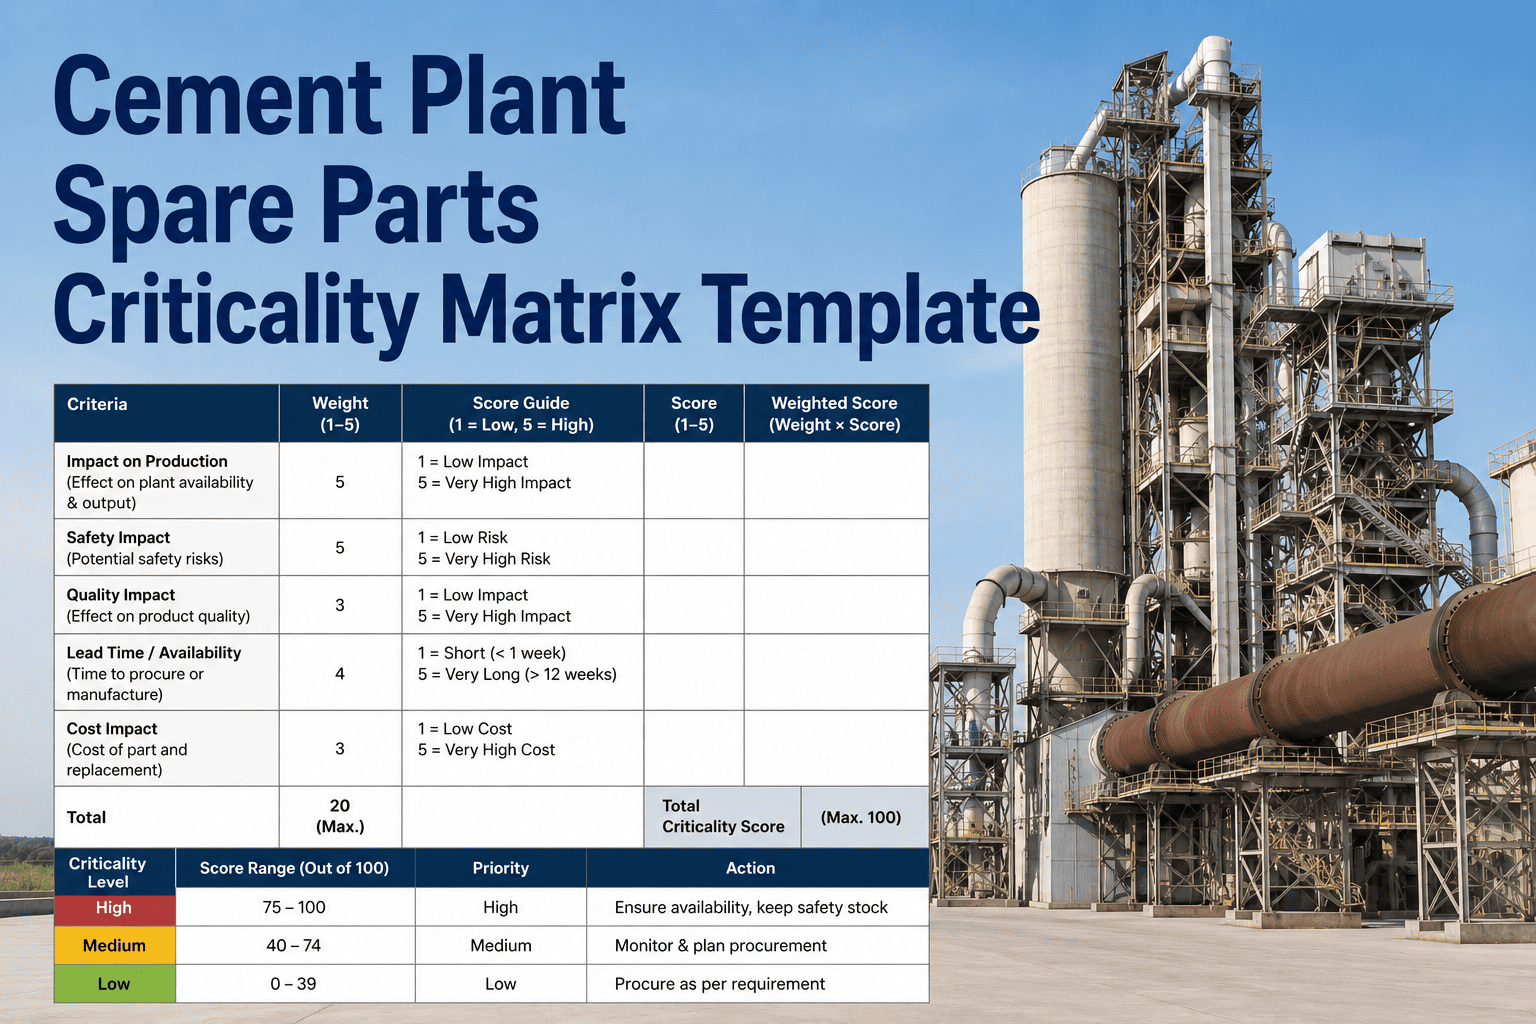
Cement plant spare parts inventories hold $2–$8 million in stocked items, yet 30–45% of that capital sits unused for over 2 years while critical components stock out during breakdowns. Manual criticality assessments rely on tribal knowledge and outdated usage patterns, creating bloated inventories that tie up cash without improving equipment uptime. AI-powered criticality matrices analyze failure data, lead times, demand variability, and downtime costs to assign dynamic risk scores to every SKU—optimizing stock levels, identifying obsolete items, and preventing emergency purchases. Plants implementing intelligent spare parts management reduce inventory value by 25–40% while cutting stockout incidents by 60–75%, transforming storerooms from cost drains into strategic assets.
The Spare Parts Inventory Crisis
Traditional spare parts management treats all items with equal planning rigor. Planners set min/max levels based on gut feel, vendor suggestions, or simple historical averages—ignoring the massive differences in failure risk, financial impact, and supply chain constraints across thousands of SKUs.
A typical 5,000 TPD cement plant stocks 3,800–6,500 unique spare parts. Analysis shows that 8–12% of those items account for 75–80% of actual maintenance consumption, while the remaining inventory generates minimal turnover but consumes warehouse space and working capital.
What Is a Spare Parts Criticality Matrix?
A criticality matrix ranks every inventory item on two dimensions: failure consequence (production loss, safety risk, repair cost) and supply vulnerability (lead time, supplier reliability, demand unpredictability). Items are plotted on a grid and assigned to management categories.
- Stock multiple units with generous safety buffers
- Monitor consumption weekly
- Establish backup suppliers
- Stock 1–2 units with standard reorder points
- Monthly consumption reviews
- Just-in-time ordering viable
- Stock minimal quantities or consignment inventory
- Long lead times justify holding 1 unit
- Consider make vs buy alternatives
- Order on demand, minimal or zero stock
- Quarterly usage audits
- Consolidate with other purchases
Build Your AI Criticality Matrix in 72 Hours
Upload your CMMS parts list and purchase history. OxMaint's AI analyzes failure patterns, lead times, and downtime costs to generate a complete criticality matrix with optimized stock levels for every SKU.
How AI Calculates Spare Parts Criticality Scores
Machine learning models process five data streams to assign each part a 0–100 criticality score that drives stocking decisions.
Failure Impact Analysis
Models calculate production loss per hour of downtime caused by part failure. Accounts for equipment criticality, process bottlenecks, and redundancy. High-impact parts on critical path equipment receive 80–100 scores.
Lead Time Risk Scoring
Evaluates supplier reliability, shipping duration, and customs/import complexity. Parts with 8+ week lead times or single-source suppliers receive elevated vulnerability scores regardless of usage frequency.
Demand Variability Modeling
Uses time-series forecasting to identify erratic consumption patterns. High coefficient of variation signals unpredictable failures requiring larger safety buffers. Stable demand allows tighter inventory control.
Financial Consequence Weighting
Combines unit cost, repair labor hours, and production loss value. A $500 part causing $200K downtime scores higher than a $20K part with 2-hour fix time. Prevents over-indexing on item price alone.
Obsolescence Detection
Flags parts unused for 18+ months, superseded by equipment upgrades, or tied to decommissioned assets. Prevents wasteful restocking of dead inventory. Recommends disposal or consignment alternatives.
From Criticality Scores to Optimized Stock Levels
AI translates criticality rankings into actionable inventory policies—calculating precise min/max quantities, reorder points, and safety stock for each part based on its risk profile.
| Criticality Tier | Min Stock | Max Stock | Safety Buffer | Reorder Trigger |
|---|---|---|---|---|
| Critical (Score 80–100) | 2–3 units | 5–8 units | 1.5× lead time demand | When stock hits 3 units |
| Important (Score 60–79) | 1–2 units | 3–5 units | 1.2× lead time demand | When stock hits 2 units |
| Strategic (Score 40–59) | 0–1 units | 2 units | 1× lead time demand | When stock hits 1 unit |
| Routine (Score 0–39) | 0 units | 1 unit | None (order on demand) | When needed for job |
Before AI Optimization
After AI Optimization
Real-World Inventory Optimization Results
Key Actions Taken
- Moved 420 critical parts from min stock 1 → 3 units based on high failure-impact scores
- Eliminated stock for 890 routine parts with lead times under 5 days
- Identified 112 parts tied to decommissioned equipment and liquidated $315K inventory
- Established consignment agreements for 68 strategic spares with long lead times
Stop Guessing at Spare Parts Stock Levels
OxMaint's AI criticality engine analyzes your failure data, supplier performance, and downtime costs to generate optimized min/max levels for every part. Reduce inventory value 25–40% while improving equipment uptime.
Advanced Criticality Factors Beyond Basic Impact
Sophisticated AI models incorporate additional variables that manual assessments typically miss—delivering nuanced criticality rankings that reflect operational reality.
Seasonal Demand Patterns
Identifies parts with cyclical usage tied to weather, production campaigns, or harvest seasons. Adjusts safety stock levels dynamically rather than holding year-round excess. Kiln refractory consumption spikes in summer; AI buffers stock in Q2 and reduces in Q4.
Failure Mode Clustering
Detects parts that fail together due to common root causes. When gearbox input bearings fail, output bearings often follow within 30 days. AI flags these clusters and recommends stocking both items even if individual usage appears low.
Supplier Concentration Risk
Assigns penalty scores to single-source parts from financially unstable vendors or geopolitically risky regions. A $200 part from a sole supplier in a trade-restricted country may rank higher than a $2K part with five domestic alternatives.
Interchangeability Analysis
Maps cross-compatible parts to reduce duplicate stocking. If three motor models use identical bearings, criticality score factors total fleet exposure rather than individual equipment. Enables consolidation without increasing stockout risk.
Make vs Buy Economics
Evaluates in-house fabrication feasibility for high-lead-time parts. Custom wear plates with 12-week delivery may score lower if shop can fabricate in 48 hours. Model compares outsource cost, lead time, and quality risk against internal capabilities.
Technology Obsolescence Forecasting
Predicts when OEM support will end based on product lifecycle data and vendor announcements. Parts nearing end-of-life receive temporary criticality boosts to trigger lifetime buys before discontinuation—preventing future unavailability crises.
Integrating AI Criticality Into Daily Operations
Criticality matrices deliver value only when embedded in procurement workflows, storeroom procedures, and maintenance planning cycles.
CMMS triggers purchase requisitions when stock hits reorder point. Criticality score determines approval routing—critical parts auto-approve up to $10K, routine parts require manager sign-off at $500.
Physical bin locations assigned by criticality tier. Critical spares in front aisles with barcode tracking and dual-bin systems. Routine parts in back or offsite storage. Reduces picking time and inventory audit effort.
Annual spare parts budget segmented by criticality. 60–70% allocated to critical tier, 20–25% to important, 10–15% to strategic/routine. Prevents budget creep on low-impact items while ensuring mission-critical stock.
Turnaround bills of material cross-referenced against criticality matrix. High-score parts ordered 6–8 weeks early with expedited shipping options. Low-score parts purchased just-in-time or rented for single use.
Criticality data strengthens procurement leverage. For high-score parts, negotiate consignment inventory or stocking agreements. For low-score parts, consolidate into quarterly bulk orders to extract volume discounts.
Monthly AI model retraining incorporates new failure events, usage data, and supplier performance. Criticality scores drift over time as equipment ages and supply chains evolve—quarterly reviews keep policies current.
Manual vs AI-Driven Criticality Assessment
| Assessment Dimension | Manual Spreadsheet Method | AI Criticality Matrix |
|---|---|---|
| Analysis Time | 4–8 weeks for 3,000+ SKUs | 48–72 hours with automated data pull |
| Data Inputs | Planner judgment, vendor catalogs, spot checks | CMMS history, sensor data, production logs, procurement records |
| Scoring Consistency | Subjective—varies by analyst experience | Objective—same inputs yield identical scores |
| Update Frequency | Annually or when major issues occur | Monthly auto-refresh with new data |
| Coverage Completeness | Top 200–500 parts analyzed in depth | Every active SKU receives calculated score |
| Hidden Costs Detection | Rarely identifies obsolete or redundant items | Flags low-turnover stock and duplicate SKUs |
| Supply Chain Risk | Not systematically evaluated | Vendor reliability and lead time integrated into scores |
Frequently Asked Questions
What data is required to build an AI criticality matrix?
Minimum requirements: 12 months of parts issue transactions from CMMS, current inventory quantities, and purchase order history with lead times. Optional data like equipment criticality rankings, production schedules, and failure costs improve accuracy. Most plants have sufficient data in existing systems—no new data collection needed.
How often should criticality scores be recalculated?
AI models auto-update monthly with new failure events and consumption data. Quarterly human reviews adjust for strategic changes like equipment additions or supplier shifts. Annual deep audits validate model accuracy and retrain algorithms. Continuous learning prevents scores from becoming outdated as operational conditions evolve.
Can criticality matrices handle custom or fabricated parts?
Yes, AI evaluates make-vs-buy economics by comparing in-house fabrication time against supplier lead times. Custom parts often score high due to single-source risk, triggering recommendations for backup drawings, material pre-positioning, or strategic stock. System flags opportunities to standardize custom items into catalog equivalents where feasible.
What if AI recommends reducing stock on a part that later causes downtime?
Models include safety buffers and confidence intervals—aggressive recommendations are flagged for planner approval. Post-event analysis shows AI-optimized inventories have 60–75% fewer stockouts than manual systems because algorithms catch early failure signals in usage patterns. When stockouts occur, models immediately adjust scores to prevent recurrence.
How does AI handle parts shared across multiple equipment types?
System aggregates failure risk across all installed bases. A bearing used in 12 motors receives higher criticality than identical bearing in one motor—total fleet exposure drives stocking policy. AI also identifies consolidation opportunities where different part numbers serve interchangeable functions, reducing SKU count without increasing risk.
Does this integrate with existing ERP and procurement systems?
Yes, criticality scores export to SAP, Oracle, Maximo, or similar platforms via API or CSV. Min/max levels and reorder points auto-populate in procurement modules. Purchase requisitions include criticality tier to streamline approval routing. No replacement of existing systems—AI layers on top to enhance decision-making.
Turn Your Spare Parts Storeroom Into a Strategic Asset
Stop wasting capital on obsolete inventory while risking costly stockouts. OxMaint's AI criticality matrix delivers optimized stock levels for every part—reducing inventory value 25–40% while improving uptime. Join cement plants cutting millions in excess inventory without sacrificing reliability.