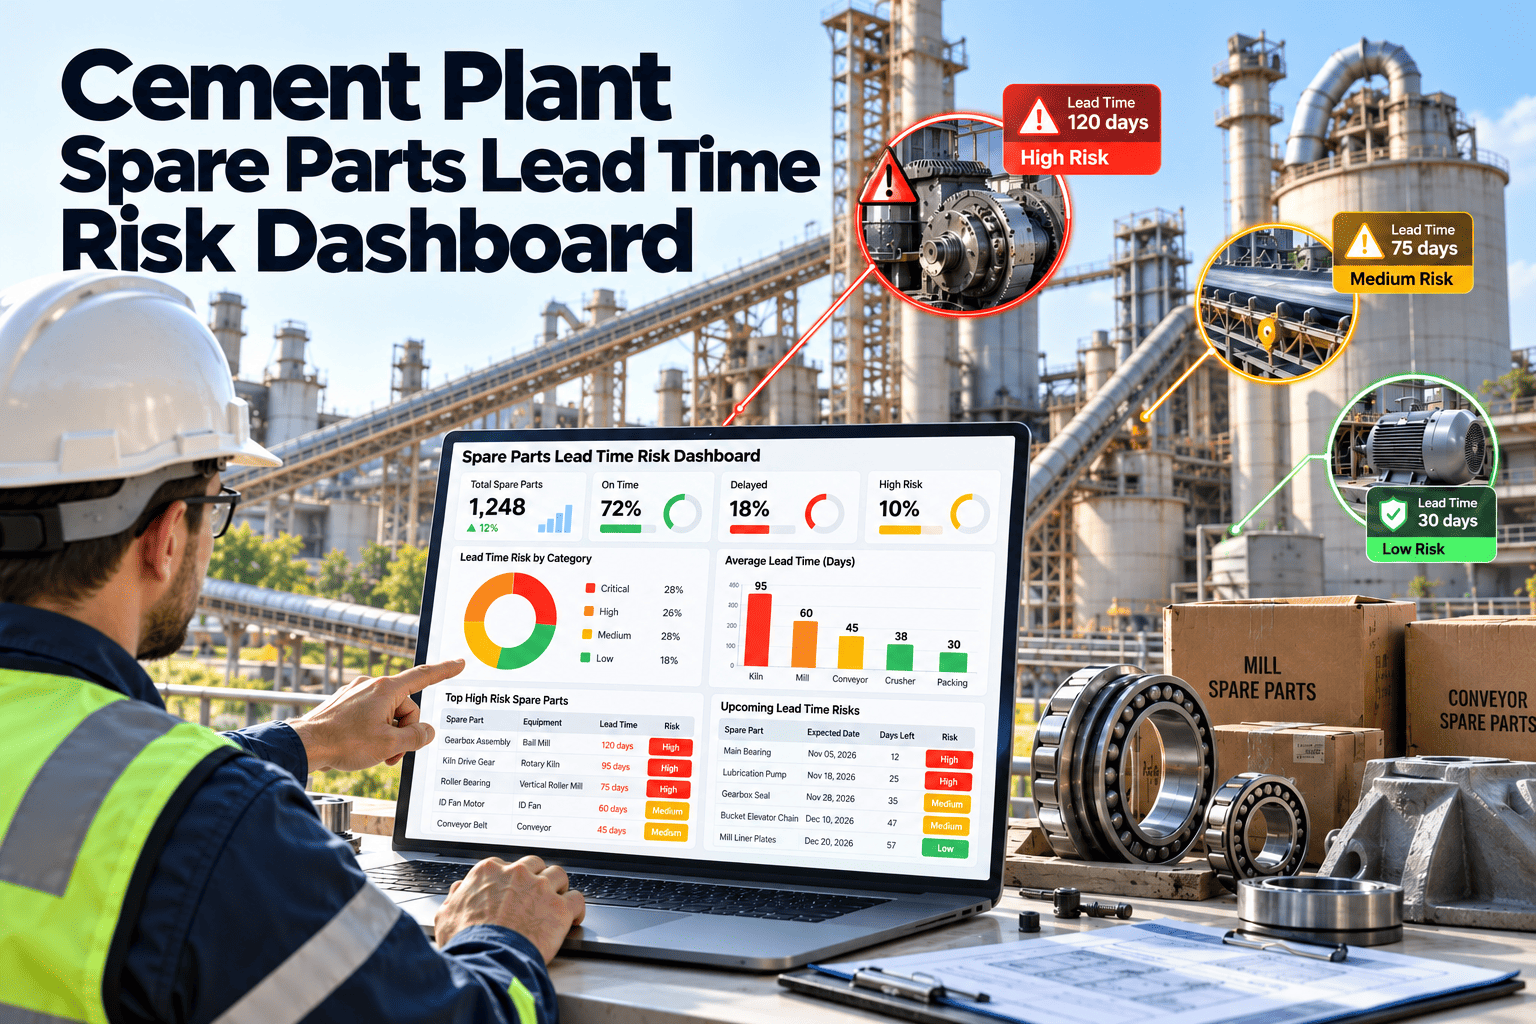
Every cement maintenance planner knows the feeling of opening a work order and realising the part is on a ship, in a repair shop or still waiting for an approval. The problem is rarely a lack of data. Lead times sit in purchasing files, condition findings sit in inspection reports and stock sits in a storeroom system that nobody trusts. A spare parts lead time risk dashboard brings these views together so planners see exposure while there is still time to act. Teams exploring this approach can look at Oxmaint dashboards and inventory tools as one way to build it.
Cement Plant Spare Parts Lead Time Risk Dashboard
See which spares are exposed, by how many days, and what the equipment is telling you, in one view tied to assets, inspections, alerts and work orders.
Kiln support roller bearingHigh
Mill roller assemblyWatch
Cooler hydraulic cylinderWatch
ID fan bearing setCovered
Illustrative layout only. Values depend on your own data.
What a lead time risk dashboard answers
A good dashboard replaces meetings with a small set of questions that planners, storekeepers and plant managers can answer in seconds.
Which critical spares are below target? Stock against minimum, with open requisitions and expected delivery dates.
Where does lead time exceed the warning? Compare supplier lead time to the time left before the need date.
Which assets are showing wear? Inspection findings, alerts and overdue work linked to the part that will be needed.
What is blocked by a missing part? Work orders waiting on material, sorted by production impact.
Who owns the next action? A named buyer, planner or engineer for each exposed item.
The data that feeds the dashboard
The dashboard is only as useful as the connections behind it. Five data streams create a complete picture of risk.
A
Asset data
Equipment hierarchy from kiln to packing plant, with each critical spare linked to the machine it protects.
B
Inspections
Thickness readings, alignment checks, lubrication findings and visual notes captured by technicians.
C
Alerts
Condition alarms from vibration, temperature or other monitoring that signal a part may be needed soon.
D
Work orders
Planned and corrective jobs with parts requirements, due dates and status.
E
Analytics
Consumption trends, supplier delivery performance and failure history used to refine the risk score.
Build a risk score planners can trust
A transparent score is easier to defend than a black box. Many plants begin with a simple weighted model and tune it after each outage.
Lead time gap
Days between today plus supplier lead time and the expected need date.
+
Consequence
Production unit affected, safety implications and availability of alternates.
+
Condition signal
Open alerts, adverse inspection findings and overdue preventive tasks on the asset.
+
Stock position
Quantity on hand, reserved and on order compared with the minimum.
Suggested exposure bands
| Band | Meaning | Typical action |
|---|---|---|
| Red | Need date falls inside the lead time and no stock covers it | Escalate to plant management, explore expedite, alternates or pooled stock |
| Amber | Coverage is thin or a condition signal is rising | Confirm the order, confirm delivery date, review inspection frequency |
| Green | Stock or confirmed delivery covers the need | Monitor through the normal replenishment cycle |
| Grey | Data is missing, such as no lead time or no owner | Complete the record before the next review |
One dashboard, different views for each role
Maintenance planner
- Upcoming jobs with incomplete kits
- Work orders waiting on material
- Shutdown tasks that lack parts lists
Storekeeper
- Items below minimum
- Reservations against planned work
- Cycle count variances
Reliability engineer
- Condition alerts linked to spares
- Repeat failures and consumption trends
- Criticality review candidates
Plant manager
- Count of red and amber items
- Expedite spend and delay hours
- Exposure by production unit
Map your own lead time exposure
Share a sample of critical spares and see how asset records, alerts and work orders can drive a single risk view.
Alert rules that turn exposure into action
A dashboard that only displays risk becomes wallpaper. Pair each exposure band with a rule and an owner.
Rule
A critical spare has no stock and an open condition alert on the linked asset.
ResponseCreate a work order, notify the planner and the buyer, and request confirmation of supplier delivery.
Rule
A requisition has been open longer than the agreed approval time.
ResponseEscalate to the approver with the lead time and downtime impact attached.
Rule
A planned shutdown task has no parts list.
ResponseReturn the task to the planner before the schedule is frozen.
Rule
Supplier delivery has slipped past the promised date.
ResponseUpdate the lead time on the record so the risk score reflects reality.
From spreadsheet to live dashboard
Spreadsheet and email
- Lead times are typed once and rarely updated.
- Stock is exported weekly, so it is already out of date.
- Condition findings live in a different file.
- Nobody sees the link between a failing bearing and the missing spare.
Connected maintenance system
- Parts, assets and work orders share one record.
- Stock changes as parts are issued and received.
- Inspection and alert history sits beside the asset.
- Planners see risk before the job is scheduled.
A practical rollout path
Weeks 1 to 2
Choose the scope
Select one production line or the top group of critical spares. Confirm owners and data sources.
Weeks 3 to 4
Clean the records
Align part numbers, add lead times, link spares to assets and flag criticality.
Weeks 5 to 6
Connect work
Attach parts to preventive tasks and corrective templates. Start capturing inspection findings digitally.
Weeks 7 to 8
Launch and review
Run the weekly risk review from the dashboard and adjust scoring rules from real outcomes.
These durations are a planning guide only. Plants with clean registers move faster, and plants starting from scattered files may need longer.
Dashboard KPIs worth tracking
Red and amber count
Number of critical spares in each exposure band, tracked week by week.
Average lead time accuracy
Promised versus actual supplier delivery time.
Work waiting for material
Open work orders blocked by a missing part, with total waiting days.
Expedite cost
Spend on premium freight and urgent purchases.
Record completeness
Share of critical spares with lead time, owner, asset link and minimum filled in.
How Oxmaint supports the dashboard workflow
- Asset management keeps the equipment tree and links spares to the machines that use them.
- Inventory tools track stock, minimum levels and usage from work orders.
- Work orders carry parts, labour and status so waiting items are visible.
- Mobile inspections capture field findings that raise the condition signal.
- Scheduling helps planners place jobs against parts readiness.
- Reports and dashboards summarise exposure for planners and plant leadership.
Data quality rules before you trust the numbers
A dashboard built on poor records only makes mistakes easier to see. Agree on a few rules before launch and enforce them in the workflow.
- Every critical spare has one master part number, with supplier and OEM references stored as alternates rather than separate items.
- Lead time is recorded as a number of days and updated after every delivery, using the actual outcome rather than the quotation.
- Each critical spare is linked to at least one asset, so condition signals and work orders can find it.
- Minimum quantities have a written reason, such as consequence of failure or supplier delay, so they can be reviewed sensibly.
- Issues and returns are booked at the time of use. Without that, stock accuracy falls quickly and so does trust in the screen.
- Every exposed item has a named owner, not just a department.
Walkthrough: from condition alert to purchase order
The following sequence is a generic illustration of how the pieces connect. Details will differ by plant and by the tools in use.
Step 1
Signal appears
A technician records rising bearing temperature on a kiln support roller during a routine round, or a monitoring alert is raised.
Step 2
Work order created
A corrective work order is opened against the asset with the likely parts attached.
Step 3
Dashboard reacts
The linked spare shows no stock and a lead time longer than the planned repair window, so it turns red.
Step 4
Decision made
The planner and buyer confirm an order, request an expedite, or ask engineering to approve an alternate.
Tracking supplier performance as part of lead time risk
Lead time is not a fixed fact. It changes with supplier workload, material availability, logistics and customs conditions. Capture the evidence so the dashboard improves over time.
- Record order date, promised date and actual receipt date on every critical purchase.
- Review variance by supplier and by item category each quarter.
- Use real delivery history to adjust reorder points rather than relying on catalogue figures.
- Flag suppliers who regularly miss dates so engineering can look for alternates before the next critical need.
- Keep notes on quality problems, since a rejected part effectively extends lead time.
Weekly risk review agenda
A short, structured meeting keeps the dashboard in daily use. Many plants find thirty minutes enough when records are clean.
First ten minutes
Review every red item. Confirm owner, action and the date the exposure will close.
Next ten minutes
Review amber items and any condition alerts raised since the last meeting.
Last ten minutes
Check upcoming shutdown tasks for missing kits and agree on record corrections.
Mistakes that make dashboards fail
- Showing too many items, so critical risks are buried among routine consumables.
- Using a score nobody can explain, which leads people to ignore it.
- Leaving lead time fields empty and treating missing data as zero risk.
- Building the screen without involving storekeepers, who know where records and reality differ.
- Treating the dashboard as a reporting tool rather than a trigger for decisions with owners.
Using the dashboard around planned shutdowns
Annual and campaign shutdowns concentrate demand for parts, labour and contractors. The dashboard becomes most valuable in the months before the stoppage, when there is still time to act.
Early scope
Identify long lead items
List every task with a part that takes longer than the time left, and place orders first.
Mid planning
Confirm readiness
Check kits for completeness, including seals, fasteners, gaskets and special tools that are easy to overlook.
Final weeks
Freeze and verify
Hold a readiness review. Any task without a confirmed part is flagged for a decision before the schedule is locked.
After the stop
Close and learn
Return unused parts, record scope growth and update lead times and minimums for the next campaign.
Linking condition monitoring to spare parts exposure
Spare parts risk and equipment condition are usually reviewed separately. Linking them shows which exposures are urgent and which can wait.
- A missing spare on a healthy, well-monitored asset may be acceptable for a time.
- The same missing spare on an asset with rising vibration or temperature needs immediate action.
- Repeated corrective work on one component suggests the minimum level or the maintenance task needs review.
- Overdue preventive maintenance on a critical asset raises the chance that an unplanned need will appear.
- Failed inspections should create work orders that already carry the likely parts, so purchasing hears about them at once.
What a plant manager should see in one minute
Senior leaders need a different view from planners. Keep it short, consistent and tied to production impact.
Exposure by production unit
Which part of the plant carries the most red and amber items, from raw milling through to dispatch.
Top five open risks
The items most likely to stop production, with owner, action and date.
Spend and delay trend
Whether expedite cost and waiting days are rising or falling over recent months.
Which cement spares usually deserve a place on the dashboard
Start narrow and add items as the process matures. A short, accurate list is far more useful than a long one nobody trusts.
- Kiln drive components, support roller and thrust roller bearings, and girth gear or pinion items with long manufacturing times.
- Main drive gearbox parts and motors for raw mills, cement mills and roller presses.
- Mill rollers, grinding table segments and separator components that wear on a predictable curve.
- Cooler grate plates, hydraulic cylinders and drive components that influence kiln speed.
- Large fan rotors, bearings and couplings for process and dust control fans.
- Drives, protection relays and control cards with a single supplier or discontinued model.
Each of these items should carry an owner, a lead time in days, a criticality flag and a link to the asset it supports.
Frequently asked questions
What is lead time risk for a spare part?
It is the chance that a part arrives after the date the equipment needs it, based on supplier time and condition.
Which spares should appear first?
Start with parts whose absence can stop the kiln, mill or cooler and that have long supplier lead times.
Do we need sensors to start?
No. Inspections and work order history already give useful signals. Sensors can be added later.
How often should the dashboard be reviewed?
Many plants hold a weekly review and a pre-shutdown review. Try it first in a trial workspace.
Can we see a sample for our plant?
Yes, schedule a session to walk through your data.
Move from late surprises to early decisions
Put spare parts, asset condition and work orders on one screen your planners and managers can rely on.