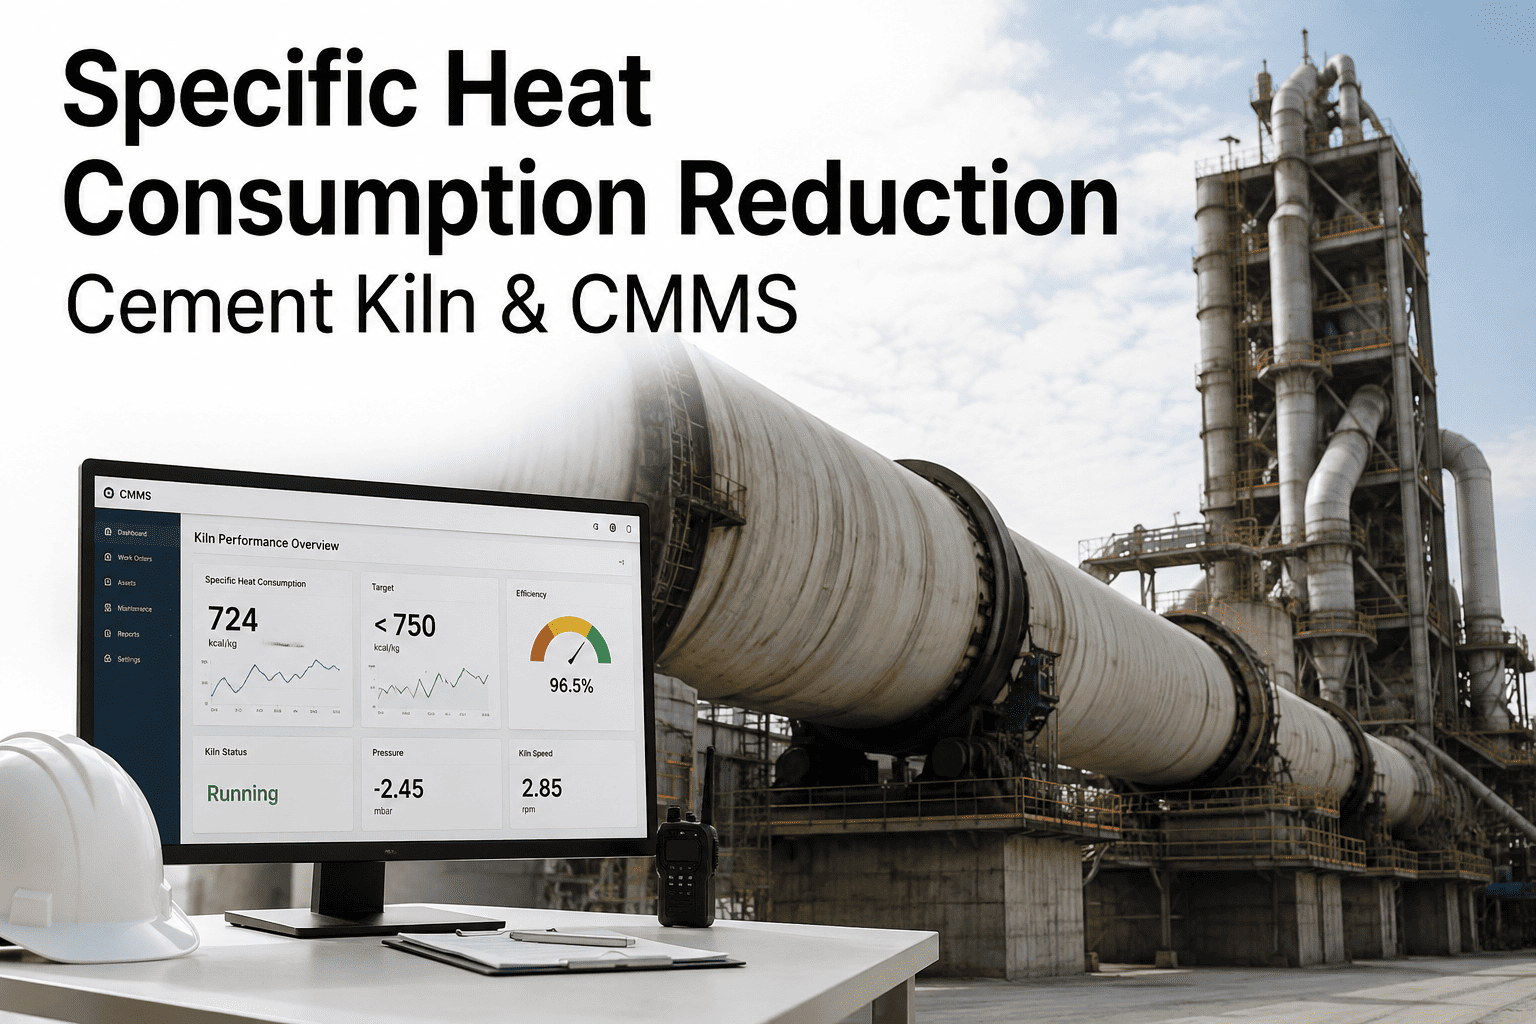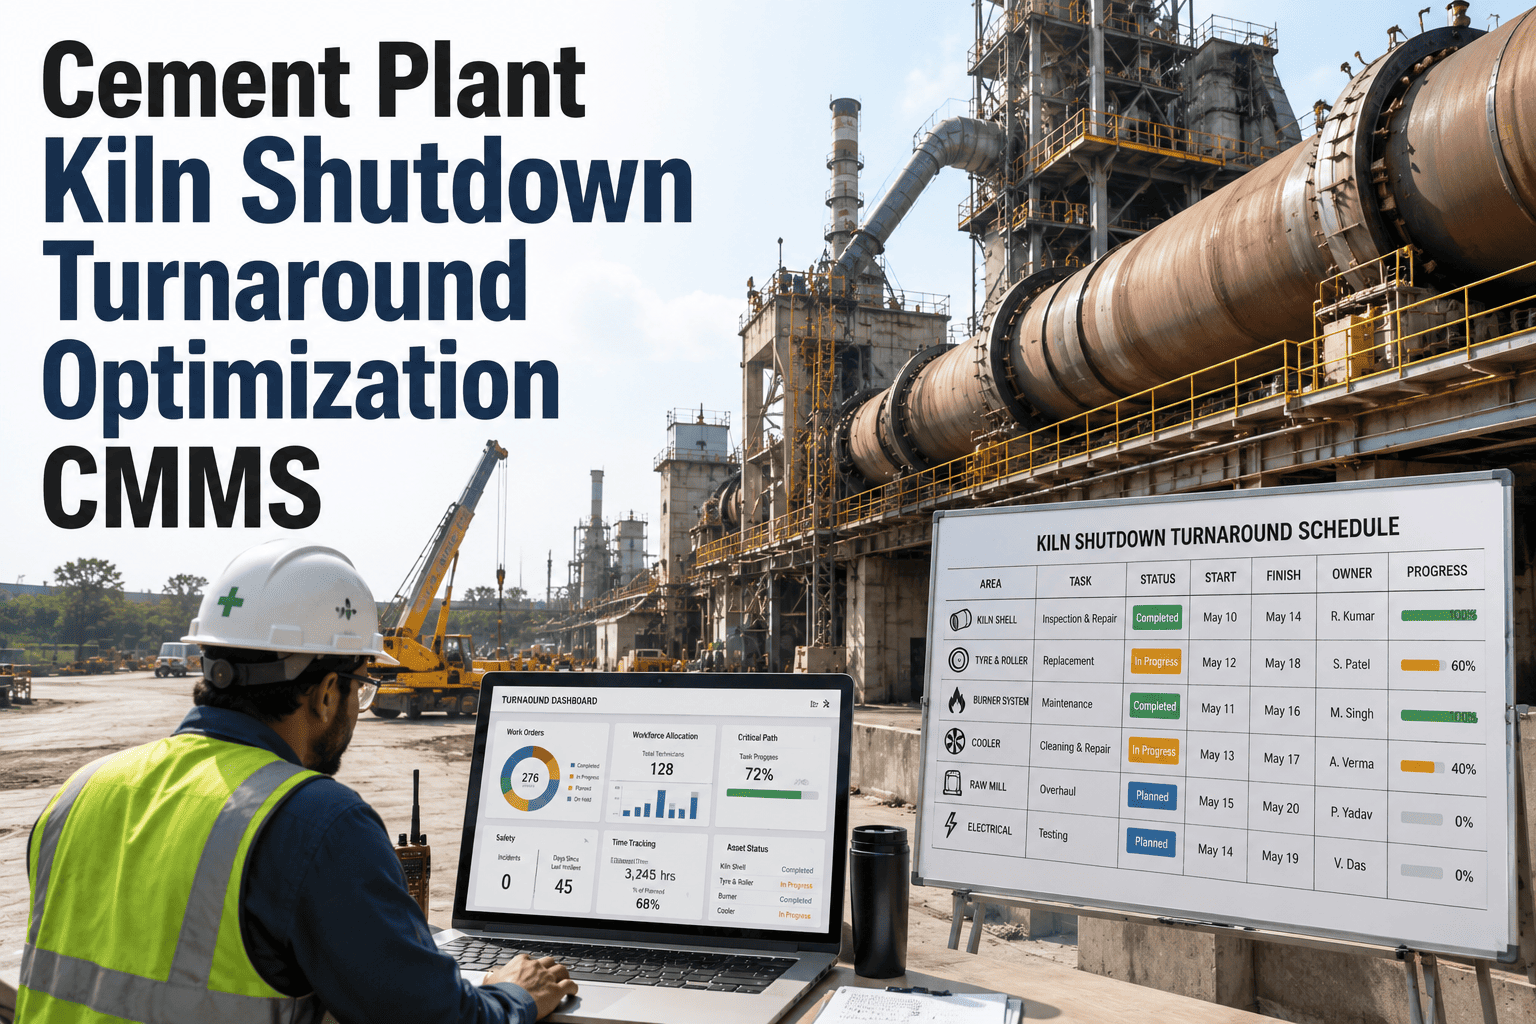
Energy accounts for 30 to 40 percent of total production cost in a cement plant, and a measurable share of that load is governed not by process design but by how well maintenance protects kiln heat balance, mill power draw, cooler recovery and fan drive efficiency. Degraded refractory, worn grinding media, false-air leaks and fouled heat exchangers silently inflate specific heat consumption (SHC) and specific power consumption (SPC) long before a failure ever triggers a downtime event. A CMMS-driven energy maintenance program closes that gap by tying work orders to energy KPIs, tracking degradation against thresholds, and surfacing retrofit opportunities with defensible payback math. This 2026 guide breaks down the energy-critical maintenance items, the formulas you should be monitoring monthly, and the program structure that consistently trims SHC and SPC — start with a Start Free Trial to map your own baseline before reading further.
Can maintenance move your specific heat consumption below 3,100 kJ/kg clinker?
Across a 2.5 million tpy clinker line, every 50 kJ/kg of SHC drift costs roughly $640,000 per year in fuel. Maintenance — not capital projects — is the fastest lever to recover it. This guide maps the CMMS-driven program plants use to hold kiln, mill and auxiliary losses inside a controlled band.
Why maintenance owns 8–14% of your energy bill
Energy in cement is not a single dial — it is the sum of dozens of asset-level efficiencies that decay between outages. A 10 mm false-air leak at the preheater exit can add 60–90 kJ/kg to SHC. A 5% drop in separator efficiency raises mill power by 3–4 kWh/t. Maintenance is the only function that touches every one of those points on a recurring cycle.
The five asset zones that decide your SHC and SPC
Each zone below carries a measurable energy penalty when maintenance slips. Tie every work order to the zone it protects so planners can quantify energy saved, not just hours avoided.
Kiln & Preheater
- Refractory thickness mapping vs. shell-scan thermography
- False-air survey at preheater, kiln hood and tertiary air duct
- Coating ring removal scheduling before induced-draft fan spikes
Clinker Cooler
- Grate plate and static lane inspection for clinker fallback
- Under-grate seal air leakage testing
- Secondary air temperature tracking vs. bed depth control
Raw & Cement Mills
- Grinding media grading and refill cycle vs. kWh/t trend
- Separator rotor wear and reject cone sealing
- Mill diaphragm slot condition and material flow balance
Fan Drives & Ducts
- ID fan impeller wear and balance, damper linkage play
- VFD cooling filter cleaning and harmonic filter health
- Duct elbow wear-pad replacement before leakage onset
Compressed Air & Auxiliaries
- Compressor unload band tuning and leak-tag quarterly survey
- Conveyor gearbox oil sampling and bearing temperature audit
- Lighting and motor rewind vs. IE4/IE5 upgrade tracking
Capture & Measurement
- Calibration of kiln feed, fuel flow and gas flow meters
- Online analyser probe cleaning and drift correction
- SHC and SPC dashboard reconciliation against monthly inventory
The formulas that turn work orders into energy savings
A CMMS energy program does not need a new reporting layer — it needs three formulas wired into every energy-critical work order, so a completed job returns a number in kJ or kWh saved, not just a tick in a box.
Track weekly. A 50 kJ/kg rise that persists three consecutive weeks triggers a forced false-air and refractory inspection work order before the next planned outage.
Compare against the media grading curve. When SPC exceeds baseline by 2 kWh/t, auto-generate a media top-up or diaphragm inspection order.
Target 70–75% for a modern grate cooler. A 3-point drop typically maps to under-grate leakage and triggers a seal-air inspection.
A 1.8 million tpy plant recovering $1.12M in 11 months
A mid-size single-line plant running at 3,520 kJ/kg SHC and 95 kWh/t cement SPC deployed a CMMS energy program across six asset zones. False-air sealing dropped SHC by 70 kJ/kg within four weeks. A separator rotor and media recharge cut mill SPC by 3.1 kWh/t. Cooler seal repairs added 25 kJ/kg recovery. Total programme payback hit 7.4 months on a $310K maintenance spend, with $1.12M in annualised energy savings validated against the fuel and power invoices.
A 12-month rollout that pays back inside year one
The sequence below mirrors the rollout used by plants that hit 3–5% specific energy reduction in their first cycle. Each phase has a hard exit gate — no phase starts until the previous KPI is banked.
Baseline & metering reconciliation
Calibrate fuel, feed and gas meters; reconcile SHC and SPC against monthly inventory; build the asset-zone register inside the CMMS.
Quick-win sealing and calibration
False-air surveys, duct leak sealing, damper linkage repair and probe cleaning. Target: 30–60 kJ/kg SHC recovery before any capital spend.
Grinding circuit and cooler recovery
Media recharge, separator refurbishment, under-grate seal repair and secondary air optimisation. Target: 2–3 kWh/t SPC and 20–30 kJ/kg SHC.
Fan, VFD and compressed-air optimisation
Impeller balancing, VFD filter cleaning, compressor unload tuning and a plant-wide leak-tag campaign. Target: 1–2 kWh/t auxiliary power reduction.
KPI loops and retrofit backlog
Lock thresholds into the CMMS so any drift auto-generates a work order; build the retrofit backlog with payback ranked for the next budget cycle.
Maintenance-led retrofits ranked by energy payback
Not every retrofit belongs in the maintenance budget — but the ones below do, because they replace wear items the team already touches. Rank them by kWh or kJ recovered per dollar spent, not by unit cost.
| Retrofit action | Zone | Typical energy gain | Indicative cost | Payback |
|---|---|---|---|---|
| Preheater false-air sealing + gasket renewal | Kiln | 40–80 kJ/kg clinker | $25K–$60K | 3–6 months |
| Cooler under-grate seal & grate plate replacement | Cooler | 25–50 kJ/kg clinker | $80K–$140K | 6–10 months |
| Mill media recharge + diaphragm refurb | Mill | 2–4 kWh/t finished | $40K–$90K | 5–9 months |
| Separator rotor and reject cone renewal | Mill | 1–2 kWh/t finished | $30K–$55K | 6–12 months |
| ID fan impeller hard-facing + dynamic balance | Fan | 0.5–1.5 kWh/t clinker | $15K–$35K | 4–8 months |
| Compressed air leak survey + repair programme | Auxiliary | 0.3–0.8 kWh/t cement | $8K–$20K | 2–5 months |
The KPI tiles that keep energy on the planner's desk
Wire these six KPIs into the CMMS dashboard so every planner, shift engineer and reliability lead sees the same numbers in the morning huddle. Each tile should carry a trend arrow and a threshold beyond which a work order is auto-raised.
Stop charging energy losses to the fuel budget
If your CMMS cannot show kJ and kWh saved per closed work order, your maintenance team is invisible to the energy conversation. Fix that in under 30 days.
Cement plant energy optimization, answered
How much energy can a maintenance-only program realistically recover?
Plants that wire energy KPIs into the CMMS and act on the resulting work orders typically recover 3–5% specific energy in year one, with 70% of that coming from sealing, calibration, media recharge and cooler seal work — no major capital required. The remaining upside usually needs a retrofit, which the same program surfaces with ranked payback.
Which CMMS KPIs matter most for cement energy optimization?
The six that move the fuel and power invoices: SHC (kJ/kg clinker), SPC (kWh/t cement), cooler efficiency, false-air ratio, mill media fill and on-time closure of energy-tagged work orders. Each should carry a threshold that auto-generates a work order when breached. You can stand this up inside the Start Free Trial workspace using the cement energy template.
How do I justify the maintenance budget against energy savings?
Tag every energy-critical work order with the kJ/kg or kWh/t it is expected to recover, then reconcile against the monthly fuel and power invoices. The worked example in this guide — $310K spend, $1.12M annualised saving — is the format most finance teams accept. Book a Book a Demo session to see the report structure.
What is the single biggest hidden energy leak in a cement plant?
False air. A 10 mm leak at the preheater exit or kiln hood can add 60–90 kJ/kg to SHC, yet it rarely shows up on a downtime report because the plant keeps running. Quarterly false-air surveys with thresholds wired into the CMMS catch it before the fuel bill does.
Does this program apply to plants with waste heat recovery already installed?
Yes — arguably more. A WHR system tightens the kiln heat balance, so any SHC drift directly reduces WHR generation and the plant's grid draw. Maintenance on the WHR boiler, economiser and dust handling is an energy-critical item in its own right and belongs in the same CMMS energy program.
Map your baseline, then drive SHC and SPC down — work order by work order
Spin up a cement energy workspace, import your asset register, and have your first six KPI tiles live before the next outage window closes.
Free 14-day trial · No credit card