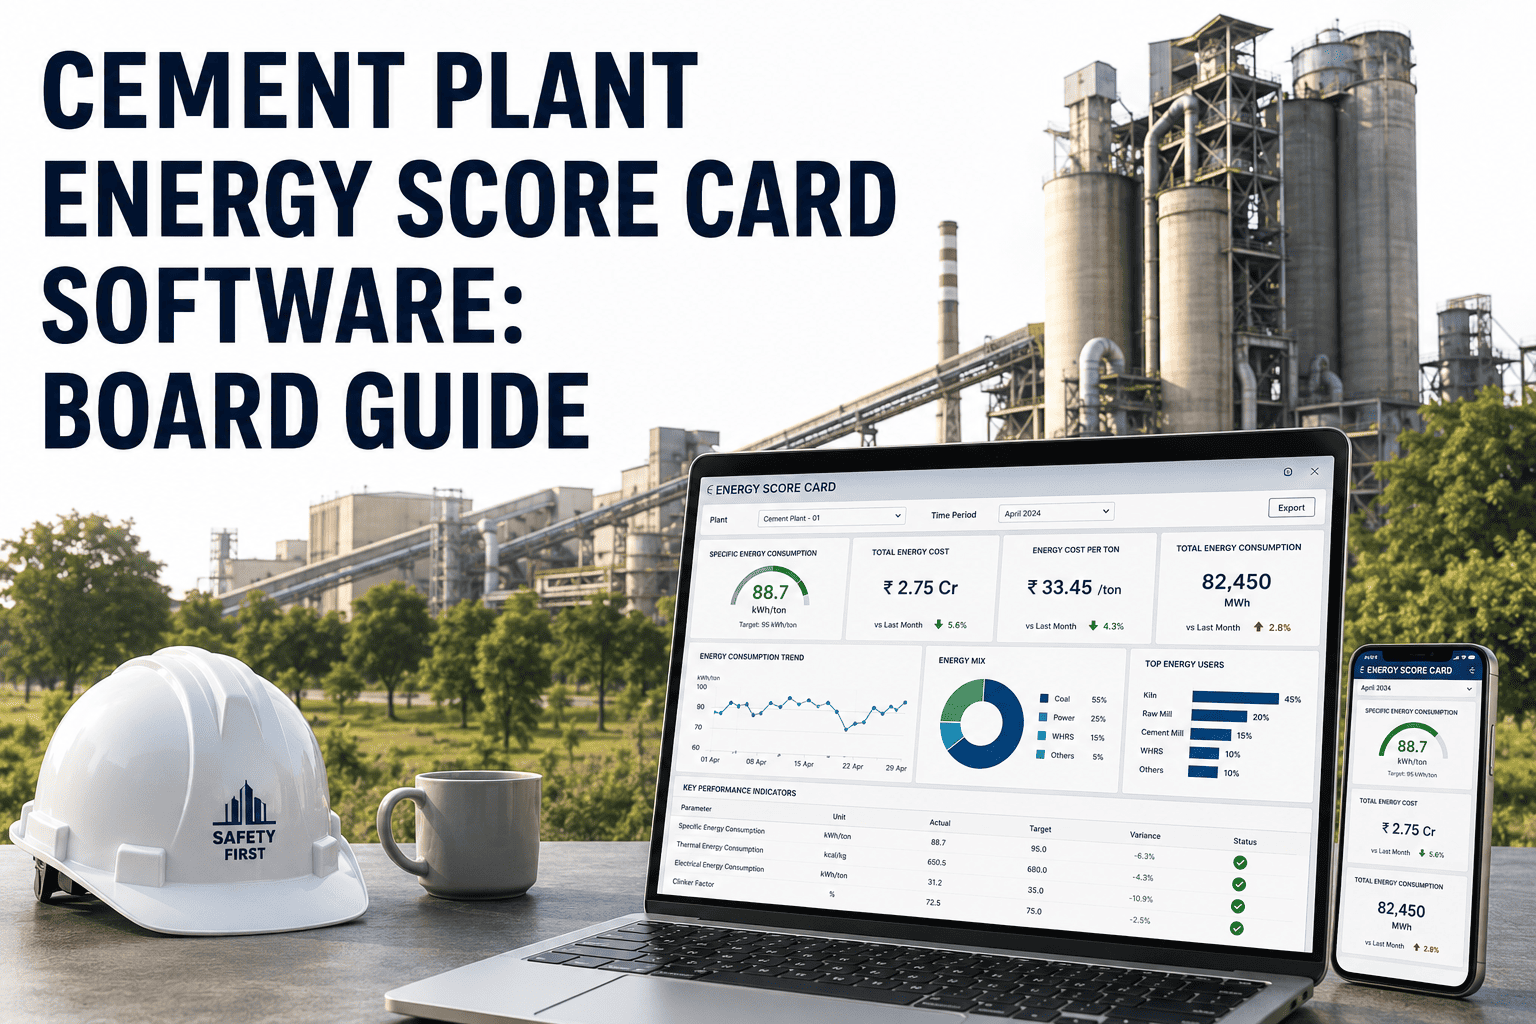
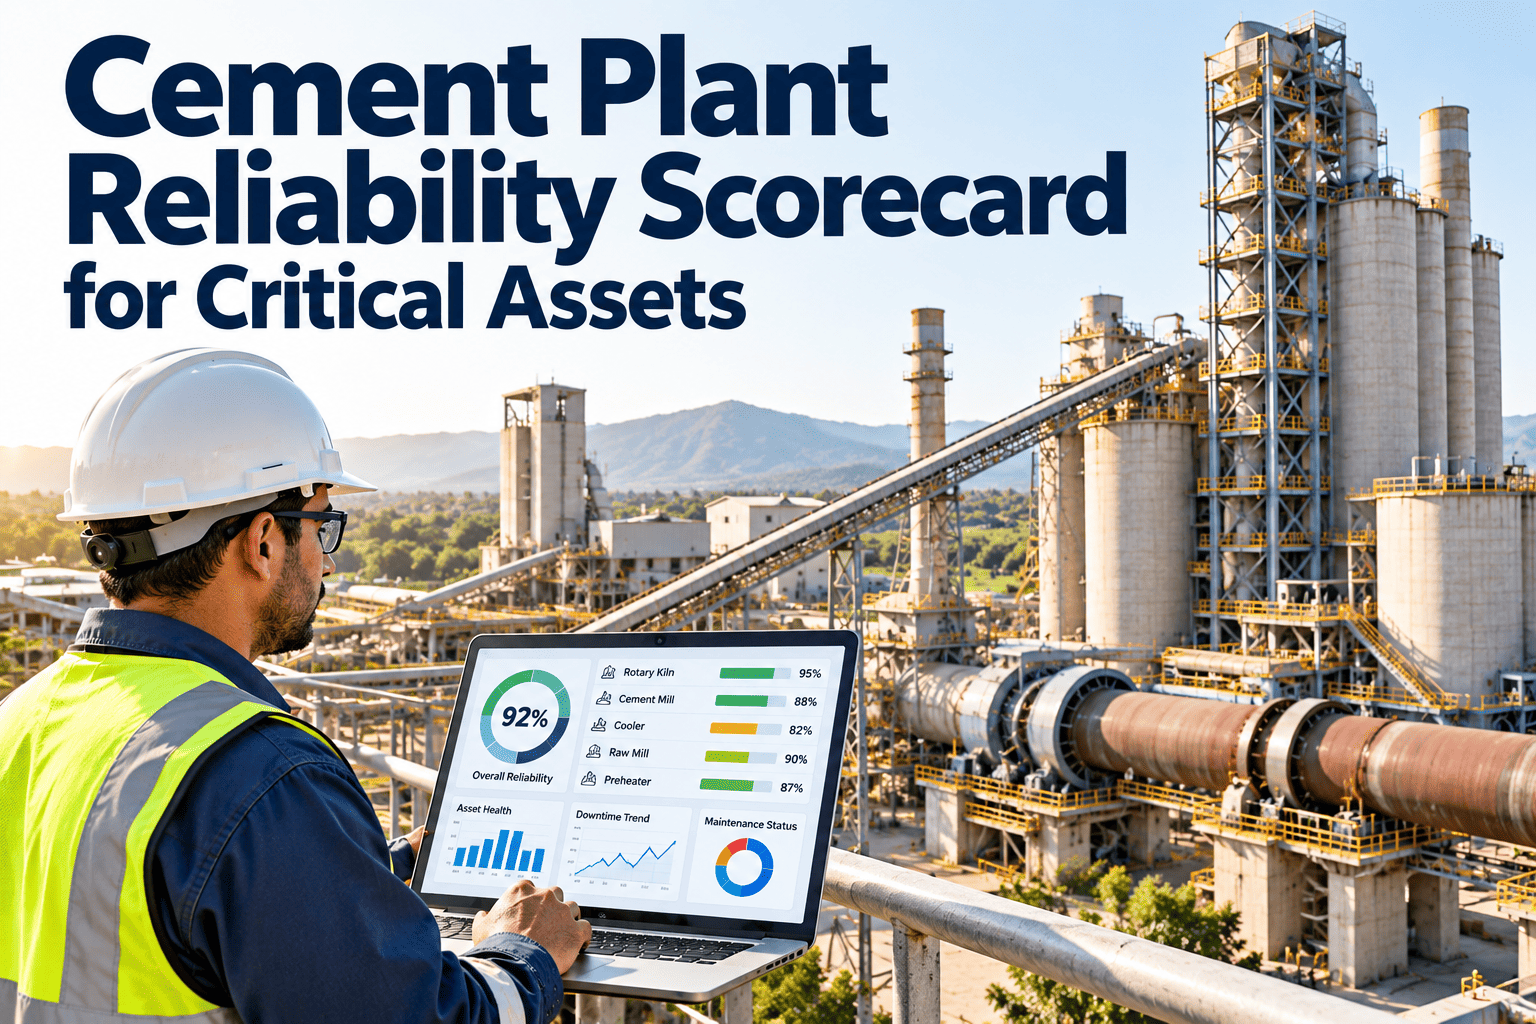
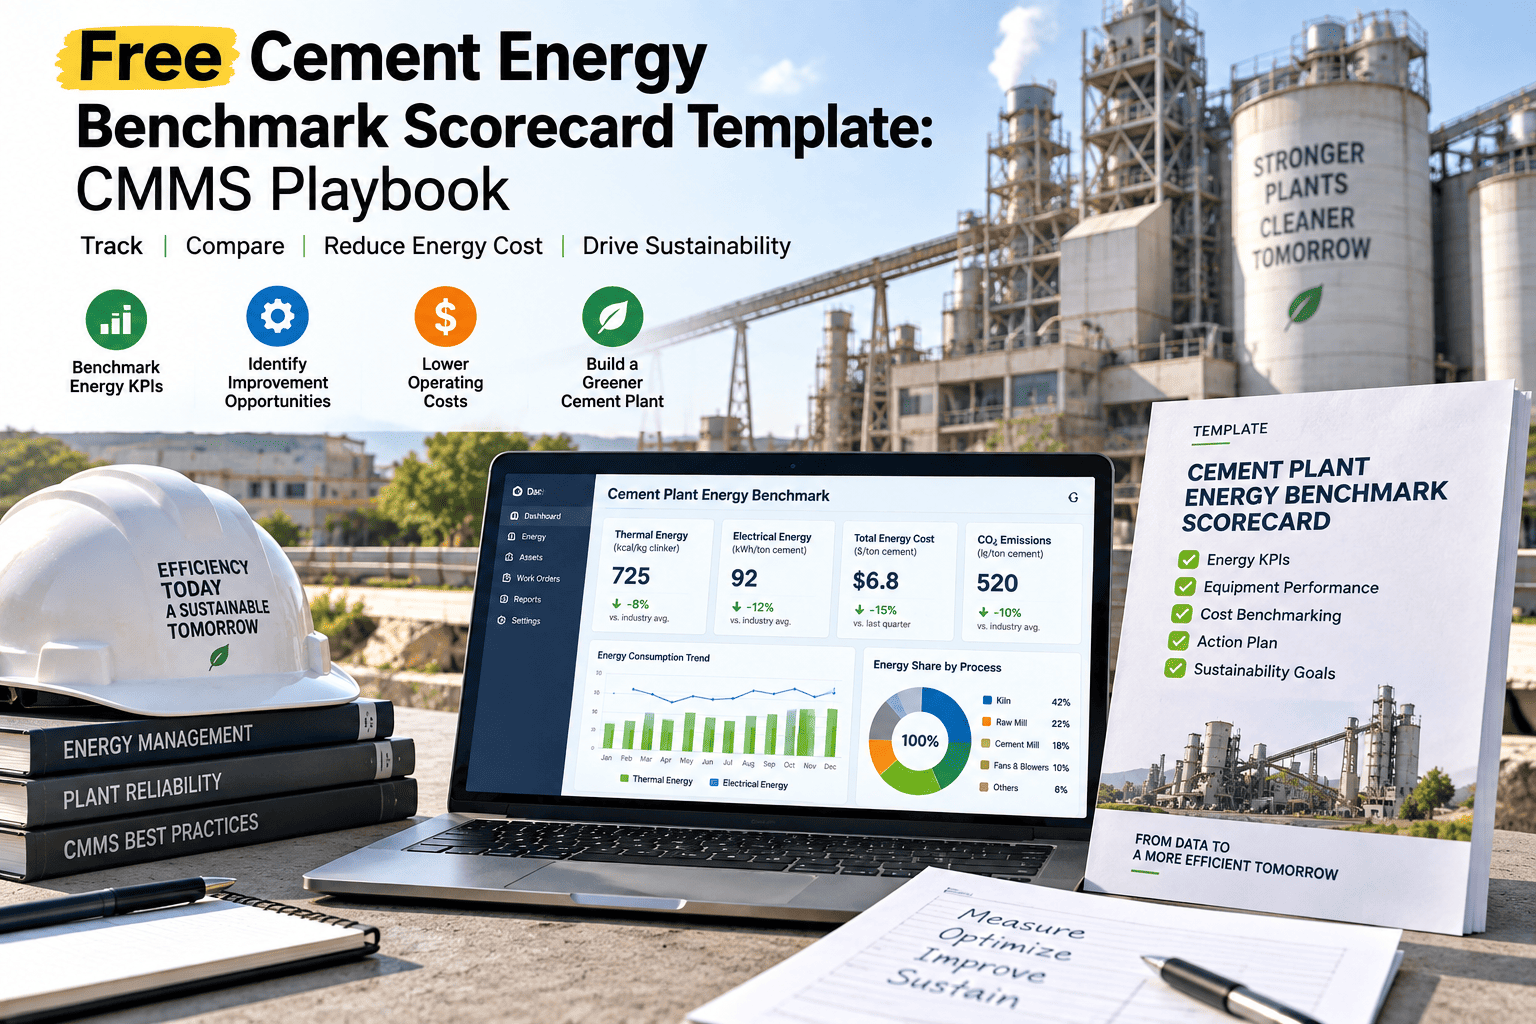
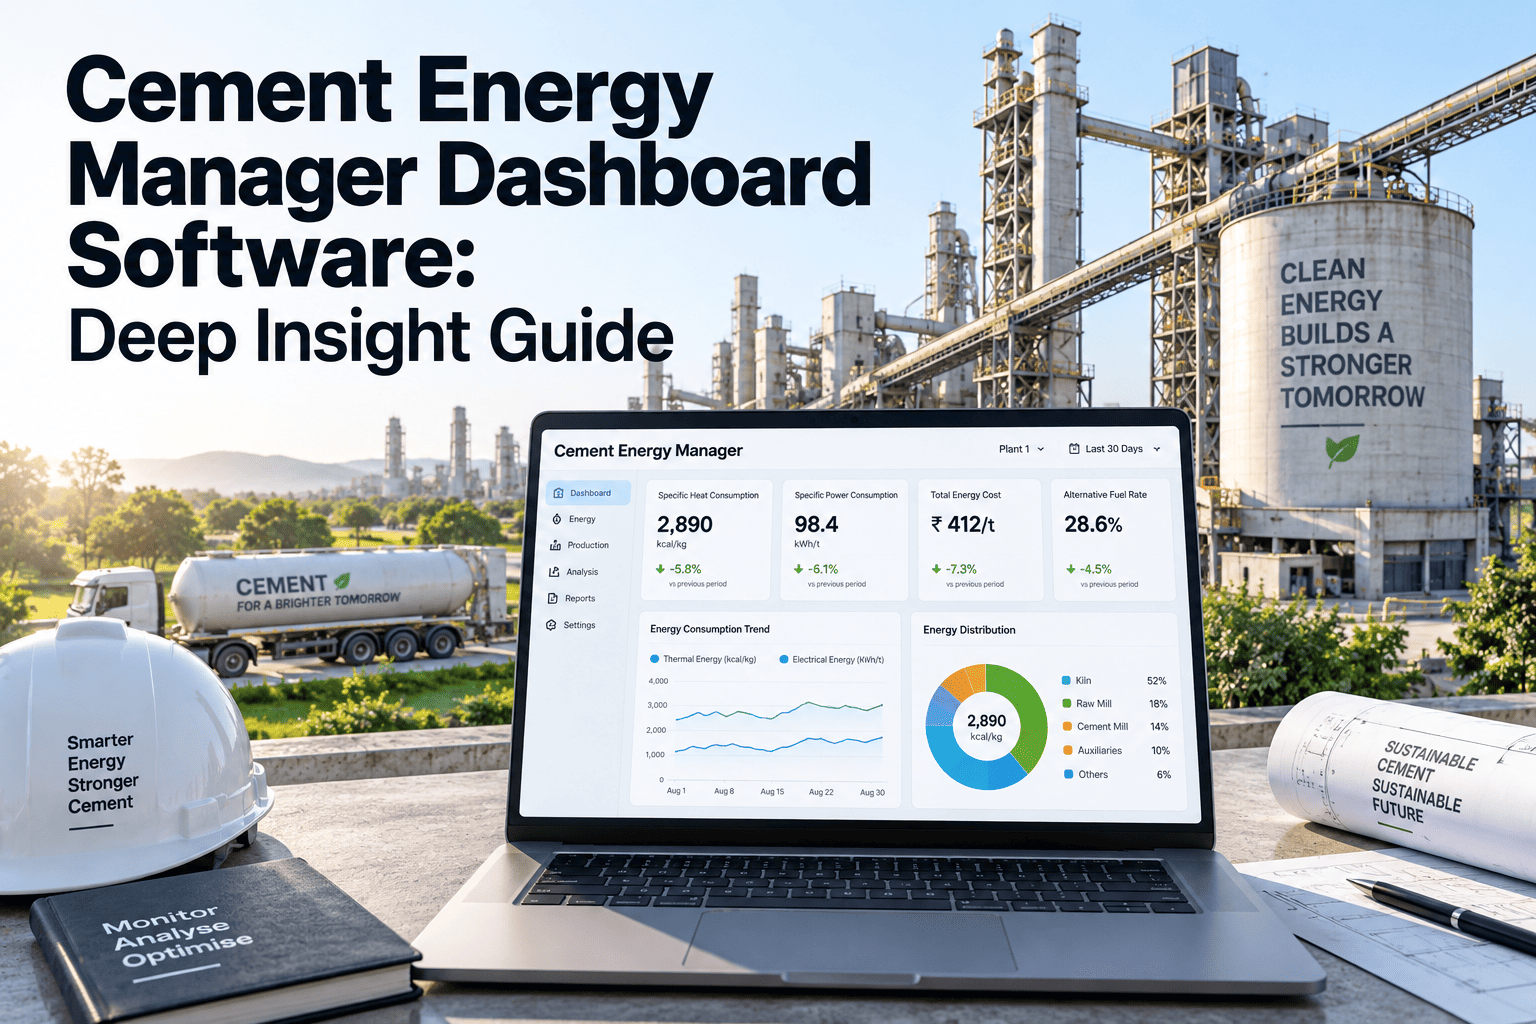
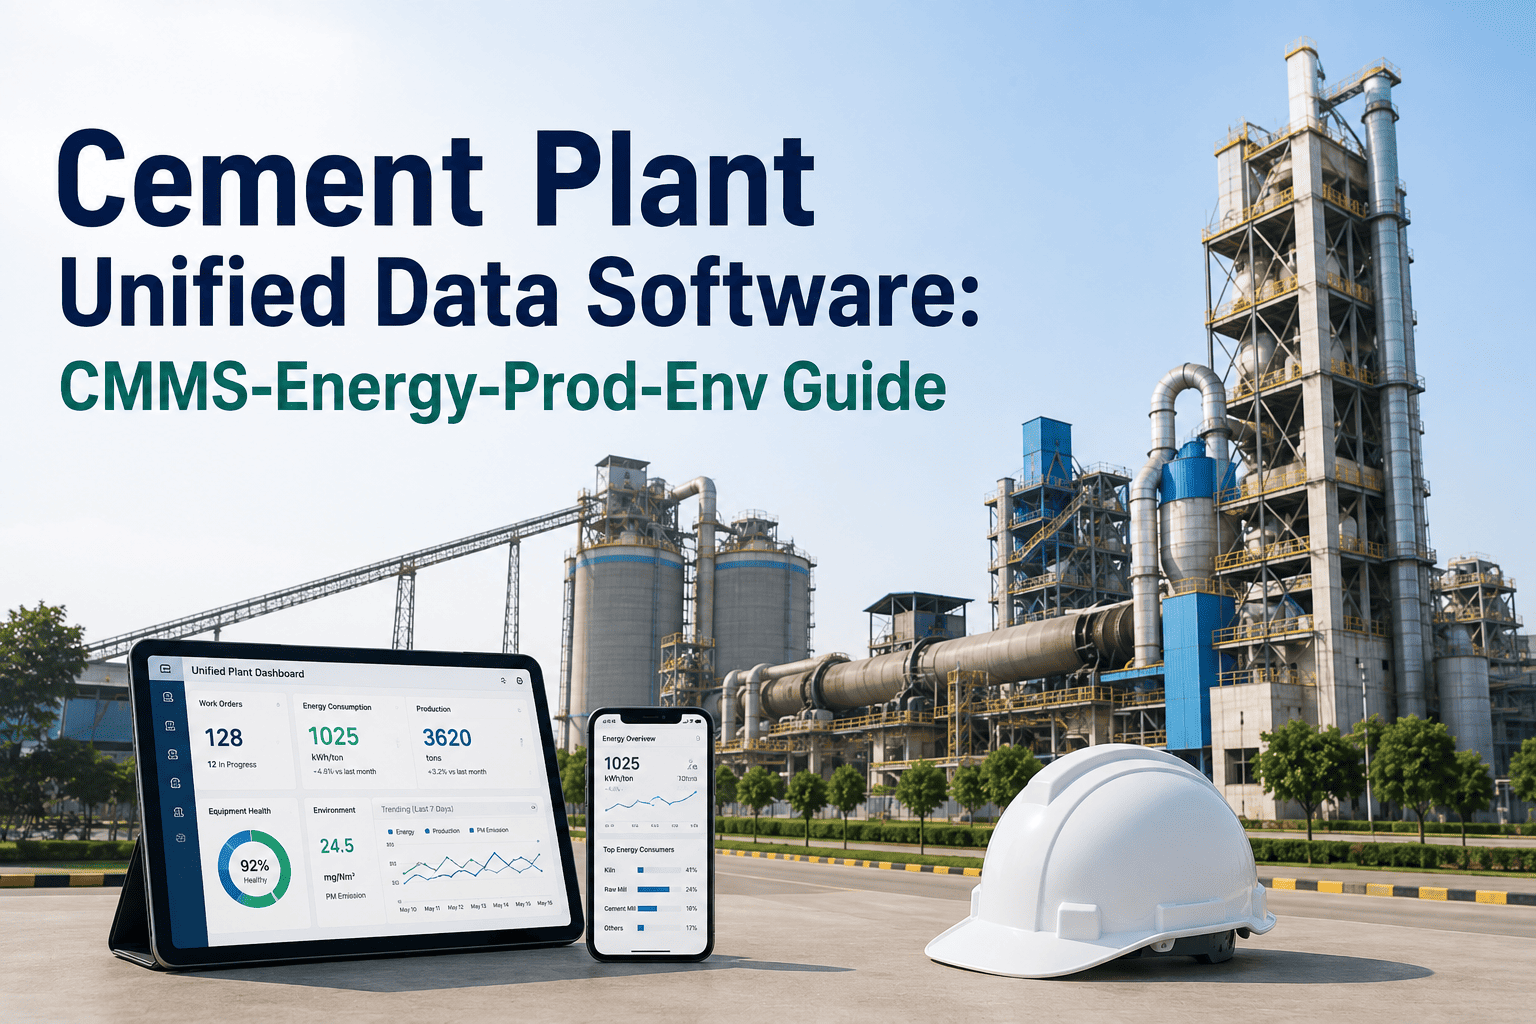
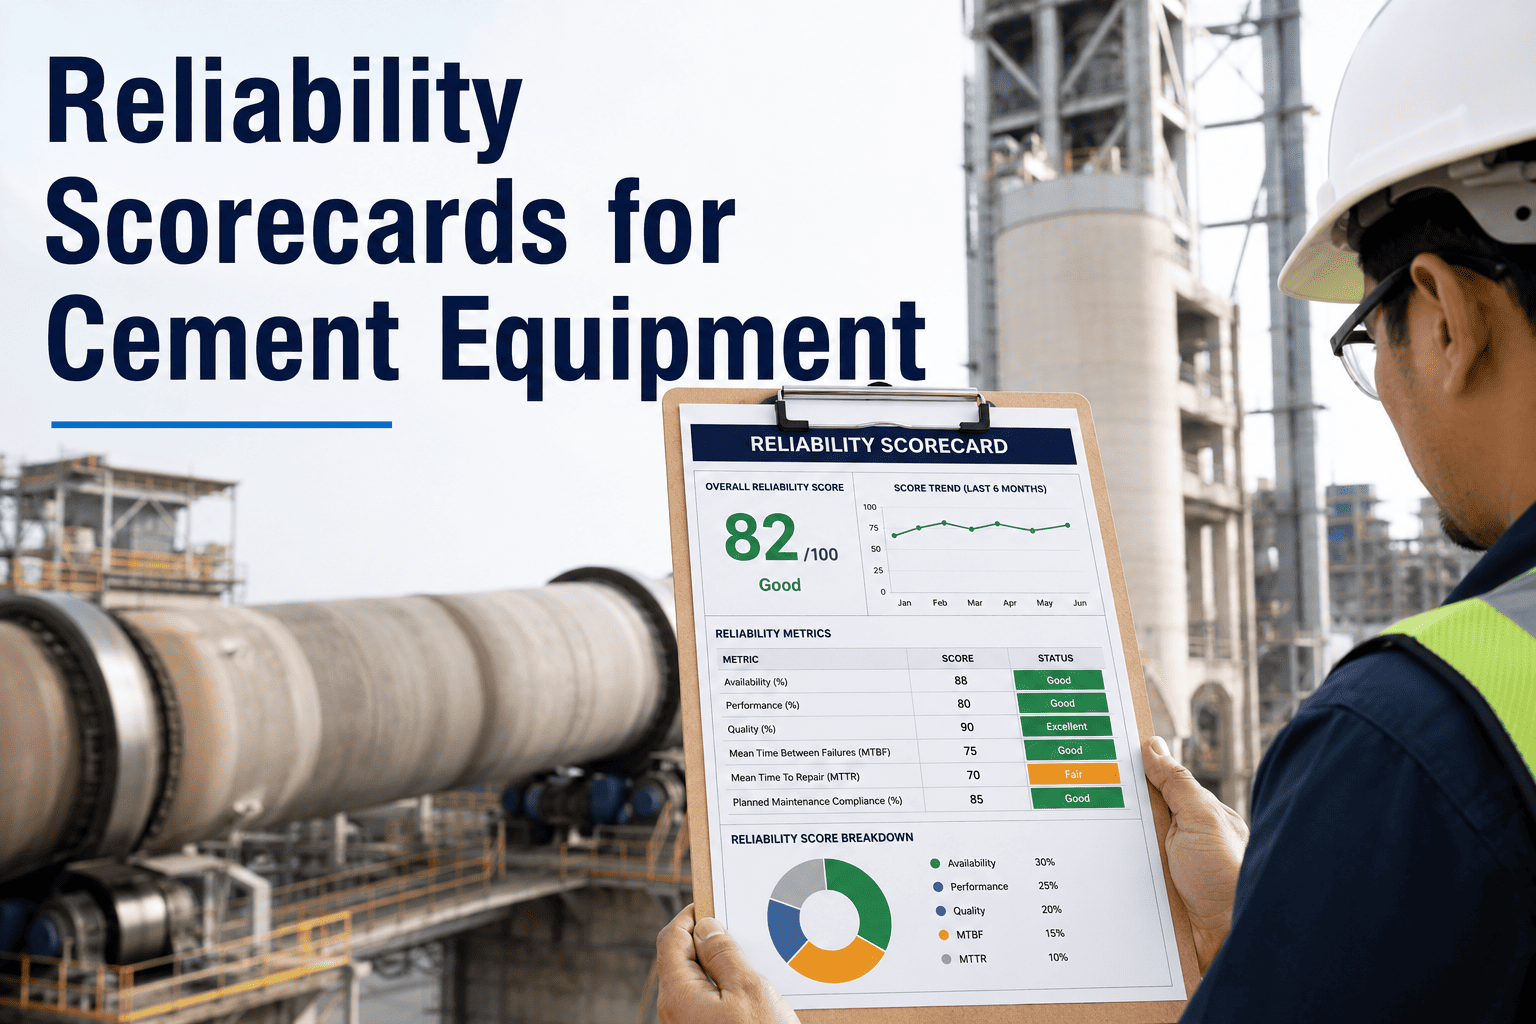
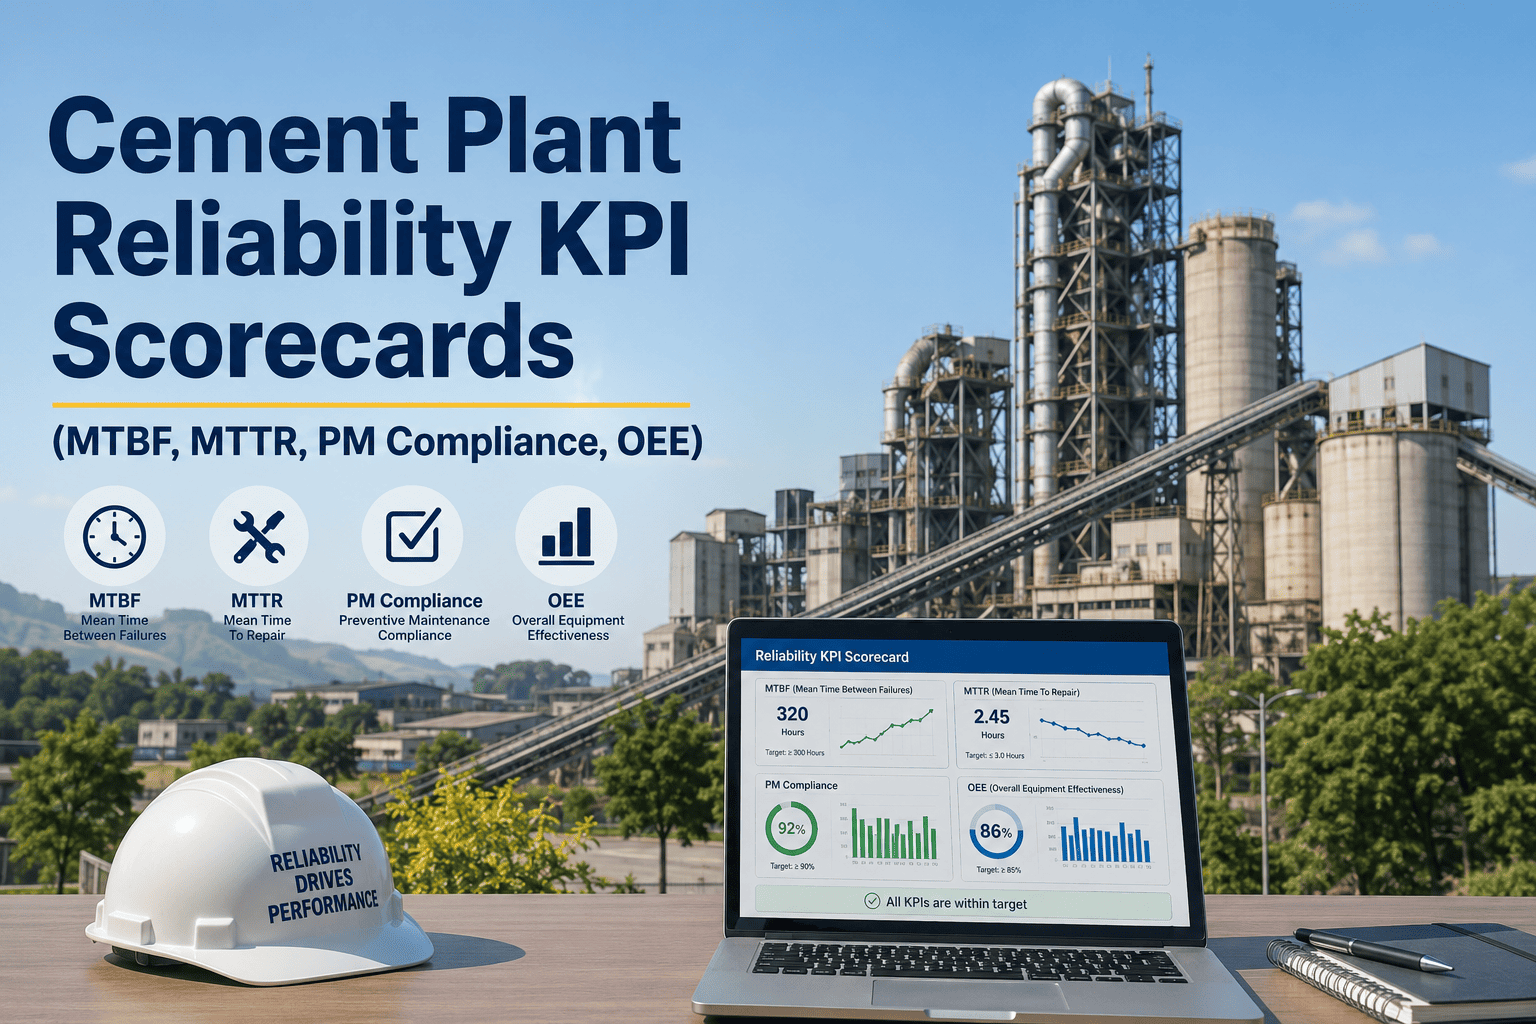
Energy managers walk into board meetings with pages of kcal/kg trends and kWh/tonne breakdowns, and walk out having answered questions about capex instead of energy performance — because a board doesn't read a report, it reads a scorecard. Cement is the third most energy-intensive industrial process in the world, with thermal and electrical energy together making up 60 to 70 percent of production cost per tonne, yet most plants still present that cost as a wall of numbers rather than a single page anyone can act on. Book a demo to see the board-ready energy scorecard built directly from your plant's maintenance and sensor data.
Board Reporting
Cement Plant Energy Score Card Software
6 min read
60–70%
of production cost per tonne comes from thermal and electrical energy combined — the two lines a board scorecard must cover
85–120
kWh/t — the range between best-in-class and global-average electrical SEC that a scorecard should flag immediately
5
metrics is the practical limit for a one-page board card before attention drops off
20–30%
alternative fuel rate target where waste-derived fuel meaningfully cuts cost per tonne against coal-only kilns
Two Halves of the Same Scorecard
A board energy scorecard has to cover both energy channels side by side — thermal performance inside the kiln and electrical performance across grinding and auxiliaries — or the board only sees half the cost story.
Kiln & Fuel Metrics
Thermal SEC and alternative fuel rate together tell the board whether fuel cost per tonne is trending toward best practice or drifting toward the underperformer band that shows up directly in cost of production.
Metrics: kiln thermal SEC, AFR, cooler heat recovery
Electrical Scorecard Half
Grinding & Power Metrics
Electrical SEC and waste heat power recovery together show whether the grinding circuit and auxiliaries are tracking toward the plant's power budget or quietly adding kWh per tonne the plant will pay for at the meter.
Metrics: electrical SEC, grinding kWh/t, WHR output
The One-Page Scorecard, Metric by Metric
Kiln Thermal SEC
705 kcal/kg
Target: 680–750 kcal/kg. Best-practice kilns hold this band; the gap above it is almost always refractory, false air, or burner condition.
Status: On Target
Electrical SEC
118 kWh/t
Target: 85–110 kWh/t. Best-in-class VRM circuits hold 85–95; the global average sits at 110–120.
Status: Watching
Alternative Fuel Rate
24%
Target: 20–30%. Plants in this range see a meaningful reduction in fuel cost per tonne compared with coal-only operation.
Status: On Target
Cooler Heat Recovery
62°C below design
Target: within 20°C of design. Grate and air beam wear typically drives this gap wider each quarter without inspection.
Status: Off Track
Waste Heat Power Recovery
17 kWh/t
Target: 15–22 kWh/t. Reflects how much of the plant's power budget is offset by kiln exhaust and cooler air recovery.
Status: On Target
Cost per Tonne Impact
$1.85/t above budget
The line every tile above rolls up into — the number the board actually votes on when a capex request comes up.
Status: Watching
Building the Scorecard Stack
01
Pick Five Metrics, Not Fifteen
Thermal SEC, electrical SEC, AFR, WHR output, and cost per tonne cover the story. More than that and the board stops reading.
02
Set a Status Threshold for Each
Define what on target, watching, and off track mean numerically for your own plant, not against a generic industry figure.
03
Pull From Live Data, Not Month-End Exports
Connect sensor and maintenance records directly to the scorecard so it reflects this week's condition, not last month's average.
04
Attach the Cost Line to Every Tile
A status color gets attention; a dollar-per-tonne figure next to it is what gets a capex request approved.
Benchmark Tiers for the Scorecard
| Metric |
Best-in-Class |
Global Average |
Underperformer |
| Thermal SEC (kcal/kg clinker) |
680–750 |
780–850 |
Above 900 |
| Electrical SEC (kWh/t cement) |
85–95 |
110–120 |
Above 135 |
| Grinding power (kWh/t, VRM) |
32–38 |
45–60 |
70–85 (worn ball mill) |
| Alternative fuel rate |
25–30% |
10–20% |
Below 10% |
How Oxmaint Powers the Board Scorecard
Platform Overview
Four capabilities turn scattered kiln, mill, and cooler readings into a board-ready page — automatic metric roll-up from live sensor and maintenance data, configurable status thresholds per asset, cost translation for every metric, and a scorecard that refreshes itself instead of being rebuilt every quarter by hand.
Automatic Metric Roll-Up
Configurable Thresholds
Cost-Per-Tonne Translation
Self-Refreshing Scorecard
01
Automatic Metric Roll-Up
Kiln, mill, cooler data combined into one card
Oxmaint pulls thermal SEC, electrical SEC, AFR, and WHR output from connected sensors and maintenance records into a single scorecard, removing the manual spreadsheet step before every board meeting.
02
Configurable Status Thresholds
On target, watching, off track — set per plant
Each metric's threshold is calibrated to your plant's own baseline rather than a generic industry number, so the status colors mean something specific to your equipment.
03
Cost-Per-Tonne Translation
Every metric tied to a dollar figure
A kcal/kg or kWh/t deviation is reported alongside its cost impact, which is the language a board actually uses when approving a capex request.
04
Self-Refreshing Scorecard
Weekly snapshot from continuous data
The card updates from live plant data rather than a month-end export, so the version presented to the board reflects current condition, not a stale average.
Frequently Asked Questions
How many metrics should actually be on a board energy scorecard?
Five is the practical limit. Thermal SEC, electrical SEC, alternative fuel rate, waste heat recovery, and cost per tonne cover the whole energy story without losing the board's attention.
What counts as off track for electrical SEC on the scorecard?
Most plants set the threshold above 120–135 kWh per tonne of cement, since that range typically signals worn mill liners or an incorrect media charge rather than normal variation.
Can the scorecard pull directly from existing plant sensors and CMMS records?
How often should the scorecard be refreshed before a board meeting?
Weekly is enough to catch drift early, but the underlying data should update continuously so the weekly snapshot always reflects current plant condition.
Does a lower-tier plant benefit from this format, or is it only for top performers?
One Page, Five Numbers, One Clear Capex Case
Oxmaint turns continuous kiln, mill, and cooler data into the board scorecard your energy team presents every quarter — built once, refreshed automatically.