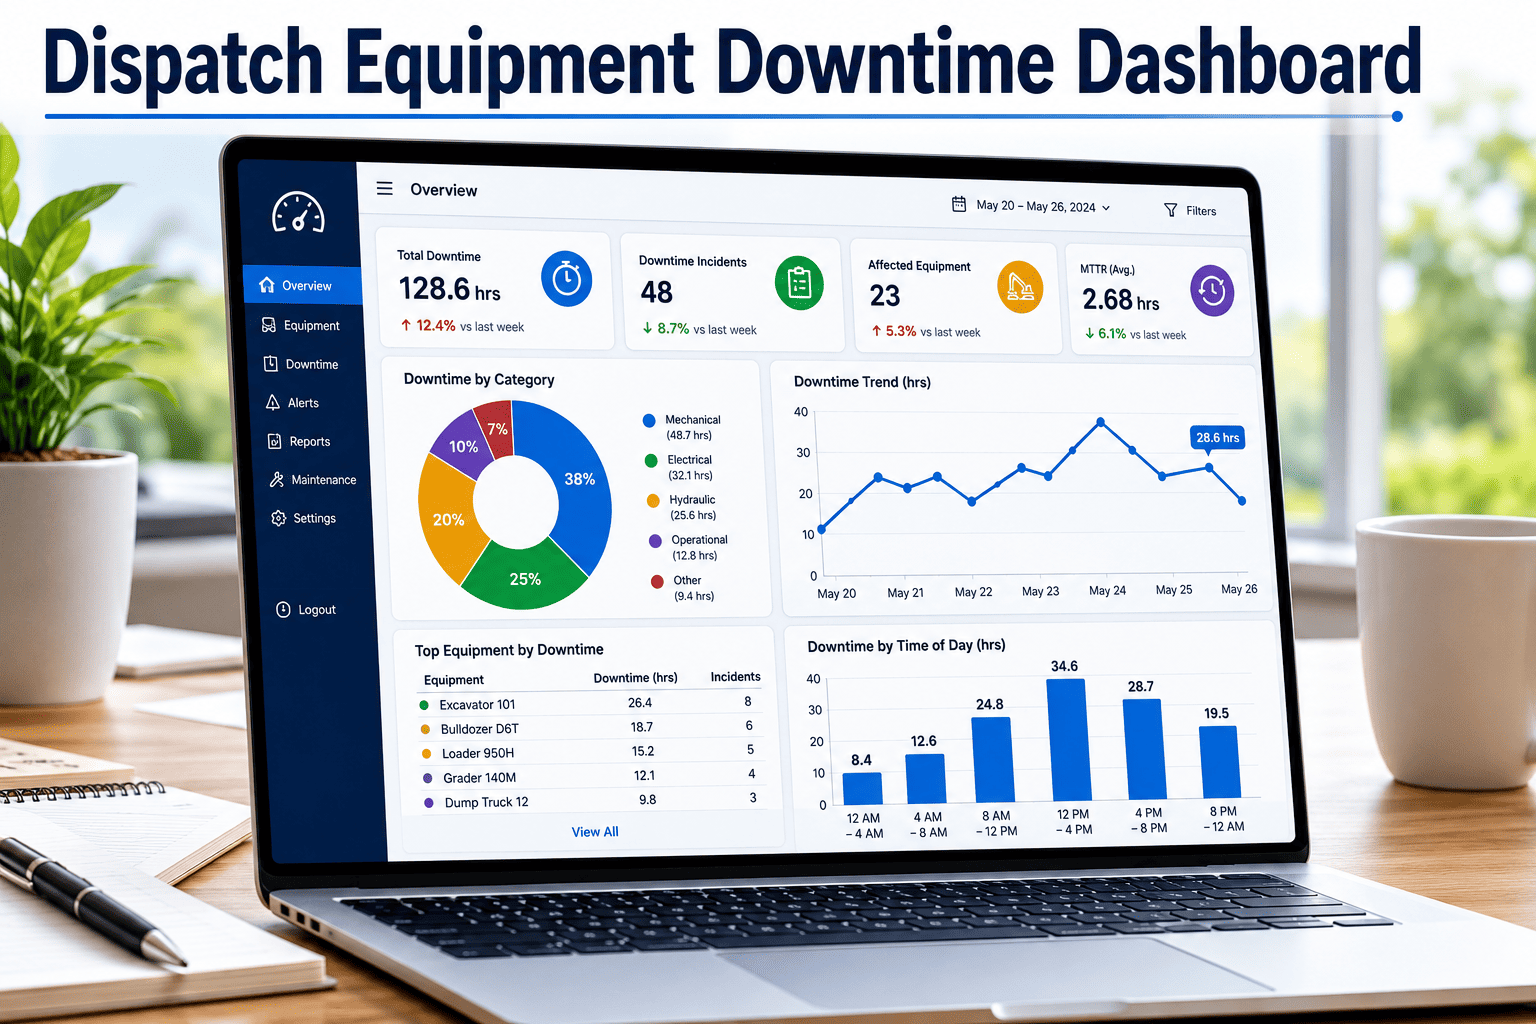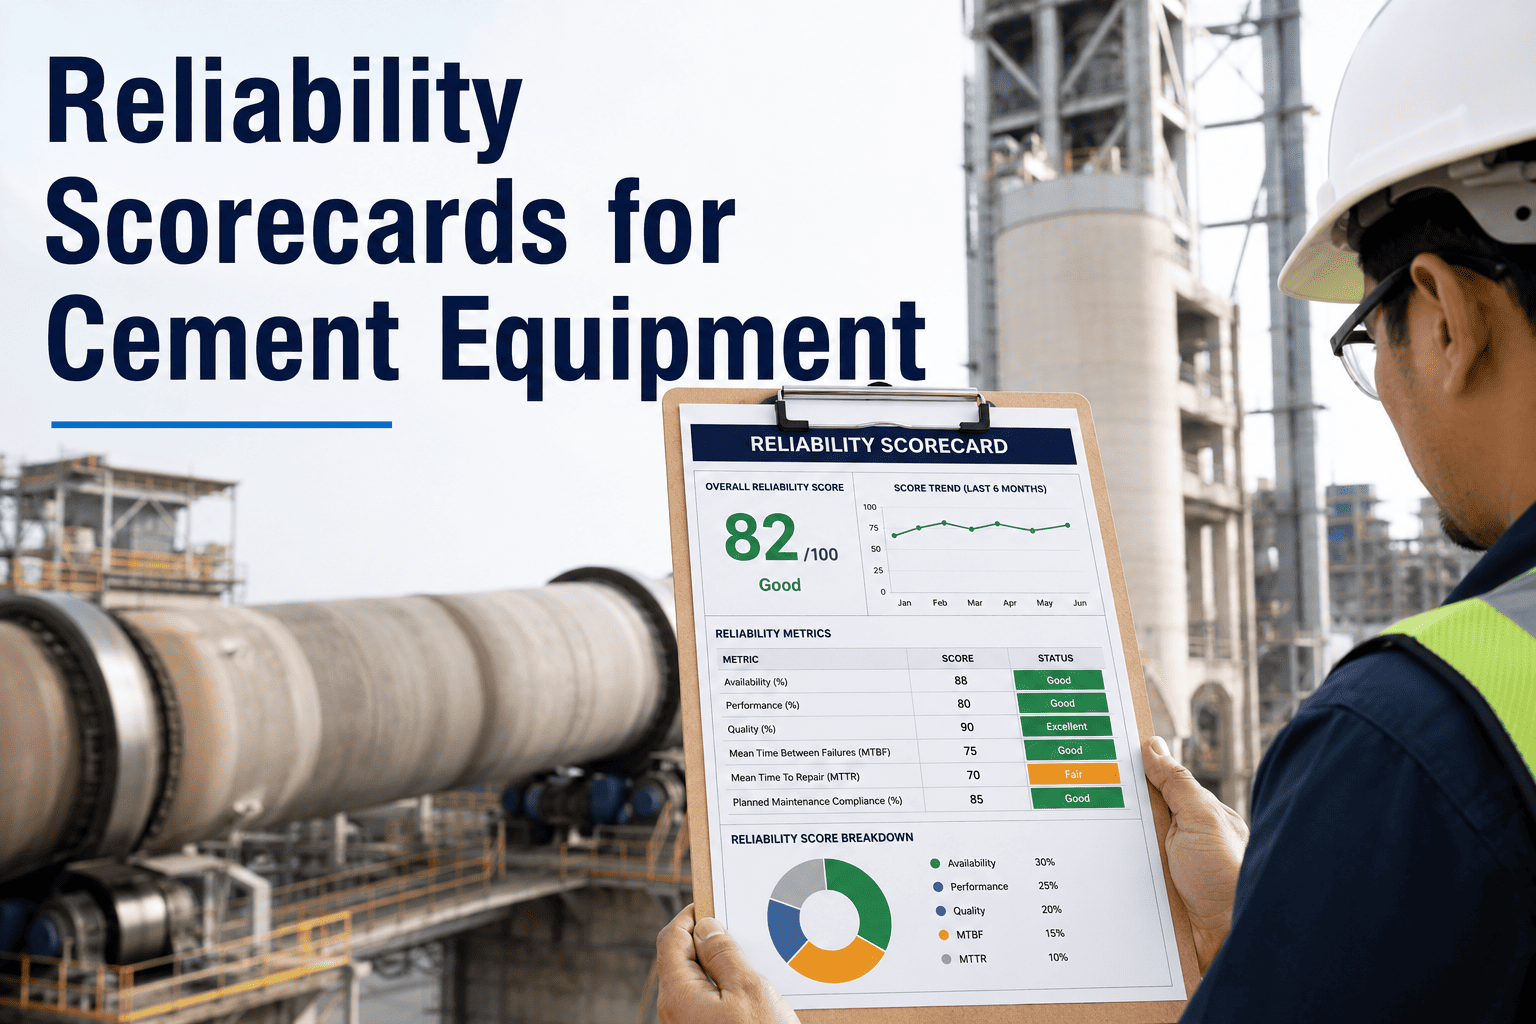
Ask most cement plant maintenance teams how reliable their kiln drive or raw mill actually is, and the answer is usually a guess based on how recently something broke. MTBF, MTTR, downtime hours and cost per ton sit scattered across CMMS reports, shift logs and spreadsheets that nobody reconciles. A reliability scorecard pulls those numbers into one view per equipment area, so a plant manager can see exactly where reliability is improving and where it's quietly getting worse. Start a free trial to build your first scorecard from existing work order history, or book a demo to see live scorecards from cement plants running OxMaint today.
Measure Reliability by Equipment Area — Not Just by Plant
OxMaint scorecards track MTBF, MTTR, downtime and maintenance cost separately for kiln, mill, material handling and utility areas, refreshed automatically from work order data.
What Changes Once Reliability Is Actually Measured
Plants that move from manual downtime logs to automated scorecards typically see the gap close within two to three reporting cycles, simply because the data is now visible to the people who can act on it.
| Metric | Without Scorecards | With OxMaint Scorecards |
|---|---|---|
| Kiln Drive MTBF | Tracked quarterly, manually | Live, updated per work order |
| Average MTTR | Estimated from memory | Calculated from logged repair time |
| Unplanned downtime / month | Reconstructed after the fact | Running total by equipment area |
| Maintenance cost / ton clinker | Finance report, monthly lag | Updated as work orders close |
| Repeat failure visibility | Found during RCA, after the fact | Flagged automatically on the scorecard |
Reliability Scored Separately by Equipment Area
A single plant-wide reliability number hides where the actual problem sits. OxMaint splits the scorecard into the four areas that drive most cement plant downtime.
See Which Equipment Area Is Actually Dragging Down Reliability
Stop relying on one plant-wide number. Score reliability by area and find out where the next CapEx dollar should actually go.
Building a Scorecard from Existing Work Order Data
The plants that get the most out of reliability scorecards are the ones that stop reviewing them only after a major failure. Monthly review by equipment area, not just plant-wide, is what actually catches a slipping MTBF before it becomes an unplanned kiln stop.
Frequently Asked Questions
Do we need to re-enter historical failure data to start scoring reliability?
Can scorecards be filtered by shift, line or specific kiln?
How often do the metrics refresh?
Can scorecard data be exported for management or board reporting?
What's a realistic MTBF target for a cement kiln drive?
Turn Work Order History Into a Reliability Scorecard You Can Actually Act On
Track MTBF, MTTR, downtime and cost by equipment area, automatically, from the work orders your team is already closing every day.