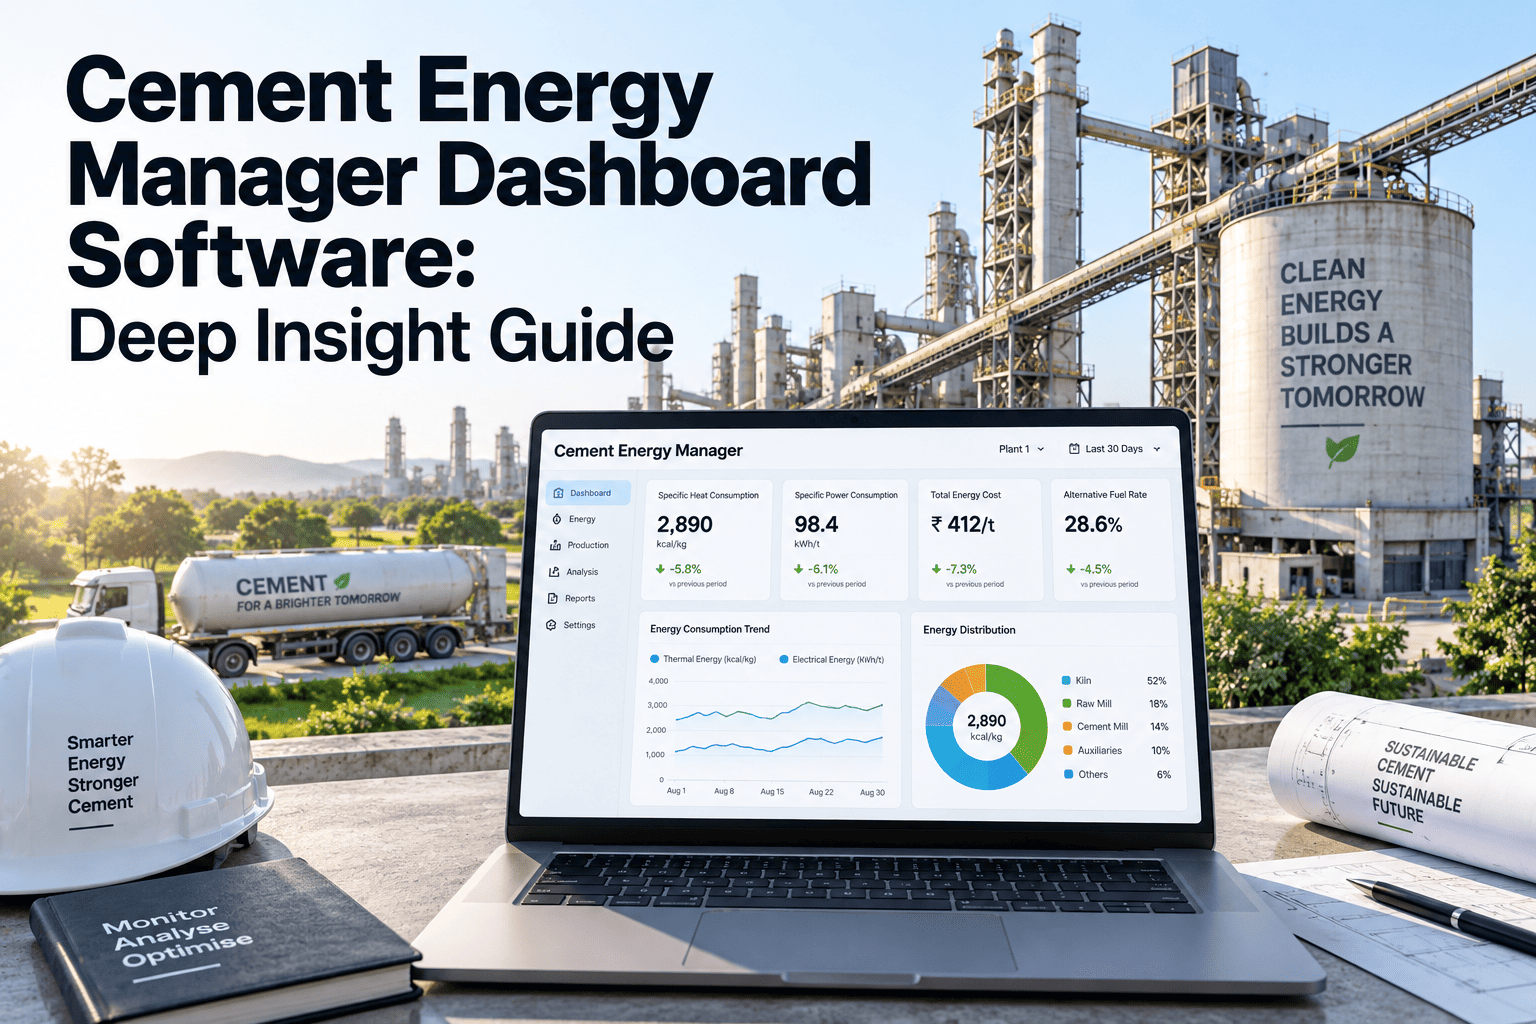
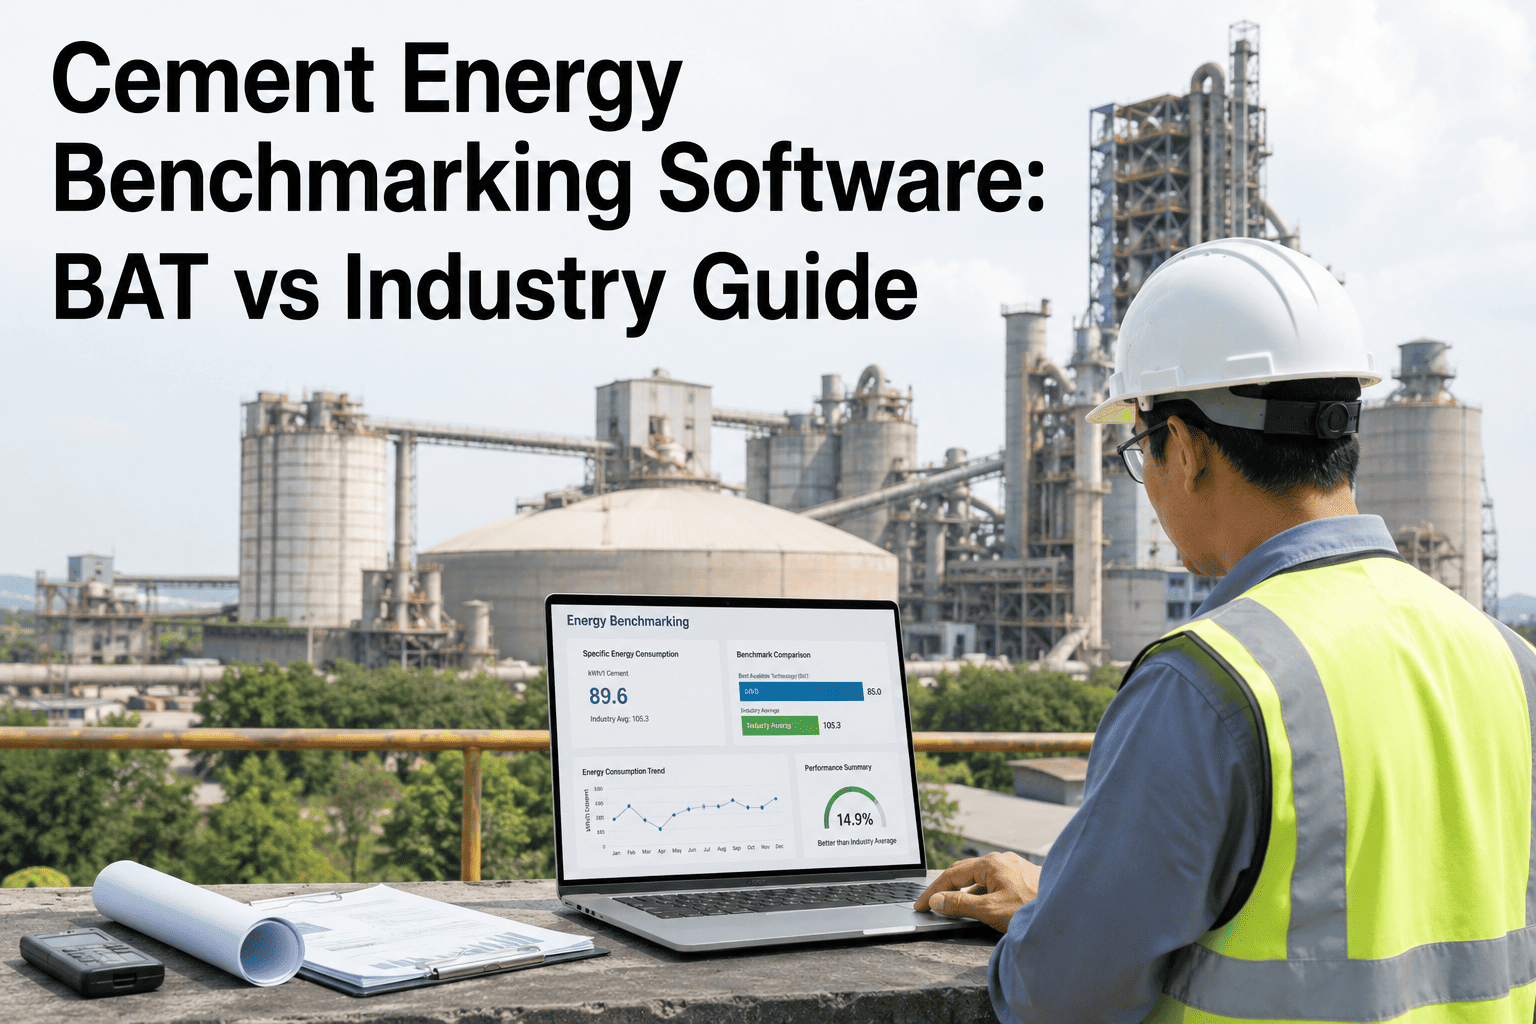
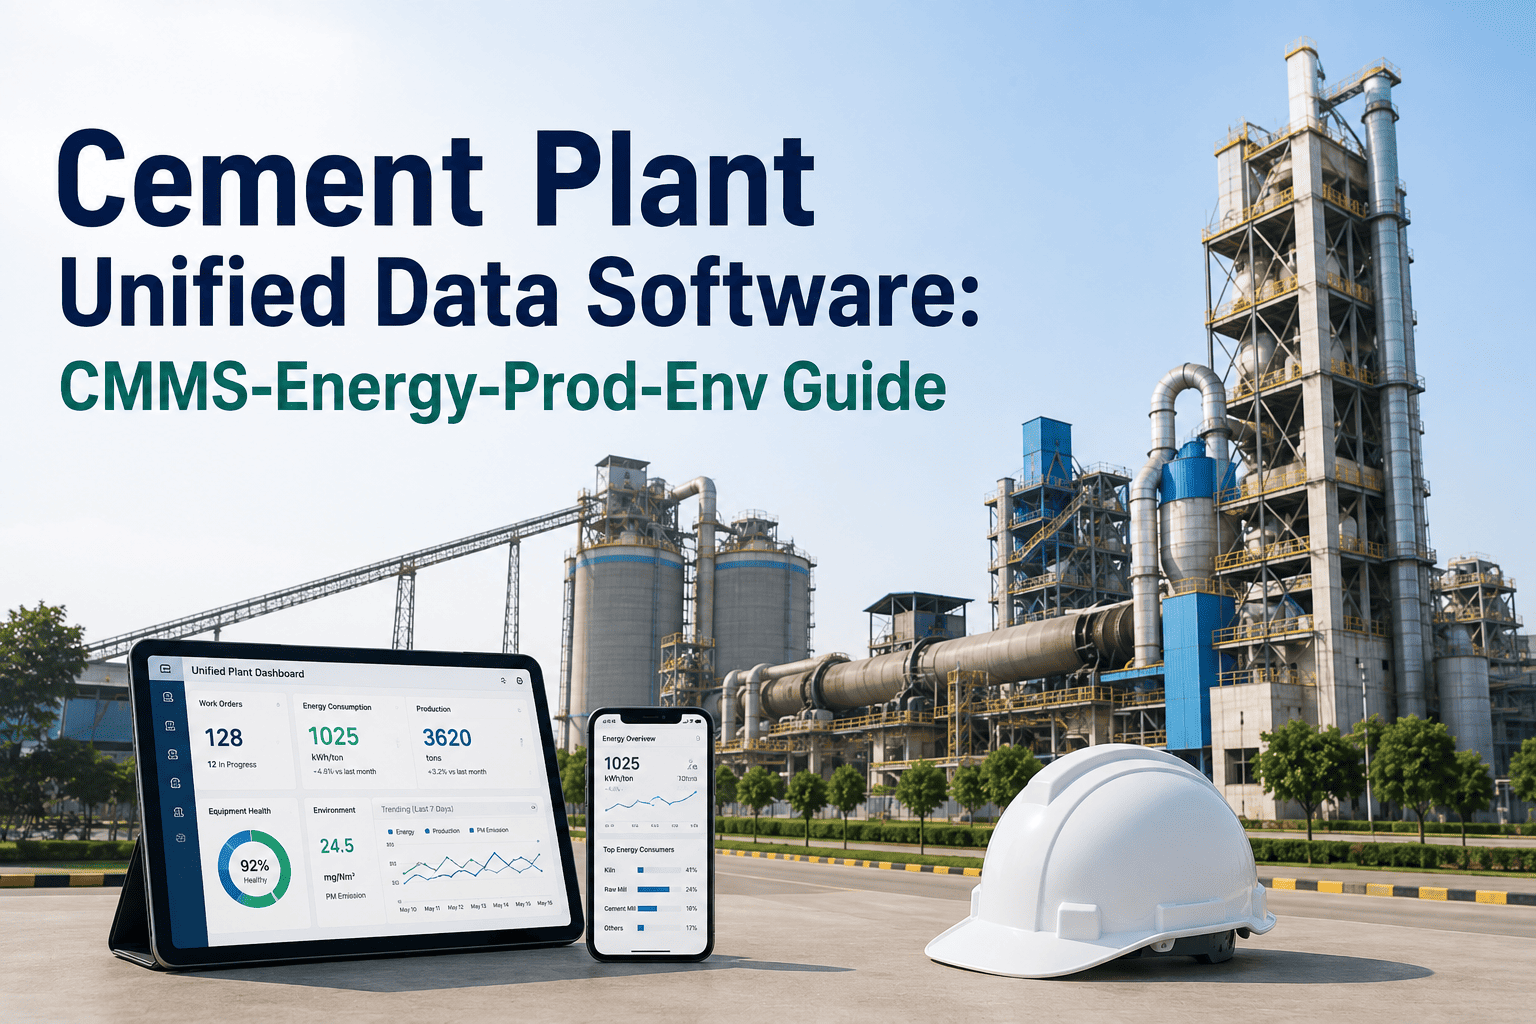
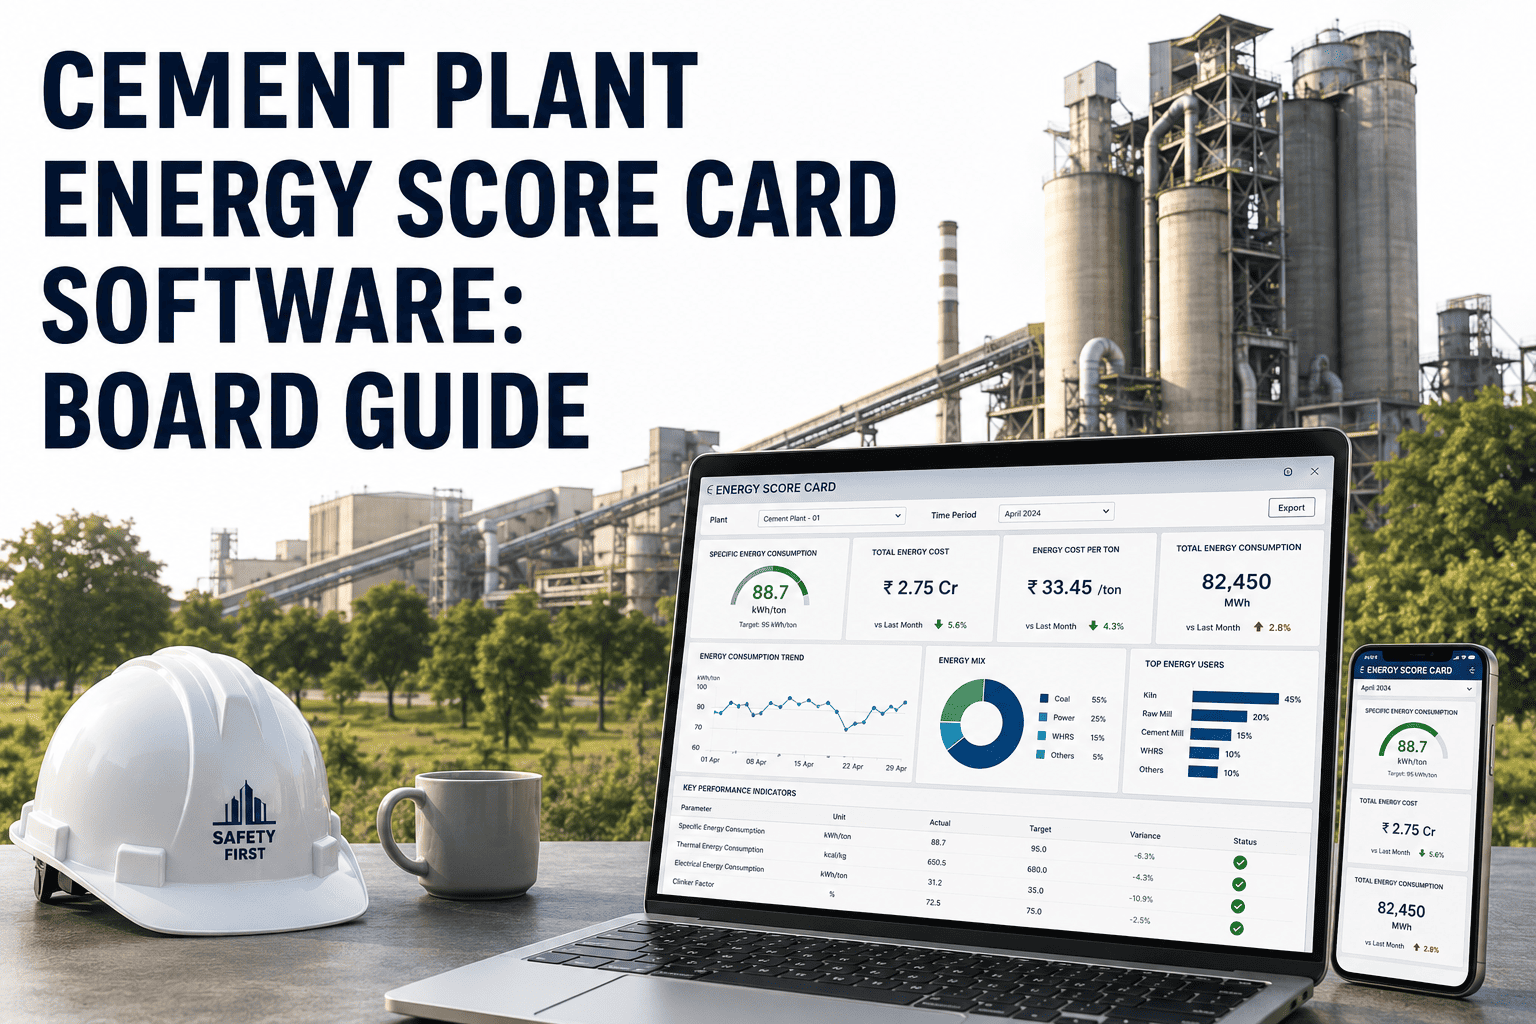
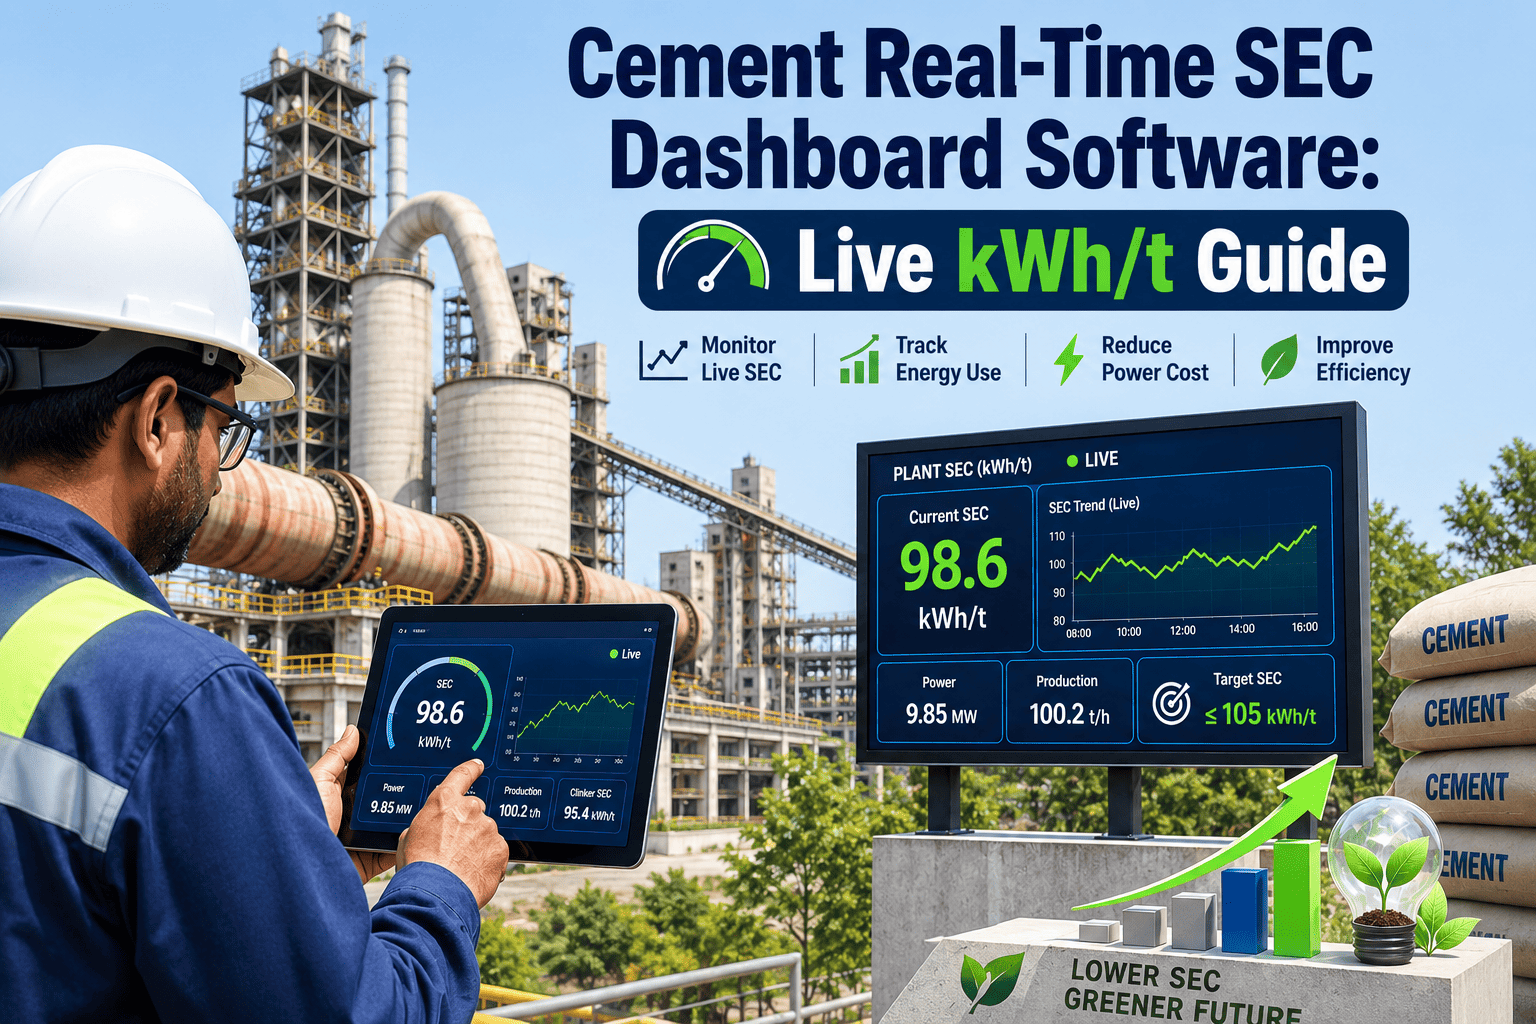
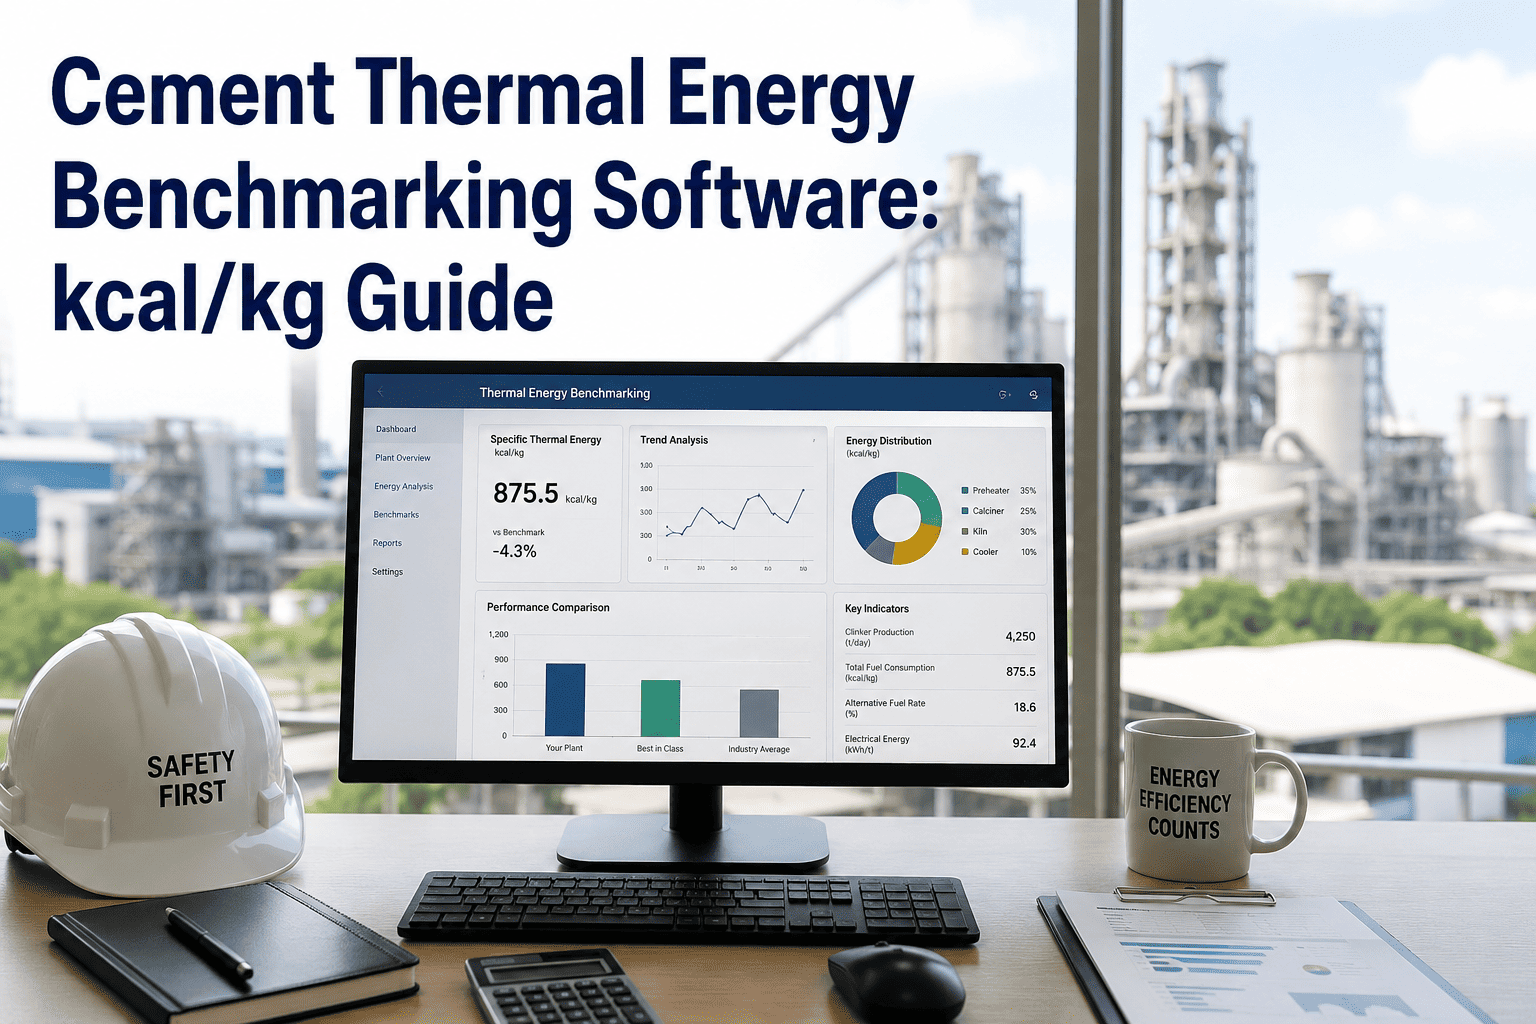
Looking for the best cement energy manager dashboard software in 2026? OxMaint delivers a purpose-built CMMS platform trusted by cement plants and heavy-industry operators worldwide. Our software helps energy managers track kWh, kcal, kVAR, and CO2 metrics across kilns, mills, and conveyors from one unified dashboard. With real-time monitoring, automated shift reporting, and IoT integrations, OxMaint eliminates manual spreadsheets and puts actionable energy intelligence at your fingertips. Whether you run a single plant or multi-site portfolio, OxMaint helps cut energy waste and stay audit-ready across every shift. Start your free trial or book a demo to see why leading operators choose OxMaint.
Energy Metrics That Cement Plant Managers Track Daily
Cement plants run highly energy-intensive processes across every shift and production line. These KPIs help energy managers control costs, spot abnormal consumption, and support compliance.
60-110
kWh per tonne cement
Electrical Energy Range
3.0-4.5
GJ per tonne clinker
Thermal Energy Range
0.85-0.97
Power Factor
Reactive Power Target
0.62-0.90
t CO2 per t clinker
Carbon Emission Range
Why Cement Plants Need Dedicated Energy Dashboards
Cement manufacturing is highly energy intensive. Plants use large amounts of fuel and electrical power across grinding, pyroprocessing, conveying, and packaging.
Without a centralized dashboard, energy data is often spread across SCADA logs, utility invoices, production reports, and maintenance spreadsheets. That fragmentation can hide wasted energy, equipment degradation, power-factor issues, and compliance gaps.
A CMMS-based energy dashboard connects energy performance with maintenance activity. A degrading kiln burner can raise thermal consumption, while a worn roller-mill bearing can increase electrical demand.
OxMaint surfaces these trends alongside work orders so energy managers and reliability engineers can act from the same data.
The result is a closed-loop workflow: energy anomalies trigger maintenance actions, and completed work is reflected in energy performance trends.
For continuous-process plants, connected energy and maintenance data also helps teams refine baselines, monitor targets, and improve response over time.
Common Energy Management Challenges in Cement Plants
Cement plants manage multiple energy sources, including grid electricity, captive power, coal, petcoke, natural gas, and alternative fuels. Three-shift operations also require continuous monitoring rather than periodic manual reviews.
Dust, vibration, temperature, sensor drift, and communication failures can further affect data quality. A dedicated dashboard helps teams keep energy information organized and visible.
Emissions reporting requires reliable data, while energy allocation across grinding, pyroprocessing, and packing needs granular metering. Seasonal demand and production-mix changes can also shift consumption patterns.
A unified dashboard reduces reliance on manual calculations and disconnected spreadsheets by bringing these energy workflows into one operational view.
Core Capabilities of OxMaint Cement Energy Dashboard
Real-Time Energy Monitoring
OxMaint ingests live data streams from power meters, thermal flow meters, and stack emission analyzers across every production line. Electrical consumption, thermal heat input, reactive power demand, and CO2 emission rates update every minute so energy managers see current shift performance against targets without manual refresh or report exports.
Shift-Level Energy Reporting
Each operating shift carries its own energy signature. Day shift operations differ from night shift due to ambient temperature variations, production mix changes, and crew operating habits. OxMaint auto-generates shift energy reports comparing performance across teams so supervisors identify best practices and coach underperforming shifts with data-driven evidence instead of subjective intuition.
Asset-Level Energy Attribution
Knowing total plant energy consumption is useful but knowing which individual asset consumes what percentage of that total is transformative. OxMaint attributes energy consumption to individual kilns, raw mills, cement mills, crushers, and compressors so managers prioritize efficiency investments where returns are highest rather than guessing which equipment wastes the most energy.
Automated Threshold Alerts
Define upper and lower energy limits for every metered point and every monitored asset. When consumption breaches configured thresholds, OxMaint pushes alerts to dashboards, mobile devices, and maintenance team inboxes simultaneously. Early detection prevents small inefficiencies from snowballing into costly equipment failures that drain both energy budgets and asset life expectancy.
Integrated Maintenance Triggers
When energy anomalies persist beyond configurable time durations, OxMaint automatically generates maintenance work orders linked to the affected assets and meters. This closes the feedback loop between energy monitoring and corrective maintenance action without manual handoffs, email chains, or phone calls between departments.
Compliance and Audit Readiness
OxMaint maintains continuous energy consumption logs with tamper-proof timestamps aligned to ISO 50001 energy management system requirements. When auditors request historical energy performance records, your team exports complete shift-level histories from the dashboard in minutes instead of spending weeks on manual data compilation from disparate sources.
Energy KPI Tracking Matrix
Track these daily KPIs in one dashboard and connect abnormal readings to maintenance actions.
| KPI | Unit | Typical Range | Best Target | Alert Threshold |
| Specific Electrical Energy |
kWh/t cement |
60 - 110 |
Below 75 |
Above 90 |
| Specific Thermal Energy |
GJ/t clinker |
3.0 - 4.5 |
Below 3.3 |
Above 3.8 |
| Power Factor |
Ratio |
0.80 - 0.97 |
Above 0.95 |
Below 0.90 |
| CO2 Emission Rate |
t/t clinker |
0.62 - 0.90 |
Below 0.70 |
Above 0.80 |
| Kiln Thermal Efficiency |
Percent |
45 - 65 |
Above 58 |
Below 50 |
| Mill Specific Consumption |
kWh/tonne |
25 - 45 |
Below 30 |
Above 38 |
| Compressor Specific Power |
kW/100cfm |
15 - 25 |
Below 18 |
Above 22 |
| Alternative Fuel Rate |
Percent |
0 - 60 |
Above 30 |
Below 15 |
Stop Losing Energy Savings to Fragmented Data
Fragmented energy data and delayed alerts cost cement plants millions annually. OxMaint gives your team real-time visibility across all four energy dimensions, automated shift reporting, and integrated maintenance triggers in one powerful CMMS platform. Join leading cement operators who have already transformed their energy management approach with OxMaint.
How OxMaint Cement Energy Dashboard Works
OxMaint connects existing metering infrastructure to the energy dashboard in five steps, creating a closed-loop workflow without replacing current instrumentation.
1
Connect Metering Infrastructure
Link existing power meters, thermal flow meters, stack emission analyzers, and IoT vibration sensors to OxMaint through standard industrial communication protocols including OPC UA, Modbus TCP, MQTT, and BACnet. No rip-and-replace of current instrumentation is required. OxMaint integrates with the metering infrastructure you already have deployed across your plant floor.
2
Configure Energy Assets and Meters
Map each connected meter to its corresponding physical asset, production line, department, and cost center. Set energy baselines from historical data, define threshold limits for each metric, and configure reporting periods aligned to your plant operating schedule and shift rotation structure.
3
Monitor Real-Time Dashboard Views
Energy managers access the dashboard to view live electrical, thermal, reactive power, and emission metrics organized by plant area, production line, or individual asset. Color-coded status indicators highlight normal, warning, and critical operating states at a single glance without drilling through multiple screens.
4
Act on Automated Alerts and Work Orders
When energy thresholds are breached, alerts fire instantly across dashboards and mobile devices while maintenance work orders generate automatically. Teams respond faster because full context travels with every alert including asset identification, current meter readings, and assigned corrective procedures.
5
Review Reports and Optimize Continuously
Automated shift-end reports compare actual energy consumption against established baselines and targets. Monthly and quarterly roll-up reports reveal long-term efficiency trends, seasonal consumption patterns, and improvement trajectories that inform capital planning decisions and energy procurement contract negotiations.
Before and After OxMaint Energy Dashboard
Before OxMaint
- Energy data is spread across bills, logs, and spreadsheets.
- Shift teams track consumption manually.
- Energy and maintenance systems remain disconnected.
- Anomalies can stay hidden until periodic reviews.
- Audit preparation requires manual data gathering.
After OxMaint
- Real-time energy metrics stay visible across production lines.
- Automated shift reports replace manual tracking.
- Energy alerts connect directly to maintenance workflows.
- Threshold breaches surface quickly.
- Historical records are ready for reporting and audits.
With connected energy and maintenance data, teams can improve visibility, response time, and reporting consistency across shifts.
Automated logging reduces manual compliance work, while historical baselines help teams refine targets and track progress over time.
Industry Energy Benchmarks and Targets
Industry benchmarks help energy managers set measurable improvement targets. Electrical consumption can range from 60–110 kWh per tonne of cement, while thermal consumption typically ranges from 3.0–4.5 GJ per tonne of clinker, depending on process configuration and kiln technology.
Best-in-class targets can be used as reference points when setting plant-specific goals.
OxMaint plots plant performance against benchmark ranges so managers can identify gaps, prioritize improvement areas, and track progress over time.
Dashboard ROI and Business Impact
A cement energy manager dashboard can improve financial visibility by connecting energy consumption, alerts, and maintenance actions.
Automated alerts help teams respond to abnormal consumption sooner, while integrated work orders reduce manual handoffs for energy-related equipment issues.
Real-time kVAR monitoring helps teams identify power-factor issues before they become larger cost concerns. Continuous logging can also reduce the manual effort required to prepare audit records.
The business case should be evaluated against each plant's energy costs, penalties, maintenance workload, and compliance requirements.
Who Benefits from Cement Energy Dashboard Software
Plant Energy Managers
Gain a single dashboard that replaces spreadsheets, utility portals, and manual calculations with real-time metrics and automated reporting. They manage energy as a controllable operational variable instead of a fixed cost center reviewed only monthly.
Reliability Engineers
See energy anomalies translated directly into actionable work orders. Equipment degradation manifesting as rising consumption gets caught early before causing unplanned downtime or catastrophic failure on critical kiln and mill assets.
Plant Managers and Directors
Access executive-level energy summaries comparing performance across shifts, production lines, and multiple plant sites. They make capital allocation decisions based on actual energy savings potential rather than vendor claims.
EHS and Sustainability Teams
Track carbon dioxide emission rates continuously and generate compliance reports aligned to environmental regulations and corporate sustainability commitments. Audit preparation becomes a dashboard export instead of a multi-week project.
Finance and Procurement
Correlate energy consumption data with utility billing to verify invoice accuracy and identify billing discrepancies. They negotiate procurement contracts armed with actual consumption profiles instead of estimated demand curves.
Frequently Asked Questions
What energy metrics does OxMaint cement energy dashboard track?
OxMaint tracks electrical energy in kWh, thermal energy in kcal and GJ, reactive power in kVAR, and CO2 emissions in tonnes per tonne of clinker. All metrics update in real time and aggregate into automated shift and monthly reports. Explore the full capability set when you
sign up at OxMaint.
Can OxMaint integrate with existing plant metering and SCADA systems?
OxMaint connects to power meters, flow meters, emission analyzers, and SCADA systems through OPC UA, Modbus TCP, and MQTT protocols. No replacement of existing instrumentation is needed.
Schedule a technical integration review through our demo booking page.
How does the dashboard connect energy anomalies to maintenance actions?
When consumption breaches configurable thresholds for a defined duration, OxMaint generates a maintenance work order linked to the affected asset and meter automatically. This closes the loop between detection and action without manual intervention.
Start your free trial to experience this workflow.
Is OxMaint suitable for multi-site cement operations?
OxMaint supports single-plant and multi-site deployments with consolidated dashboards comparing energy performance across all locations. Plant managers and corporate teams view aggregated or site-specific metrics from one platform.
Book a demo to see multi-site capabilities.
Does OxMaint help with ISO 50001 energy management compliance?
OxMaint maintains continuous tamper-proof energy logs with timestamps, baseline tracking, and improvement records aligned to ISO 50001 requirements. Audit documentation exports from the dashboard in minutes.
Sign up for a free trial to evaluate compliance features.
Transform Your Cement Plant Energy Management Today
Ready to eliminate energy blind spots?
See how OxMaint combines real-time energy visibility, automated alerts, and maintenance workflows in one cement plant dashboard.