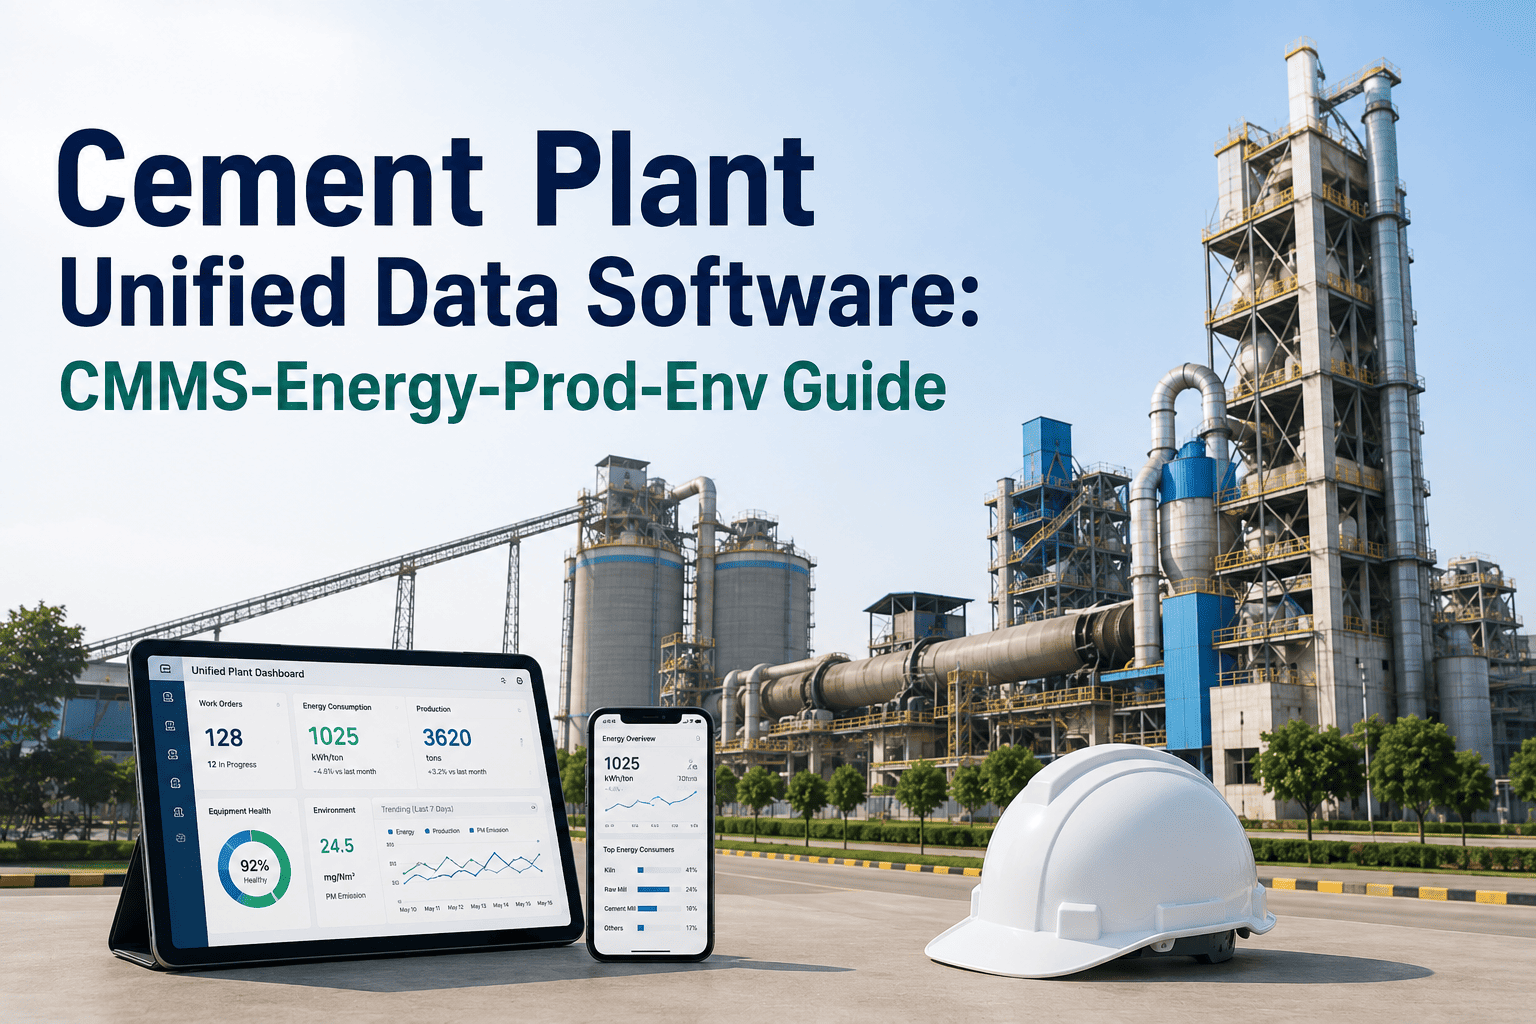
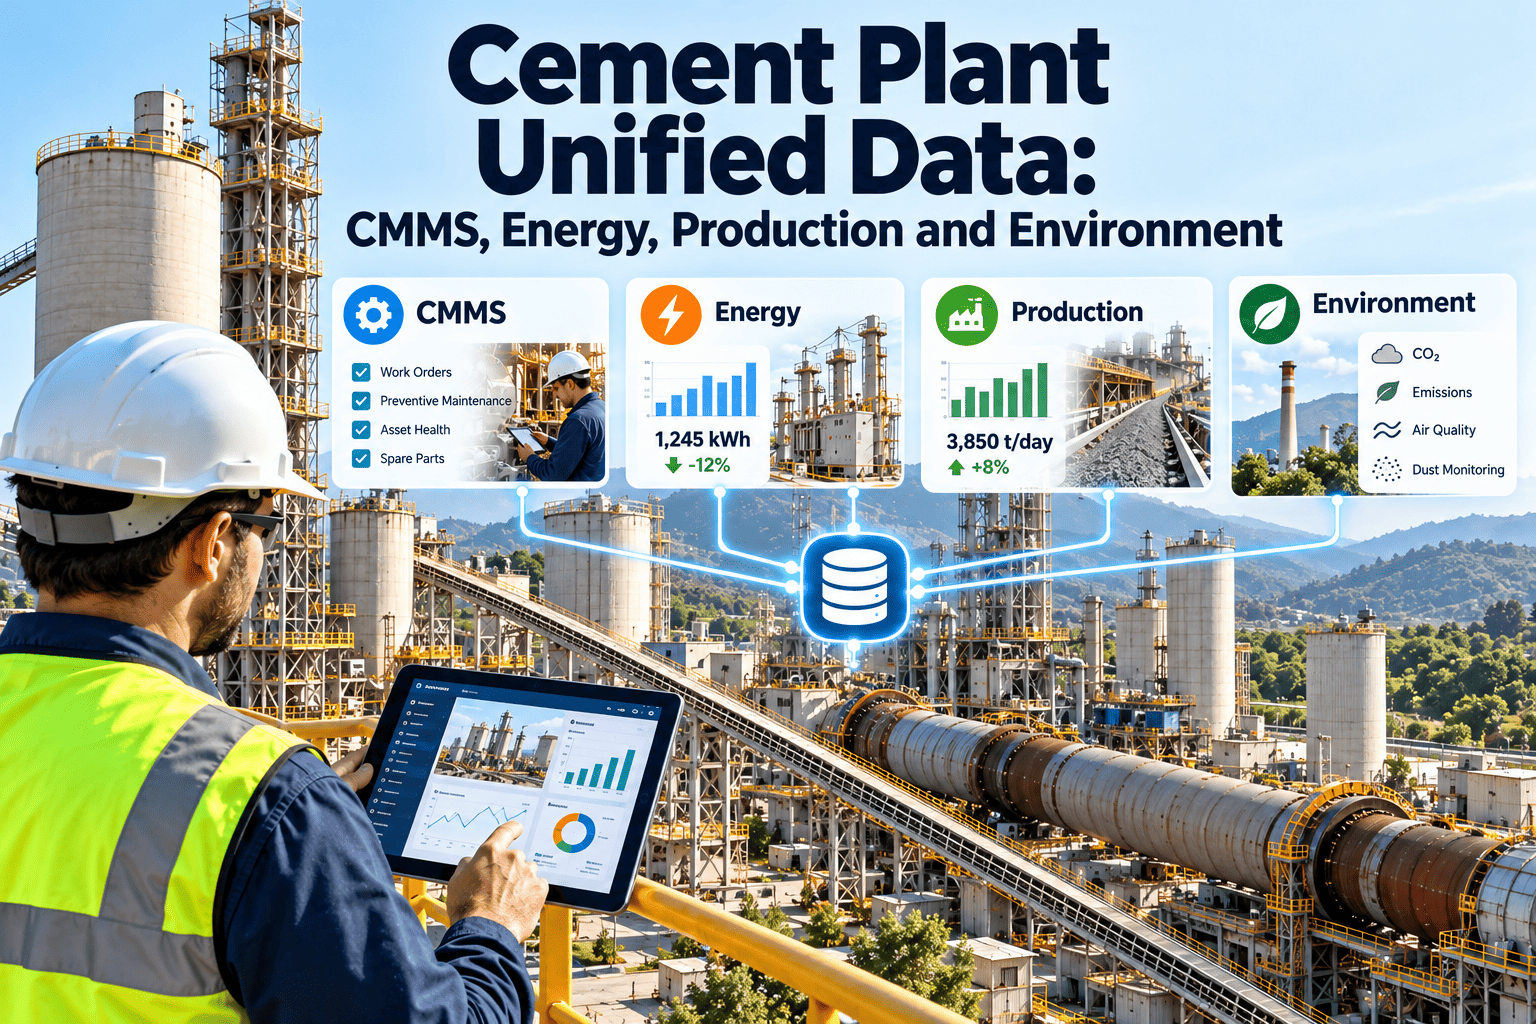
Most cement plants run four systems that never talk to each other — a CMMS for maintenance, a SCADA or energy meter network for power draw, a production MIS for tonnage and OEE, and a separate environmental log for emissions and dust. A kiln trip shows up in all four, but nobody sees the full picture until someone manually pulls four reports and lines them up by timestamp. Book a demo to see a unified plant data record in action.
4 systems
average number of disconnected logs a plant manager reconciles by hand before one monthly review
31%
of unplanned kiln stops correlate with an energy spike that appeared in the SCADA log 20–40 minutes earlier
2.4x
more accurate root-cause identification when a downtime event is reviewed alongside production and environmental data
17%
average reduction in specific energy consumption once maintenance can see which asset conditions raise kWh per tonne
Siloed Systems vs a Unified Plant Record
The four systems below already hold the data a plant needs to see the full story of every event — the problem is that each one only shows its own slice. A unified record ties them to the same asset and timestamp so the story reads as one, not four.
Four logs · manual reconciliation
Maintenance, energy, production, and environmental data each live in their own system. Correlating a downtime event with an energy spike or an emissions reading means exporting four reports and matching timestamps by hand.
Disconnected exports · Slow investigations
One asset record · automatic correlation
Every reading — vibration, kWh, tonnage, or emission value — attaches to the same asset record, timestamped so a maintenance event, an energy spike, and a production dip surface together automatically.
OPC-UA integration · Instant correlation
Where the Four Data Streams Actually Meet
MaintenanceEnergy
Vibration and thermal drift shows on the CMMS side, while specific fuel consumption climbs on the energy side and clinker output drops on production.
MaintenanceEnergy
Oil analysis trends and MCSA alerts pair with rising kWh per tonne ground, while product fineness variability increases on the production side.
MaintenanceEnvironmental
A vibration threshold breach and climbing motor current on the maintenance side line up with dust emission readings trending upward.
MaintenanceEnvironmental
A thermal camera hot spot flags on the CMMS while cooling fan power draw rises and clinker temperature drifts out of spec on production.
The Unified Data Stack
Bringing four systems into one plant record is not a single integration — it is a layered chain from raw source data to a correlated view. The four layers below show how a unified record closes the gap between four separate logs and one story.
Layer 4 — Decision
Correlated Dashboard View
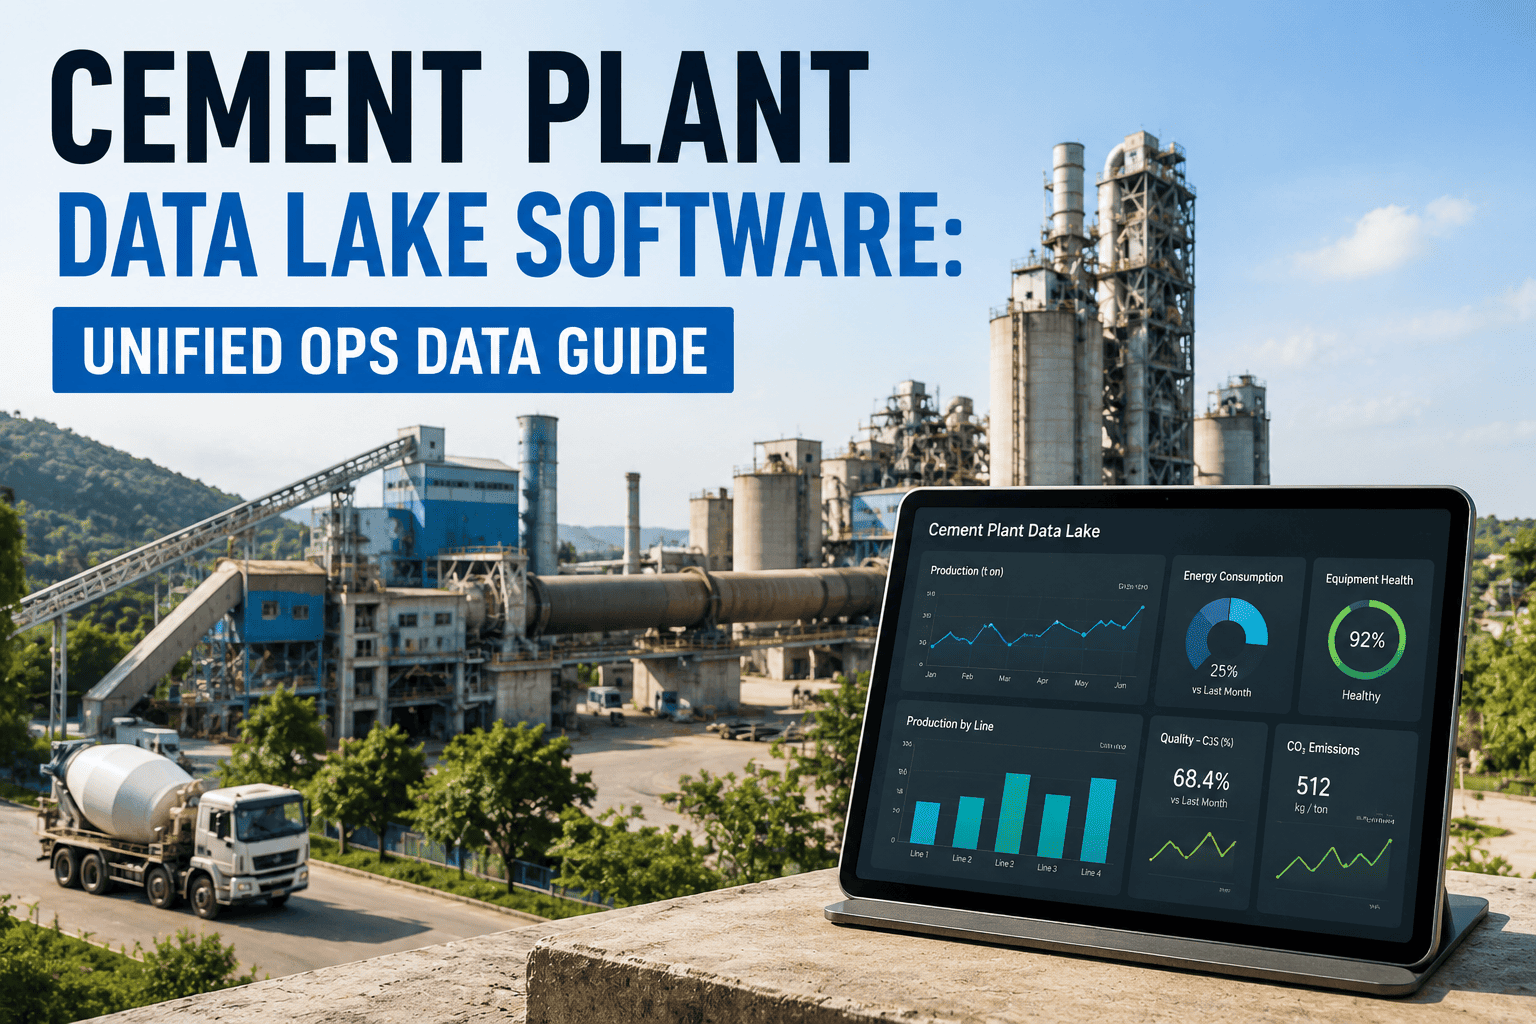
Maintenance, energy, production, and environmental trends for the same asset render side by side, so a shift lead spots the pattern before it becomes an event.
One screen · four data streams
Layer 3 — Correlation
Cross-System Pattern Matching
Oxmaint matches timestamps and asset IDs across all four sources automatically, surfacing correlations like an energy spike preceding a kiln trip.
Automatic timestamp and asset matching
Layer 2 — Connection
OPC-UA and REST API Integration
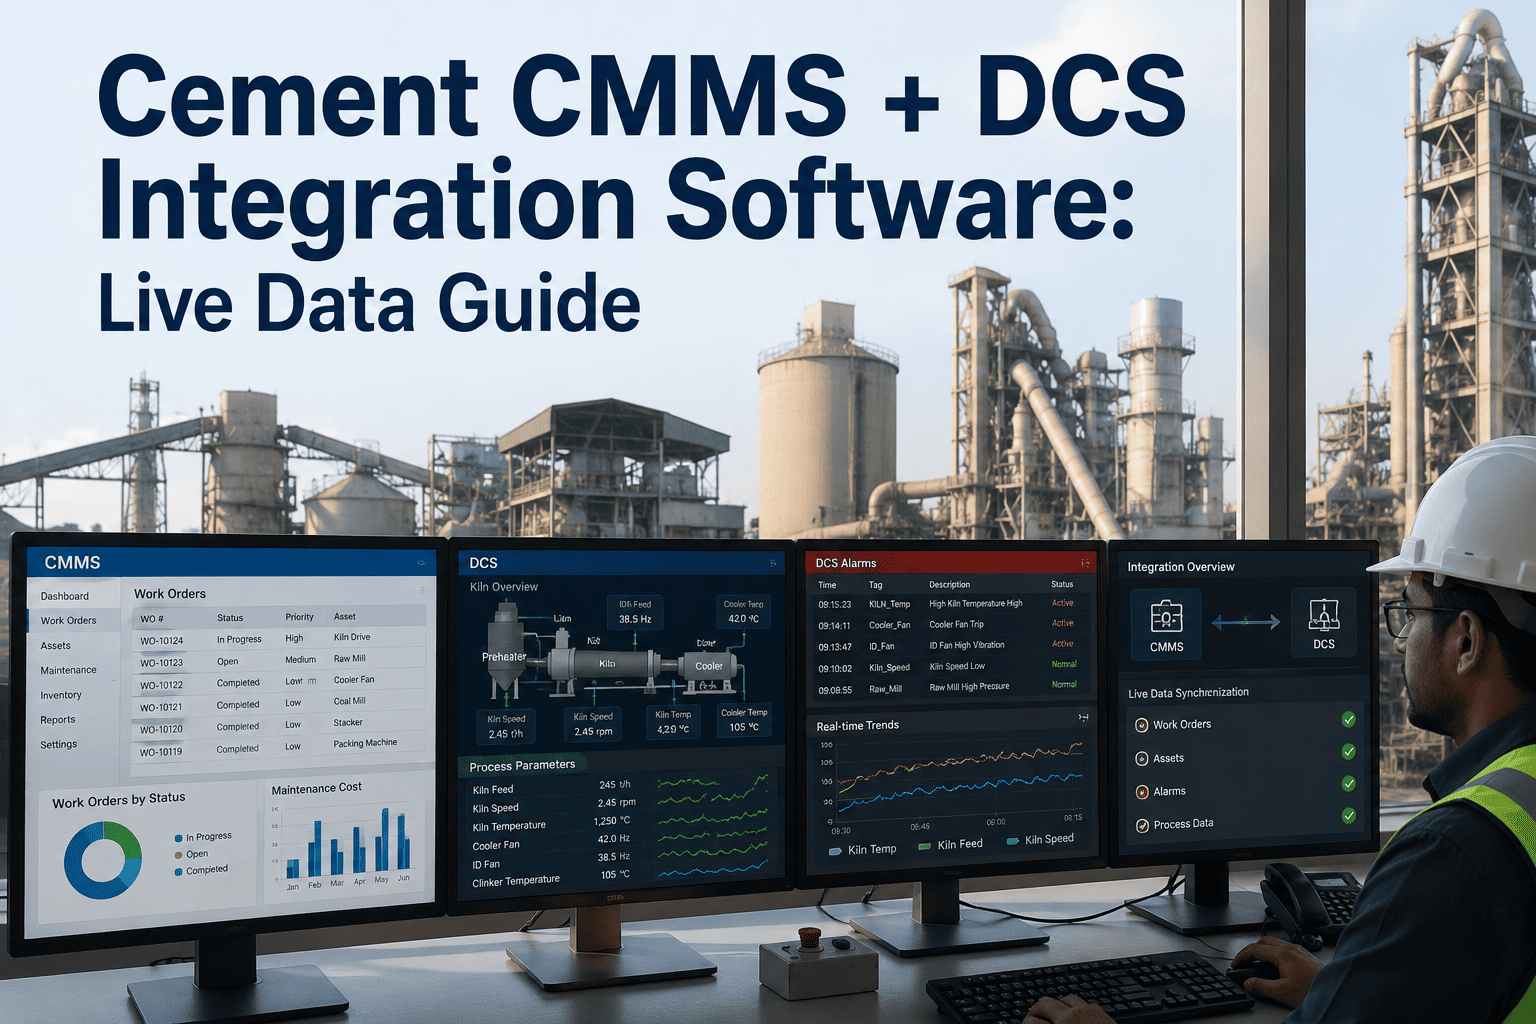
SCADA, energy meters, production MIS, and environmental monitors feed into Oxmaint continuously — no manual export, no re-keying between systems.
Continuous feed, four sources
Layer 1 — Foundation
Single Asset Registry
Every kiln, mill, fan, and motor is registered once in Oxmaint, so readings from any of the four systems attach to the same record instead of four separate ones.
100% asset coverage across all sources
Data Source Coverage by System
| Data Source | Typical Signals | Oxmaint Coverage |
| CMMS / Maintenance |
Work orders, PM schedules, downtime causes, spare parts |
Native asset record, condition scoring, work order history |
| Energy / SCADA |
kWh per tonne, specific power draw, peak demand events |
OPC-UA feed tagged to the same asset, trend correlation |
| Production MIS |
Tonnage, OEE, kiln feed rate, grade changeovers |
REST API sync, production-to-downtime correlation |
| Environmental |
Stack emissions, dust readings, water use, compliance limits |
Threshold-linked alerts, compliance-ready audit trail |
How Oxmaint Unifies Plant Data
Platform Overview
Four capabilities separate a unified plant record from four disconnected logs — continuous source integration, single asset registry, automatic cross-system correlation, and a correlated dashboard view. Oxmaint delivers all four through one connected platform.
OPC-UA Source Integration
Single Asset Registry
Cross-System Correlation
Unified Dashboard
Connect Every Source Once
SCADA, energy, production, and environmental in one integration
Oxmaint connects to each source system via OPC-UA and REST API, so data flows in continuously without manual exports or re-keying between platforms.
One Registry, One Timestamp
Every reading tagged to the same asset and shift
All four data streams attach to a single asset registry, so cross-system correlation happens automatically instead of through manual report matching.
Surface Correlations Automatically
An energy spike before a kiln trip, seen in one view
Patterns that used to require pulling four reports and matching timestamps by hand now surface on the dashboard the moment they occur.
Compliance-Ready Reporting
Environmental and maintenance records already linked
Because emissions and dust readings are already tagged to the same asset and shift record, EHS reporting pulls straight from the unified record.
Progress From Disconnected Logs to One Record
Reduction in time spent reconciling reports across maintenance, energy, and production systems78%
Of plants that found a previously unlinked energy-to-downtime correlation within 90 days65%
Faster environmental compliance reporting when readings are already tied to asset records71%
Frequently Asked Questions
QDo we need to replace our existing SCADA, energy meters, or environmental monitors?
No. Oxmaint connects to what you already run via OPC-UA and REST API.
Book a demo to confirm compatibility with your current systems.
QHow long does it take to unify four separate data systems?
Most plants complete source connection and asset tagging within three to four weeks, with data flowing into one record from day one of go-live.
QWho actually uses the unified record day to day?
Maintenance leads review asset condition, plant managers review the combined dashboard each shift, and EHS teams pull compliance data without a separate log.
QDoes unifying data slow down any one system's reporting?
No. Each source system keeps operating normally — Oxmaint reads and tags the data in parallel without interrupting existing workflows.
QCan we start with just maintenance and energy before adding the rest?
Yes. Most plants phase in sources one at a time.
Start a free trial to connect your first data source and expand from there.
One Plant Record. Four Data Streams. Zero Reconciliation.
Oxmaint unifies maintenance, energy, production, and environmental data so every event tells its full story the moment it happens.